Testing Gateway Theory: do cigarette prices affect illicit drug use?
Testing Gateway Theory: do cigarette prices affect illicit drug use?
Testing Gateway Theory: do cigarette prices affect illicit drug use?

Create successful ePaper yourself
Turn your PDF publications into a flip-book with our unique Google optimized e-Paper software.
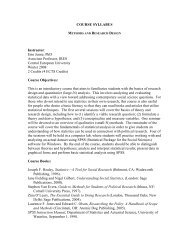
692 M. Beenstock, G. Rahav / Journal of Health Economics 21 (2002) 679–698<br />
Table 4<br />
Comparison between 2SP and 2SBP<br />
Variable 2SP 2SBP<br />
Cigarette <strong>prices</strong> −0.00553 (7.119) −0.00538 (7.133)<br />
ρ 0 0.57 (27.1)<br />
PPS 3.228 (13.058) 3.402 (14.300)<br />
The t-values are shown in parentheses.<br />
two reasons. First, beca<strong>use</strong> PPS is an estimate of its true value. Secondly, beca<strong>use</strong> in any<br />
case IV estimation requires correction of the standard errors in the second stage. We <strong>use</strong> 200<br />
i.i.d. resamplings to calculate the standard errors. Andrews and Buchinsky (1999) discuss<br />
the number of resamplings required to attain a prescribed degree of accuracy for different<br />
P-values. It turns out that the original (unbootstrapped) standard errors provide a reliable<br />
guide to statistical significance. Also, the original parameter estimates reported in Table 3<br />
turn out to be close to the means of their bootstrapped counterparts, suggesting that the<br />
crude estimates are unbiased.<br />
It is noteworthy that if the relative price of <strong>cigarette</strong>s is omitted from Table 2, PPS ceases<br />
to be statistically significant in Table 3. This suggests that there is identifying information<br />
in <strong>cigarette</strong> <strong>prices</strong>, and that the significance of PPS in Table 3 is not simply the result of<br />
parametric identification.<br />
We experimented with other instruments, including herd effects and exposure to <strong>cigarette</strong><br />
regulations. In the former case we <strong>use</strong>d “personalized” <strong>cigarette</strong> consumption per capita<br />
(based in Fig. 2) as an additional covariate in Table 2, but it was not statistically significant. 7<br />
In the latter case, we defined exposure to be the number of adult years lived prior to the<br />
introduction of mandatory health warnings on <strong>cigarette</strong> packets. We expected that more<br />
exposed individuals are more likely to smoke, holding other variables constant. However,<br />
this did not turn out to be the case. This was true when we <strong>use</strong>d a variety of health warning<br />
trigger dates (1983 Israel, 1971 UK, 1965 US) both individually and collectively. If anything,<br />
we found that more exposed individuals, as defined, were less likely to smoke. However, this<br />
may be the manifestation of some complex cohort effect; early birth cohorts are less likely<br />
to smoke. In summary, the main instrument for smoking turned out to be the personalized<br />
relative price of <strong>cigarette</strong>s.<br />
Other results in Table 3 include a negative cohort effect; older birth cohorts are less likely<br />
to <strong>use</strong> cannabis, Sabras (native Israelis) are more likely to <strong>use</strong> cannabis, the uneducated and<br />
the highly educated are more likely to <strong>use</strong> cannabis. When controlling for other factors,<br />
women and secular Jews are more likely to <strong>use</strong> cannabis.<br />
As noted in Section 2.2, 2SL is consistent but not efficient, beca<strong>use</strong> it restricts ρ = 0.<br />
Inefficiency may induce bias in non-linear estimators. To investigate this we re-estimated the<br />
model using two-stage probit (2SP), solved for PPS, and then iterated PPS using two-stage<br />
bivariate probit (2SBP). Coefficient estimates for the main variables of interest are shown<br />
in Table 4.<br />
7 It is possible that prevalence data would have produced different results. See Footnote 5.