Testing Gateway Theory: do cigarette prices affect illicit drug use?
Testing Gateway Theory: do cigarette prices affect illicit drug use?
Testing Gateway Theory: do cigarette prices affect illicit drug use?

Create successful ePaper yourself
Turn your PDF publications into a flip-book with our unique Google optimized e-Paper software.
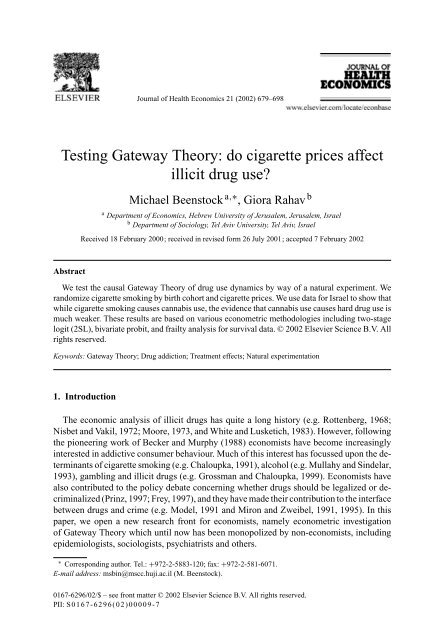
Journal of Health Economics 21 (2002) 679–698<br />
<strong>Testing</strong> <strong>Gateway</strong> <strong>Theory</strong>: <strong>do</strong> <strong>cigarette</strong> <strong>prices</strong> <strong>affect</strong><br />
<strong>illicit</strong> <strong>drug</strong> <strong>use</strong>?<br />
Michael Beenstock a,∗ , Giora Rahav b<br />
a Department of Economics, Hebrew University of Jerusalem, Jerusalem, Israel<br />
b Department of Sociology, Tel Aviv University, Tel Aviv, Israel<br />
Received 18 February 2000; received in revised form 26 July 2001; accepted 7 February 2002<br />
Abstract<br />
We test the causal <strong>Gateway</strong> <strong>Theory</strong> of <strong>drug</strong> <strong>use</strong> dynamics by way of a natural experiment. We<br />
ran<strong>do</strong>mize <strong>cigarette</strong> smoking by birth cohort and <strong>cigarette</strong> <strong>prices</strong>. We <strong>use</strong> data for Israel to show that<br />
while <strong>cigarette</strong> smoking ca<strong>use</strong>s cannabis <strong>use</strong>, the evidence that cannabis <strong>use</strong> ca<strong>use</strong>s hard <strong>drug</strong> <strong>use</strong> is<br />
much weaker. These results are based on various econometric metho<strong>do</strong>logies including two-stage<br />
logit (2SL), bivariate probit, and frailty analysis for survival data. © 2002 Elsevier Science B.V. All<br />
rights reserved.<br />
Keywords: <strong>Gateway</strong> <strong>Theory</strong>; Drug addiction; Treatment effects; Natural experimentation<br />
1. Introduction<br />
The economic analysis of <strong>illicit</strong> <strong>drug</strong>s has quite a long history (e.g. Rottenberg, 1968;<br />
Nisbet and Vakil, 1972; Moore, 1973, and White and Lusketich, 1983). However, following<br />
the pioneering work of Becker and Murphy (1988) economists have become increasingly<br />
interested in addictive consumer behaviour. Much of this interest has focussed upon the determinants<br />
of <strong>cigarette</strong> smoking (e.g. Chaloupka, 1991), alcohol (e.g. Mullahy and Sindelar,<br />
1993), gambling and <strong>illicit</strong> <strong>drug</strong>s (e.g. Grossman and Chaloupka, 1999). Economists have<br />
also contributed to the policy debate concerning whether <strong>drug</strong>s should be legalized or decriminalized<br />
(Prinz, 1997; Frey, 1997), and they have made their contribution to the interface<br />
between <strong>drug</strong>s and crime (e.g. Model, 1991 and Miron and Zweibel, 1991, 1995). In this<br />
paper, we open a new research front for economists, namely econometric investigation<br />
of <strong>Gateway</strong> <strong>Theory</strong> which until now has been monopolized by non-economists, including<br />
epidemiologists, sociologists, psychiatrists and others.<br />
∗ Corresponding author. Tel.: +972-2-5883-120; fax: +972-2-581-6071.<br />
E-mail address: msbin@mscc.huji.ac.il (M. Beenstock).<br />
0167-6296/02/$ – see front matter © 2002 Elsevier Science B.V. All rights reserved.<br />
PII: S0167-6296(02)00009-7
680 M. Beenstock, G. Rahav / Journal of Health Economics 21 (2002) 679–698<br />
<strong>Gateway</strong> <strong>Theory</strong> was originally developed in the 1970s by Kandel (1975). She observed<br />
that there is a systematic sequencing in the <strong>use</strong> of psychoactive substances which runs from<br />
alcohol and <strong>cigarette</strong>s, then to cannabis, and finally to “hard” <strong>drug</strong>s such as cocaine, heroin<br />
and LSD. Cigarettes are a “gateway” to cannabis, which in turn is a “gateway” to hard <strong>drug</strong>s.<br />
Of course not all <strong>cigarette</strong> smokers go on to <strong>use</strong> cannabis, and it should be noted that not<br />
all cannabis consumers first smoked <strong>cigarette</strong>s. Nevertheless, <strong>cigarette</strong> smokers are more<br />
likely to <strong>use</strong> cannabis subsequently than non-smokers. A similar juxtaposition applies to<br />
cannabis and hard <strong>drug</strong>s; cannabis <strong>use</strong>rs are more likely to <strong>use</strong> hard <strong>drug</strong>s eventually than<br />
non-<strong>use</strong>rs of cannabis, but not all hard <strong>drug</strong> consumers <strong>use</strong>d cannabis first.<br />
The scientific literature on <strong>Gateway</strong> <strong>Theory</strong> is too vast to be reviewed here. However,<br />
it splits into two broad camps. One camp (e.g. O’Donnell and Clayton, 1982) regards the<br />
gateway effect to be causal or generative. According to this view <strong>cigarette</strong> smoking induces<br />
cannabis <strong>use</strong>, and cannabis <strong>use</strong> induces hard <strong>drug</strong> consumption. This implies that if smoking<br />
were restricted there would be less <strong>use</strong> of cannabis. It also implies that if cannabis were<br />
legalized there would be more <strong>use</strong> of hard <strong>drug</strong>s. It is obvious how this causal interpretation<br />
of <strong>Gateway</strong> <strong>Theory</strong> has been grist to the mill of the anti liberalization lobby. The rival camp<br />
(e.g. Baumrind, 1983) views the gateway effect to be merely predictive or even descriptive.<br />
Economists will recognize this as Granger causality; due to systematic sequencing <strong>cigarette</strong><br />
consumption may help predict cannabis consumption, and cannabis consumption may help<br />
predict hard <strong>drug</strong> consumption. However, Granger causality <strong>do</strong>es not imply causality itself<br />
and has no implications for policy.<br />
The longstanding debate about <strong>Gateway</strong> <strong>Theory</strong> revolves around the identification problem.<br />
Does the fact that <strong>cigarette</strong> smokers are more likely to go onto <strong>use</strong> cannabis result<br />
from unobserved heterogeneity, i.e. people with a greater susceptibility to smoke <strong>cigarette</strong>s<br />
also have a greater susceptibility to consume cannabis, or <strong>do</strong>es it result from a treatment<br />
effect, i.e. exposure to <strong>cigarette</strong>s (the treatment) induces cannabis <strong>use</strong> (the outcome)? The<br />
vast number of empirical papers on <strong>Gateway</strong> <strong>Theory</strong> have not resolved the identification<br />
problem.<br />
One way to resolve this identification problem is to apply the metho<strong>do</strong>logy of natural<br />
experimentation, which in the present context seeks to ran<strong>do</strong>mize <strong>cigarette</strong> smoking so that<br />
its causal effect on subsequent <strong>use</strong> of cannabis is identified. We <strong>use</strong> the data for Israel to<br />
apply the metho<strong>do</strong>logy, and follow Evans and Ringel (1999) who study the effect of smoking<br />
on birth weights by using <strong>cigarette</strong> price data to ran<strong>do</strong>mize smoking behavior. They <strong>use</strong><br />
cross section data and ran<strong>do</strong>mize <strong>cigarette</strong> smoking by exploiting differential tax rates on<br />
<strong>cigarette</strong>s in the US. Pacula (1998) too <strong>use</strong>s cross section data to identify the gateway effect<br />
of alcohol by exploiting differential tax rates on alcohol in the US.<br />
Natural experiments in econometrics usually exploit cross section differences in instrumental<br />
variables. A metho<strong>do</strong>logical innovation in our approach to natural experimentation<br />
consists of exploiting time series data rather than cross section data. We <strong>do</strong> so beca<strong>use</strong><br />
there are no cross sectional or geographical differences in <strong>cigarette</strong> <strong>prices</strong> (or other potential<br />
instruments) in Israel. However, there has been extensive variation in the real price of<br />
<strong>cigarette</strong>s over time. People who grew up when <strong>cigarette</strong>s were cheap are more likely to<br />
smoke than people who grew up when they were expensive. Beca<strong>use</strong> individuals <strong>do</strong> not<br />
chose their year of birth or the price of <strong>cigarette</strong>s and other variables we have the basis of<br />
a natural experiment.
M. Beenstock, G. Rahav / Journal of Health Economics 21 (2002) 679–698 681<br />
The remainder of the paper is organized as follows. In Section 2, we describe the metho<strong>do</strong>logy<br />
that we <strong>use</strong> for testing <strong>Gateway</strong> <strong>Theory</strong>. In Section 3 we describe the data which come<br />
from nationwide surveys of Jews in Israel conducted in 1989, 1992 and 1995. In Section 4,<br />
we perform two tests of <strong>Gateway</strong> <strong>Theory</strong>. In the first test we focus on sequencing and investigate<br />
whether smoking eventually induces cannabis <strong>use</strong>, and whether the latter eventually<br />
induces <strong>use</strong> of hard <strong>drug</strong>s. In the second, we focus on timing and investigate whether earlier<br />
initiation of smoking induces earlier initiation of cannabis <strong>use</strong>. The latter attaches importance<br />
to timing of the gateway effect, whereas the former <strong>do</strong>es not. Our main conclusions<br />
for Israel are that <strong>cigarette</strong> smoking causally increases the likelihood of subsequently using<br />
cannabis, but cannabis <strong>use</strong> <strong>do</strong>es not causally increase the likelihood of subsequently using<br />
hard <strong>drug</strong>s.<br />
2. Metho<strong>do</strong>logy<br />
2.1. Linear probability<br />
The first hypothesis of interest is <strong>do</strong>es <strong>cigarette</strong> smoking increase the probability of<br />
subsequently using cannabis? Define C n = 1, if individual n smoked <strong>cigarette</strong>s and 0<br />
otherwise, and S n = 1, if individual n subsequently <strong>use</strong>d cannabis and 0 otherwise. We<br />
exclude those who consumed cannabis either prior to smoking <strong>cigarette</strong>s or who did so<br />
without smoking. These exceptions have troubled gateway theorists, but they are not relevant<br />
for testing the first hypothesis, which <strong>do</strong>es not claim that <strong>cigarette</strong>s are a precondition for<br />
cannabis.<br />
Although in Section 4 we <strong>do</strong> not apply the linear probability model, we <strong>use</strong> it here<br />
to illustrate the metho<strong>do</strong>logical issues involved. We <strong>use</strong> time subscripts (t) to indicate<br />
sequencing of <strong>drug</strong> <strong>use</strong>, and to remind us, e.g. that C occurs before S. <strong>Gateway</strong> <strong>Theory</strong><br />
suggests:<br />
S nt = αX nt + βC n(t−1) + γ y D y + u nt (1)<br />
where X is a vector of controls including personal characteristics, D y the birth cohort indicator<br />
for those born in year y, and u an unobserved error term. <strong>Gateway</strong> <strong>Theory</strong> hypothesizes<br />
that β>0. By definition C t−1 is predetermined beca<strong>use</strong> it occurs prior to S t . However,<br />
this <strong>do</strong>es not help identify the treatment effect of C upon S beca<strong>use</strong> C and u are likely to be<br />
positively correlated. This arises from the auxiliary model for smoking:<br />
C n(t−1) = φZ n(t−1) + θ y D y + v n(t−1) (2)<br />
where Z is a vector of controls determining smoking and v denotes the unobserved heterogeneity<br />
in smoking. If people with a natural susceptibility to <strong>cigarette</strong>s are also more<br />
susceptible to cannabis, then E(u t v t−1 )>0, in which case estimates of β will be biased<br />
upwards. If in this case, the estimate of β is positive and statistically significant when in<br />
reality β = 0, there is Granger causality but no genuine or generative causality. Prior knowledge<br />
of C t−1 may be <strong>use</strong>d to predict S t . If in addition the estimate of β is not statistically<br />
significant, there is neither Granger causality nor generative causality.
682 M. Beenstock, G. Rahav / Journal of Health Economics 21 (2002) 679–698<br />
The solution to this problem is to instrument C t−1 in Eq. (1). No <strong>do</strong>ubt Z and X largely<br />
overlap. An element of Z is the price of <strong>cigarette</strong>s (and other variables discussed in Section 4)<br />
that prevailed when individual n was growing up (P n(t−1) ), which are hypothesized to<br />
determine the demand for <strong>cigarette</strong>s but not the demand for cannabis. We expect C t−1 to<br />
vary inversely with P t−1 . There is no reason to suspect that P t−1 and v t−1 are correlated<br />
(nor P t−1 and u t ). If S t <strong>do</strong>es not depend upon P t−1 , then P t−1 identifies the effect of C t−1<br />
upon S t in Eq. (1).<br />
The next step in the gateway chain concerns the relationship between cannabis and<br />
hard <strong>drug</strong>s. The hypothesis of interest here is <strong>do</strong>es exposure to cannabis induce a higher<br />
probability of subsequently using hard <strong>drug</strong>s? We denote H n = 1 if individual n <strong>use</strong>d hard<br />
<strong>drug</strong>s after using cannabis and 0 otherwise. We express this as follows:<br />
H n(t+1) = λY n(t+1) + δS nt + ρ y D y + w n(t+1) (3)<br />
where Y is a vector of controls for hard <strong>drug</strong> <strong>use</strong>. <strong>Gateway</strong> <strong>Theory</strong> suggests δ>0. Since<br />
we suspect that E(wu) >0 unobserved heterogeneity is likely to bias upwards estimates<br />
of δ. Ideally, we seek exclusion restrictions for Y and X such as <strong>drug</strong> price data, which are<br />
not available in Israel. Instead, we suggest using as an instrument for S t in Eq. (3) its fitted<br />
value from IV estimation of Eq. (1). We refer to this as “<strong>do</strong>mino” identification beca<strong>use</strong><br />
the natural experiment is indirect. Clearly, such indirect identification weakens the power<br />
of tests on the value of δ. Ran<strong>do</strong>m exposure to <strong>cigarette</strong>s at time t − 1 induces cannabis<br />
consumption at time t, which in turn, induces hard <strong>drug</strong> <strong>use</strong> at time t + 1. If β and δ are<br />
properly identified, and there is a causal gateway effect, we can expect a chain reaction<br />
where raising the price of <strong>cigarette</strong>s will reduce <strong>cigarette</strong> smoking, which will reduce the<br />
subsequent <strong>use</strong> of cannabis, which, in turn, will reduce the subsequent <strong>use</strong> of hard <strong>drug</strong>s.<br />
Note that Eqs. (1)–(3) control for cohort effects. This is possible beca<strong>use</strong> we <strong>use</strong> several<br />
surveys in Section 4 (y = year of survey − age). Had there been only one survey it would<br />
not have been possible to identify the separate effects of P t−1 and birth cohort upon <strong>drug</strong><br />
consumption.<br />
2.2. Recursive bivariate probit and two-stage procedures<br />
If u and v in Eqs. (1) and (2) happen to be bivariate normal with cov(u, v) = ρ then<br />
the model may be estimated by maximum likelihood as a recursive bivariate probit (RBP)<br />
model (Maddala, 1983, pp. 122–123, Greene, 2000, pp. 852–825). Note that in this case C in<br />
Eq. (1) <strong>do</strong>es not have to be instrumented beca<strong>use</strong>, in contrast to the linear probability model,<br />
it is not estimated by least squares. However, Maddala points out that identification requires<br />
that X omit covariates in Z.IfX = Z the model is not identified, even parametrically.<br />
Maddala suggests that an alternative procedure is to specify prob (C ∗ > 0) in Eq. (1)<br />
instead of C, where C ∗ denotes the underlying latent variable that measures the propensity<br />
to smoke <strong>cigarette</strong>s. In this case, it may be shown that a two-stage procedure provides<br />
consistent estimates of the parameters in Eqs. (1) and (2). In the first stage, Eq. (2) is<br />
estimated by probit or logit, and in the second stage the predicted probability of C obtained<br />
from the first stage is <strong>use</strong>d to replace C in Eq. (1).<br />
There are advantages and disadvantages to both procedures. The main disadvantage of<br />
RBP is that it may be sensitive to parametric assumptions about the unobserved heterogeneity.
M. Beenstock, G. Rahav / Journal of Health Economics 21 (2002) 679–698 683<br />
If u and v <strong>do</strong> not happen to be bivariate normal then estimates of β in Eq. (1) will be biased<br />
and inconsistent (unless ρ = 0). This problem <strong>do</strong>es not arise in the two-stage procedure<br />
beca<strong>use</strong> it <strong>do</strong>es not require estimates of ρ. The disadvantage of the two-stage procedure is<br />
that although it is consistent, it is not efficient. By contrast, RBP estimates are consistent<br />
and efficient provided that u and v happen to be bivariate normal.<br />
In Section 4, we <strong>use</strong> both procedures. 1 However, the main results that we report are for<br />
two-stage logit (2SL), mainly beca<strong>use</strong> it is less parametric, and is therefore less sensitive<br />
to mis-specification error. A disadvantage of the two-stage procedure is that the standard<br />
errors of the parameters are difficult to calculate (Maddala, 1983, p. 247). In Section 4, we<br />
<strong>use</strong> a bootstrap procedure to calculate them.<br />
2.3. Hazard analysis<br />
In this section, we focus on the timing of events rather than their sequencing. The specific<br />
questions we ask are whether earlier initiation of <strong>cigarette</strong> smoking ca<strong>use</strong>s earlier initiation<br />
of cannabis, and whether the latter ca<strong>use</strong>s earlier initiation of hard <strong>drug</strong>s. Elsewhere<br />
(Beenstock and Rahav, 2001), we suggest the <strong>use</strong> of long term survivor models to specify<br />
the initiation hazard since <strong>drug</strong> <strong>use</strong> is a minority activity. This is also the approach <strong>use</strong>d<br />
by Douglas and Hariharan (1994). However, this approach is not practical in the current,<br />
more complicated, context in which our objective is to identify treatment effects. Instead,<br />
we model <strong>drug</strong> <strong>use</strong> initiation using Cox’s proportional hazards model (CPHM), which has<br />
the advantage of not necessarily implying that it is a matter of time before everyone <strong>use</strong>s<br />
<strong>drug</strong>s. 2<br />
The counterpart of Eq. (1) for individual n’s hazard of using cannabis ( s ) is:<br />
λ s (t n ) = λ s0 (t n ) exp − (X n α + βA cn + γ y D yn ) (4)<br />
where A cn denotes the age at which individual n first smoked <strong>cigarette</strong>s, X and D are defined<br />
as in Eq. (1), and s0 is the “baseline” hazard. We denote the age of cannabis initiation by<br />
A s >A c by definition. According to <strong>Gateway</strong> <strong>Theory</strong> β > 0, since people who begin<br />
smoking later will initiate cannabis later. Unobserved heterogeneity is likely to generate<br />
positive covariance between A s and A c , which will bias upwards estimates of β. We suggest<br />
that instead of using A c in Eq. (4) it should be replaced by its expected value as determined<br />
from a CPHM for <strong>cigarette</strong> smoking. The specification of the hazard for <strong>cigarette</strong> smoking<br />
(λ c ) parallels Eq. (2) and is written as follows:<br />
λ c (t n ) = λ c0 (t n ) exp − (Z n φ + θ y D yn ) (5)<br />
where Z is defined as in Eq. (2). Eq. (5) implies that expected age at <strong>cigarette</strong> initiation is:<br />
E(A cn ) = exp[−Λ c (t) exp(Z n φ + θ y D yn )] (6)<br />
where Λ c denotes the integrated hazard function for smoking evaluated at the mean. We<br />
suggest a two-stage procedure in which Eq. (5) is estimated in the first stage and the solution<br />
1 Evans and Ringel (1999) in a similar situation to ours, side-step these metho<strong>do</strong>logical issues.<br />
2 Larson and Dinse (1985) propose a long term survivor model for CPHM which is <strong>use</strong>d in Beenstock and Rahav<br />
(2001).
684 M. Beenstock, G. Rahav / Journal of Health Economics 21 (2002) 679–698<br />
to Eq. (6) is <strong>use</strong>d to replace A c in Eq. (4) in the second stage. The parameter standard errors in<br />
the second stage are bootstrapped. Having thus estimated Eq. (4), we may <strong>use</strong> it to calculate<br />
E(A s ) and to replace A s in a CPHM for hard <strong>drug</strong>s.<br />
In the bio-statistical literature this class of dependent hazard model is known as a “frailty”<br />
model (Hougaard, 1995; Klein and Moeschberger, 1997). Frailty models usually consist of<br />
two hazards functions that happen to be stochastically related. If u denotes the stochastic<br />
component of the empirical hazard function for <strong>cigarette</strong> initiation, and v denotes its counterpart<br />
for cannabis initiation, then frailty models estimate the parameter ρ = cov(u, v).<br />
However, they <strong>do</strong> not usually specify A c in the hazard function for cannabis. Here, we<br />
specify the dependence between the two hazard functions directly via β in Eq. (1), as in the<br />
two-stage procedure that we have described. A more general specification would estimate<br />
both ρ as well as β in Eq. (4), i.e. frailty may be transmitted directly via β and indirectly<br />
via ρ. 3<br />
3. The data<br />
3.1. The surveys<br />
The data to be <strong>use</strong>d in the present analysis are from three epidemiological surveys carried<br />
out in Israel by the Israel Anti-Drug Authority in 1989 (N = 5280), 1992 (N = 1816) and<br />
1995 (N = 5044), providing a total of some 12,700 observations. While sample size varied<br />
between surveys, the sampling procedure remained the same. The sample is intended to<br />
represent the Jewish population in Israel aged 18–40 years. It was based on a geographic<br />
sample of points in each of the larger Jewish cities and towns (i.e. with population of<br />
30,000 or more) and a sample of the smaller localities. Starting at each of these geographic<br />
points a cluster of 10 residential apartments was sampled. Experienced interviewers first<br />
checked if there were individuals in the designated age bracket in the ho<strong>use</strong>hold. One<br />
individual was selected from each ho<strong>use</strong>hold by one of two, predetermined methods: either<br />
the first available eligible person was interviewed, or the interviewee was selected by the<br />
Troldahl–Carter method (for more details see Barnea et al. (1990)).<br />
Interviewers were instructed to make at least three attempts to obtain a sampled ho<strong>use</strong>hold,<br />
or person within the ho<strong>use</strong>hold. If there was no response from an apartment there was no<br />
way of determining whether it is residential, commercial, or an unoccupied apartment. Most<br />
probably there is some under-representation of new immigrants, and others who are either<br />
away from home much of their time, or <strong>do</strong> not speak Hebrew. Otherwise, the sample seems<br />
to be representative of Israeli Jews in this age bracket who live at home. It <strong>do</strong>es not cover<br />
at all institutionalized persons, including those in military service away from home and<br />
prisoners, nor members of Kibbutzim (collective farms) who make up about 2% of the<br />
population.<br />
3 In the classic frailty model the survival hazards of parents and children are assumed to be related via ρ. This<br />
has a genetic interpretation; strong parents breed strong children. Additionally, or independently, there may be a<br />
behavioral effect in that the early death of the parent may adversely <strong>affect</strong> the survival of the child. This direct<br />
frailty effect is captured by β. We are unaware of empirical examples where direct and indirect frailty effects are<br />
estimated.
M. Beenstock, G. Rahav / Journal of Health Economics 21 (2002) 679–698 685<br />
Table 1<br />
Sequencing in ever <strong>use</strong> of substances (%)<br />
From<br />
To<br />
Cigarettes Cannabis Hard <strong>drug</strong>s Stopped<br />
Nothing 1.1 0<br />
Cigarettes 12.2 2.9 24.6<br />
Cannabis 5.2 12.5 58.6<br />
Hard <strong>drug</strong>s 5.5 11.0 62.1<br />
Total 59.0 8.2 1.15<br />
Data on <strong>cigarette</strong>, alcohol and <strong>illicit</strong> <strong>drug</strong> consumption were collected through a series<br />
of questions using the following structure:<br />
1. Have you ever <strong>use</strong>d X?<br />
2. If yes, how old were you when you <strong>use</strong>d X for the first time?<br />
3. If yes, how much X have you <strong>use</strong>d (a) ever, (b) during the last year, (c) during the last<br />
month? Fill in relevant category of <strong>use</strong>.<br />
The data were collected using face-to-face interviews. However, respondents provided<br />
answers to questions on <strong>illicit</strong> <strong>drug</strong> data anonymously at the end of the interview. 4<br />
Individuals who report positive ever-<strong>use</strong> of X but have not <strong>use</strong>d X during the last year are<br />
deemed to have stopped using it (at least for the time being). Table 1 gives a bird’s eye view<br />
of the data and the sequencing of <strong>drug</strong> <strong>use</strong>. The bottom row of the table records the total who<br />
ever <strong>use</strong>d the particular substance. For example, 59% of those who participated in the three<br />
samples reported that they ever smoked, while only 1.15% reported that they ever <strong>use</strong>d hard<br />
<strong>drug</strong>s (cocaine, heroin, LSD). These totals <strong>do</strong> not take account of sequencing. The rows<br />
in Table 1 indicate sequencing. For example, 12.2% of <strong>cigarette</strong> smokers subsequently<br />
<strong>use</strong>d cannabis, and 2.9% subsequently <strong>use</strong>d hard <strong>drug</strong>s without using cannabis first. A<br />
total of 12.5% of cannabis <strong>use</strong>rs subsequently <strong>use</strong>d hard <strong>drug</strong>s. Note that the data are not<br />
entirely consistent with gateway sequencing. A total of 1.1% <strong>use</strong>d cannabis without smoking<br />
<strong>cigarette</strong>s first, i.e. about 5.5% of cannabis <strong>use</strong>rs did not smoke first. A total of 5.2% of<br />
cannabis <strong>use</strong>rs subsequently started smoking <strong>cigarette</strong>s.<br />
Such reverse gateway behavior is also apparent in the consumption of hard <strong>drug</strong>s. 2.9%<br />
of <strong>cigarette</strong> smokers subsequently <strong>use</strong>d hard <strong>drug</strong>s without first using cannabis. 11% of<br />
hard <strong>drug</strong> <strong>use</strong>rs subsequently <strong>use</strong>d cannabis and 5.5% of then subsequently started smoking<br />
<strong>cigarette</strong>s.<br />
It is clear that <strong>cigarette</strong> smoking is neither a necessary nor sufficient precondition for<br />
cannabis, which in turn is neither a necessary nor sufficient precondition for hard <strong>drug</strong>s. Most<br />
investigators of the gateway sequencing hypothesis would tend to accept such deviations as<br />
being within the margin of error. Our view is that the issue is not important. The important<br />
question is not whether it is possible to <strong>use</strong> cannabis prior to <strong>cigarette</strong>s (it evidently is),<br />
4 It is well known that despite attempts to guarantee confidentiality such data may contain reporting errors.<br />
Tsibel (2000) <strong>use</strong>s our data to estimate a true model and a miss-reporting model. She finds that miss-reporting<br />
depends upon age and the number of inconsistencies in replies.
686 M. Beenstock, G. Rahav / Journal of Health Economics 21 (2002) 679–698<br />
but whether incidental <strong>use</strong> of <strong>cigarette</strong>s increases the risk of subsequently using cannabis.<br />
Likewise, the question will be whether the incidental <strong>use</strong> of cannabis increases the risk of<br />
subsequently using hard <strong>drug</strong>s.<br />
Table 1 further indicates that the majority of <strong>illicit</strong> <strong>drug</strong> <strong>use</strong>rs stop using them, e.g. 62.1%<br />
of hard <strong>drug</strong> <strong>use</strong>rs had stopped. The table shows that the proportion of <strong>cigarette</strong> smokers<br />
who stop smoking is smaller than the proportion of stoppers among <strong>illicit</strong> <strong>drug</strong> <strong>use</strong>rs. The<br />
data are truncated beca<strong>use</strong> <strong>use</strong>rs may stop after the survey date. We have shown elsewhere<br />
(Beenstock and Rahav, 2000) that the data in the table understate the true rates of stopping,<br />
and that whereas the stopping hazard for cannabis is duration dependent, the stopping hazard<br />
for hard <strong>drug</strong>s is age dependent.<br />
We <strong>do</strong> not attach importance to alcohol as a gateway substance, beca<strong>use</strong> in Israel the<br />
cultural significance of alcohol is quite different from its significance in other western<br />
countries. Apart from the usual demographic variables, such as age, education, country of<br />
origin, and father’s country of origin, the surveys also contain data about religious practice,<br />
frequency of pub visits, and a range of economic variables.<br />
3.2. Instrumental variables<br />
To identify the gateway effect of <strong>cigarette</strong>s on cannabis <strong>use</strong> we seek instruments, which<br />
<strong>affect</strong> the <strong>use</strong> of <strong>cigarette</strong>s without simultaneously <strong>affect</strong>ing the <strong>use</strong> of cannabis. Tobacco<br />
taxes are uniform in Israel (except in Eilat where there is no VAT), hence we cannot implement<br />
Evans and Ringel’s (1999) idea. However, <strong>cigarette</strong> taxes have changed over time,<br />
as has the world price of tobacco. This suggests that the relative price of <strong>cigarette</strong>s may<br />
serve as a possible instrument for smoking. People who grew up when <strong>cigarette</strong>s were<br />
relatively cheap are more likely to smoke, given everything else, than people who grew<br />
up when <strong>cigarette</strong>s were expensive. In this case, ran<strong>do</strong>mization is by birth cohort and the<br />
price of <strong>cigarette</strong>s. The natural experiment consists of investigating whether birth cohorts<br />
who matured when <strong>cigarette</strong>s were relatively cheap were more prone to smoking, and as a<br />
consequence, were more prone to <strong>use</strong> cannabis.<br />
The crucial identifying restriction is that the price of <strong>cigarette</strong>s at the time when individual<br />
n was growing up <strong>affect</strong>s the probability of him smoking them, but it <strong>do</strong>es not <strong>affect</strong> the<br />
probability of using cannabis at a later date. There is no intertemporal substitution between<br />
<strong>cigarette</strong>s and cannabis; e.g. consumers <strong>do</strong> not plan to consume cannabis in the future as a<br />
result of an increase in the current price of <strong>cigarette</strong>s. In this sense, we assume consumers<br />
are myopic. If this were not the case the gateway effect would be inverted; when <strong>cigarette</strong><br />
consumption falls cannabis consumption should increase. We show later that this <strong>do</strong>es<br />
not happen in practice, and that cannabis consumption is not <strong>affect</strong>ed by <strong>cigarette</strong> <strong>prices</strong>,<br />
whereas <strong>cigarette</strong> consumption is so <strong>affect</strong>ed. This <strong>do</strong>es not necessarily mean that there is<br />
no intratemporal substitution between <strong>cigarette</strong>s and cannabis. If an individual eventually<br />
happens to consume both <strong>cigarette</strong>s and cannabis a change in their relative price might<br />
induce him to alter his relative demand for <strong>cigarette</strong>s.<br />
Unfortunately, there are no systematic data for cannabis <strong>prices</strong> in Israel. Had they existed,<br />
however, we would have dated them at time t rather than time t − 1 beca<strong>use</strong>, according to<br />
gateway sequencing, cannabis initiation at time t−1 <strong>do</strong>es not depend upon cannabis <strong>prices</strong> at<br />
a later date (time t) they would have constituted a further source of identifying information.
M. Beenstock, G. Rahav / Journal of Health Economics 21 (2002) 679–698 687<br />
The approach may be extended to other variables with possibly identifying power. These<br />
include exposure to anti-smoking regulations such as the introduction of mandatory health<br />
warnings. Older birth cohorts, who were young before such regulations were introduced, are<br />
more likely to smoke, given other considerations, than younger birth cohorts. The accident<br />
of birth serves to ran<strong>do</strong>mize exposure to the regulatory environment.<br />
A third possible source of natural experimentation consists of the herd effect; the individual<br />
who happens to grow up when smoking is more prevalent may be more likely to<br />
smoke as a result of demonstration effects. Since the individual has no control over his<br />
environment, aggregate smoking patterns during the years of high risk exposure (say, aged<br />
15–20 years) may serve to ran<strong>do</strong>mize individual smoking behavior.<br />
In Figs. 1 and 2 we <strong>use</strong> CBS data to plot the real price of <strong>cigarette</strong>s (as measured by<br />
the average price per packet deflated by the consumer price index) in Israel, and aggregate<br />
<strong>cigarette</strong> consumption per capita. The data indicate that <strong>cigarette</strong>s were relatively expensive<br />
in the 1960s, while per capita <strong>cigarette</strong> consumption was lower. Subsequently, <strong>cigarette</strong>s<br />
became cheaper and per capita <strong>cigarette</strong> consumption increased. 5 A person born in the<br />
early 1950s would have experienced relatively high <strong>cigarette</strong> <strong>prices</strong> in his teens, and a more<br />
smoke-free environment. By contrast, a person born in the 1970s would have experienced<br />
relatively low <strong>cigarette</strong> <strong>prices</strong> in his teens, and a less smoke-free environment. Controlling<br />
for other factors, the former is less likely to smoke than the latter, if indeed herd effects and<br />
the price of <strong>cigarette</strong>s <strong>affect</strong>s smoking initiation.<br />
We <strong>use</strong> the data in Fig. 1 to calculate a weighted average of <strong>cigarette</strong> <strong>prices</strong> for each<br />
individual during his “impressionable” years. The weights are taken from the hazard function<br />
for smoking initiation (Fig. 3, taken from Beenstock and Rahav (2001)). This gives<br />
a higher weight in the ages 15–20 years, when the risk of smoking initiation is high, and<br />
smaller weights when the risk of smoking initiation is low. We apply a similar procedure<br />
to the data in Fig. 2. In this way, we calculate for each individual the personalized<br />
price of <strong>cigarette</strong>s and smoking environment. These variables are naturally ran<strong>do</strong>mized<br />
by birth year, <strong>cigarette</strong> <strong>prices</strong> and aggregate smoking behavior. This is similar to the<br />
approach taken by Douglas and Hariharan (1994) who <strong>use</strong>d a narrower win<strong>do</strong>w (15–18<br />
years) than ours. These variables are <strong>use</strong>d as instrumental variables beca<strong>use</strong> they are independent<br />
of observed heterogeneity that might influence the propensity to smoke and <strong>use</strong><br />
<strong>drug</strong>s.<br />
4. Results<br />
We report two types of gateway test using the metho<strong>do</strong>logy of natural experimentation.<br />
In the first, we estimate the recursive model as specified in Section 2.2 using a bivariate<br />
probit procedure (RBP), and a two-stage logit (2SL) procedure. The second type of test<br />
refers to the relationship between smoking initiation and cannabis initiation. We apply the<br />
5 Unfortunately, there are no systematic prevalence data. Since 1972, the Health Education Department at the<br />
Ministry of Health has occasionally commissioned surveys on smoking prevalence. These data have been analysed<br />
by Ben-Sira (e.g. Ben-Sira (1993)). They suggest that between 1972 and 1988 smoking prevalence was stable, but<br />
it fell during the 1990s.
688 M. Beenstock, G. Rahav / Journal of Health Economics 21 (2002) 679–698
M. Beenstock, G. Rahav / Journal of Health Economics 21 (2002) 679–698 689
690 M. Beenstock, G. Rahav / Journal of Health Economics 21 (2002) 679–698<br />
Fig. 3. Survival and hazard functions for age at <strong>cigarette</strong> initiation.<br />
metho<strong>do</strong>logy described in Section 2.3 and estimate a CPHM for the former in which the<br />
personalized relative price of <strong>cigarette</strong>s is hypothesized to influence the hazard of smoking. 6<br />
4.1. Test 1: sequencing<br />
We begin by reporting results for the 2SL procedure, which we compare with results<br />
obtained using the RBP procedure. Table 2 records our chosen logit model for the <strong>use</strong> of<br />
<strong>cigarette</strong>s. All the variables are statistically significant. The “personalized” relative price of<br />
<strong>cigarette</strong>s reduces the probability of smoking (odds ratio = 0.991). Among the demographic<br />
controls we mention that women are less likely to smoke, as are more religious people.<br />
People born in Israel are less likely to smoke, as are people whose fathers were born in<br />
6 Douglas and Hariharan (1994) estimated a split sample hazard model for smoking. In Beenstock and<br />
Rahav (2001), we estimate split sample hazard models for cannabis and hard <strong>drug</strong>s both parametrically and<br />
semi-parametrically. In the present context, split sample estimation is not numerically feasible beca<strong>use</strong> of the need<br />
for bootstrapping. CPHM nevertheless <strong>do</strong>es not require the population survival rate to tend to 0 and in this sense<br />
it mimics split sample models.
M. Beenstock, G. Rahav / Journal of Health Economics 21 (2002) 679–698 691<br />
Table 2<br />
Logit model for <strong>cigarette</strong> smoking<br />
Variable Coefficient S.E.<br />
Intercept 1.2715 0.1254<br />
Female −0.6689 0.0390<br />
Age 0.0623 0.0072<br />
Israel −0.2634 0.0601<br />
Middle East −0.1677 0.0514<br />
Balkan −0.1926 0.0636<br />
Asia −0.4209 0.1747<br />
Eastern Europe −0.3033 0.0690<br />
Education 4 0.2823 0.0521<br />
Religious (high) −0.8841 0.0528<br />
Religious (middle) −0.2316 0.0453<br />
Survey 1989 0.4450 0.0614<br />
Cigarette Price −0.0094 0.0013<br />
N = 12,455; −2log L = 16,171; P-value for χ 2 = 0.0001.<br />
Asia. Cohort effects are picked up by two variables, age and survey 1989, both of which<br />
imply that earlier cohorts are more likely to smoke.<br />
We <strong>use</strong> this model to calculate the predicted probability of smoking (PPS, denoted in the<br />
last row of Table 3). Table 3 records our chosen model for subsequent cannabis <strong>use</strong>. The PPS<br />
has a large and highly significant positive effect on the probability of subsequent cannabis<br />
<strong>use</strong>. Had we <strong>use</strong>d the dummy variable for prior smoking (C in Eq. (1) and the dependent<br />
variable in Table 2) instead of its instrumented value, it could have been argued that the<br />
observed gateway effect from smoking to cannabis is the result of spurious correlation<br />
induced by unobserved heterogeneity. In fact, it turns out that the dummy variable for<br />
smoking is yet more significant, however, this significance is exaggerated by unobserved<br />
heterogeneity. Since PPS is purged of unobserved heterogeneity, the conclusion from Table 3<br />
must be in favor of a causal gateway effect from <strong>cigarette</strong>s to cannabis.<br />
Two types of parameter standard errors are reported in Table 3, the original standard<br />
errors, and their bootstrapped counterparts. The standard errors have been bootstrapped for<br />
Table 3<br />
Logit model for subsequent cannabis <strong>use</strong><br />
Variable Coefficient S.E. Bootstrap S.E.<br />
Intercept −6.0553 0.3838<br />
Female 0.2294 0.1067 0.1146<br />
Age −0.0207 0.0059 0.0061<br />
Israel 0.5566 0.0898 0.1055<br />
Education 4 −0.7391 0.1105 0.1144<br />
Education 5–7 −0.7072 0.0823 0.0756<br />
Religious 3 −0.4492 0.0818 0.0910<br />
Pub frequency 0.2701 0.0287 0.0271<br />
Cigarette probability (PPS) 6.4529 0.4347 0.5417<br />
N = 12,382; −2log L = 5782; P-value for χ 2 = 0.0001.
692 M. Beenstock, G. Rahav / Journal of Health Economics 21 (2002) 679–698<br />
Table 4<br />
Comparison between 2SP and 2SBP<br />
Variable 2SP 2SBP<br />
Cigarette <strong>prices</strong> −0.00553 (7.119) −0.00538 (7.133)<br />
ρ 0 0.57 (27.1)<br />
PPS 3.228 (13.058) 3.402 (14.300)<br />
The t-values are shown in parentheses.<br />
two reasons. First, beca<strong>use</strong> PPS is an estimate of its true value. Secondly, beca<strong>use</strong> in any<br />
case IV estimation requires correction of the standard errors in the second stage. We <strong>use</strong> 200<br />
i.i.d. resamplings to calculate the standard errors. Andrews and Buchinsky (1999) discuss<br />
the number of resamplings required to attain a prescribed degree of accuracy for different<br />
P-values. It turns out that the original (unbootstrapped) standard errors provide a reliable<br />
guide to statistical significance. Also, the original parameter estimates reported in Table 3<br />
turn out to be close to the means of their bootstrapped counterparts, suggesting that the<br />
crude estimates are unbiased.<br />
It is noteworthy that if the relative price of <strong>cigarette</strong>s is omitted from Table 2, PPS ceases<br />
to be statistically significant in Table 3. This suggests that there is identifying information<br />
in <strong>cigarette</strong> <strong>prices</strong>, and that the significance of PPS in Table 3 is not simply the result of<br />
parametric identification.<br />
We experimented with other instruments, including herd effects and exposure to <strong>cigarette</strong><br />
regulations. In the former case we <strong>use</strong>d “personalized” <strong>cigarette</strong> consumption per capita<br />
(based in Fig. 2) as an additional covariate in Table 2, but it was not statistically significant. 7<br />
In the latter case, we defined exposure to be the number of adult years lived prior to the<br />
introduction of mandatory health warnings on <strong>cigarette</strong> packets. We expected that more<br />
exposed individuals are more likely to smoke, holding other variables constant. However,<br />
this did not turn out to be the case. This was true when we <strong>use</strong>d a variety of health warning<br />
trigger dates (1983 Israel, 1971 UK, 1965 US) both individually and collectively. If anything,<br />
we found that more exposed individuals, as defined, were less likely to smoke. However, this<br />
may be the manifestation of some complex cohort effect; early birth cohorts are less likely<br />
to smoke. In summary, the main instrument for smoking turned out to be the personalized<br />
relative price of <strong>cigarette</strong>s.<br />
Other results in Table 3 include a negative cohort effect; older birth cohorts are less likely<br />
to <strong>use</strong> cannabis, Sabras (native Israelis) are more likely to <strong>use</strong> cannabis, the uneducated and<br />
the highly educated are more likely to <strong>use</strong> cannabis. When controlling for other factors,<br />
women and secular Jews are more likely to <strong>use</strong> cannabis.<br />
As noted in Section 2.2, 2SL is consistent but not efficient, beca<strong>use</strong> it restricts ρ = 0.<br />
Inefficiency may induce bias in non-linear estimators. To investigate this we re-estimated the<br />
model using two-stage probit (2SP), solved for PPS, and then iterated PPS using two-stage<br />
bivariate probit (2SBP). Coefficient estimates for the main variables of interest are shown<br />
in Table 4.<br />
7 It is possible that prevalence data would have produced different results. See Footnote 5.
M. Beenstock, G. Rahav / Journal of Health Economics 21 (2002) 679–698 693<br />
Table 5<br />
Logit model for subsequent hard <strong>drug</strong> <strong>use</strong><br />
Variable Coefficient S.E. Bootstrap S.E.<br />
Intercept −5.0 2.3445<br />
Female −1.0621 0.2611 0.2880<br />
Age 0.0089 0.0151 0.0140<br />
Israel −0.5690 0.2743 0.3345<br />
Middle East −1.1456 0.3123 0.3187<br />
Balkan −1.1456 0.3544 0.4364<br />
Eastern Europe −1.2418 0.3759 0.4513<br />
Education 4 −0.6849 0.2919 0.2909<br />
Education 5–7 −1.1975 0.2969 0.3440<br />
Religious (high) −1.1149 0.4127 0.4388<br />
Religious (middle) −0.7614 0.2968 0.3644<br />
Survey 1989 −0.5022 0.2382 0.2673<br />
Survey 1992 −0.6256 0.3070 0.2989<br />
Pub frequency 0.3001 0.1106 0.1514<br />
PPH 1.0967 2.6563 2.7315<br />
N = 12,382; −2log L = 1261; P-value for χ 2 = 0.0001.<br />
Table 4 shows that the enhanced efficiency of 2SBP makes little difference to the parameter<br />
estimates. We also found that 2SP estimates are similar to the 2SL estimates reported<br />
in Tables 2 and 3. This suggests that while 2SL is not efficient, and may be biased in small<br />
samples, the loss of efficiency is likely to be minimal.<br />
We <strong>use</strong>d the specification in Tables 2 and 3 to estimate by RBP instead of 2SL. To save<br />
space we <strong>do</strong> not report the counterparts of Tables 2 and 3 that were obtained using RBP. On<br />
the whole the results were similar; the signs and significance of the coefficients were the<br />
same as in 2SL. The RBP estimate of β in Eq. (1) is 2.337 with t-value 36.57, which may<br />
be contrasted with its two-stage counterparts reported in the Table 4.<br />
In Table 5, we apply the method of “<strong>do</strong>mino” identification to the effect of cannabis on<br />
hard <strong>drug</strong>s. The parameter of interest is δ in Eq. (3). We present a 2SL model for subsequent<br />
hard <strong>drug</strong> <strong>use</strong> (i.e. after cannabis) in which PPH is the predicted probability of cannabis<br />
<strong>use</strong> that is derived from Table 3. It is positive but not statistically significant, implying<br />
that there is not a causal gateway effect from cannabis to hard <strong>drug</strong> <strong>use</strong>. However, it turns<br />
out that this result depends upon the specification of the model in Table 3. If, e.g. fathers’<br />
country of birth is included as a regressor, then PPH becomes marginally significant. In<br />
summary: becoming a <strong>cigarette</strong> smoker increases the probability of becoming a <strong>use</strong>r of<br />
cannabis, which increases the probability of becoming a <strong>use</strong>r of hard <strong>drug</strong>s. The former link<br />
in the gateway chain is highly statistically significant, whereas the latter link is less statistically<br />
robust. Since the asymptotic standard errors of the parameter estimates vary directly<br />
with the rarity of the event, the standard errors in the model for hard <strong>drug</strong>s will naturally<br />
tend to be larger than their counterparts in the model for cannabis. It is possible therefore<br />
that 12,500 observations may be insufficient to estimate with sufficient accuracy the parameters<br />
in Table 5. Also, “<strong>do</strong>mino” identification naturally weakens the power of the test<br />
beca<strong>use</strong> of its indirectness. It places perhaps too great a burden of identification on <strong>cigarette</strong>s<br />
<strong>prices</strong>.
694 M. Beenstock, G. Rahav / Journal of Health Economics 21 (2002) 679–698<br />
So much for the two-stage investigation of the causal effect of cannabis <strong>use</strong> on hard<br />
<strong>drug</strong> <strong>use</strong>. We now <strong>use</strong> RBP to investigate the same issue. Strictly speaking, RBP is not<br />
appropriate beca<strong>use</strong> we have added a third link to the gateway chain. A recursive trivariate<br />
probit (RTP) estimator is required. Since RTP is non-standard we have carried out the<br />
following approximation.<br />
(a) We <strong>use</strong> RBP to model the link between <strong>cigarette</strong>s and cannabis.<br />
(b) We <strong>use</strong> the results to obtain PPS, the predicted probability for smoking.<br />
(c) We <strong>use</strong> RBP to model the link between cannabis and hard <strong>drug</strong>s, where PPS is <strong>use</strong>d in<br />
the probit model for cannabis.<br />
This procedure estimates RTP in two stages. When we <strong>use</strong> the variables specified in<br />
Tables 2, 3 and 5 we obtain that the estimate of δ is 0.178 (t = 0.708), implying that the<br />
causal effect from cannabis to hard <strong>drug</strong>s is positive, but not statistically significant. The<br />
associated estimate of ρ is 0.835 (S.E. = 0.135). This result confirms the one obtained by<br />
2SL as reported in Table 5. The estimate of ρ strongly suggests that the gateway effect from<br />
cannabis to hard <strong>drug</strong>s is the result of correlation between the unobserved heterogeneity; it<br />
is not causal.<br />
However, δ became statistically significant when certain variables were dropped from the<br />
model for hard <strong>drug</strong>s. When we dropped “pub frequency” and “education 4”, we obtained<br />
an estimate of δ = 2.61 (t = 5.53) and ρ =−0.22 (S.E. = 0.213). While these restrictions<br />
fail a likelihood ratio test, they undermine the degree to which we can confidently reject the<br />
hypothesis that there is no causal gateway effect from cannabis to hard <strong>drug</strong>s.<br />
4.2. Test 2: initiation hazard<br />
In Table 6 we present a CPHM for smoking initiation in which the “personalized” price of<br />
<strong>cigarette</strong>s is clearly significant, implying that the age of <strong>cigarette</strong> initiation varies directly<br />
with the price of <strong>cigarette</strong>s, after controlling for demographic variables. The model also<br />
implies that women start smoking later, as <strong>do</strong> religious people and Israeli born.<br />
Table 6<br />
CPHM for smoking initiation<br />
Variable Coefficient S.E.<br />
Female −0.496400 0.02364<br />
Israel 0.135970 0.03793<br />
Middle East 0.111880 0.03215<br />
Balkan −0.075090 0.03909<br />
Asia −0.268128 0.11848<br />
Eastern Europe −0.152799 0.04350<br />
Education 4 0.216162 0.03074<br />
Religious (high) −0.547501 0.03484<br />
Religious (middle) −0.148835 0.02748<br />
Survey 1989 0.106948 0.02992<br />
Cigarette price −0.001895 0.000313<br />
N = 12,455; −2log L = 13,1067; P-value for χ 2 = 0.0001.
M. Beenstock, G. Rahav / Journal of Health Economics 21 (2002) 679–698 695<br />
Table 7<br />
CPHM for cannabis initiation<br />
Variable Coefficient S.E. Bootstrap S.E.<br />
Female 0.4211 0.1192 0.1351<br />
Israel 0.4527 0.0839 0.0946<br />
Balkan −0.2003 0.0947 0.0980<br />
Education 4 −0.7770 0.1083 0.1094<br />
Education 5–7 −0.6260 0.0752 0.0681<br />
Religious (middle) −0.3830 0.0787 0.0843<br />
Pub frequency 0.2682 0.0255 0.0247<br />
PRSS 2.2195 0.1953 0.2137<br />
N = 12,382; −2log L = 15,874; P-value for χ 2 = 0.0001.<br />
In Table 7 we present a CPHM for cannabis initiation in which PRSS = Xβ is specified<br />
as a covariate. Similar results are obtained if Xβ is transformed non-linearly as in the earlier<br />
equation. We carried out 200 i.i.d. resamplings for bootstrapping. PRSS is statistically significant,<br />
implying that <strong>cigarette</strong> initiation has a causal gateway effect on cannabis initiation.<br />
The longer one is predicted to survive without smoking, the longer one survives without<br />
using cannabis. Table 8 further implies that women initiate cannabis later, as <strong>do</strong> religious<br />
people and the children of Balkan fathers. Israeli born initiate earlier despite the fact that<br />
they start smoking later.<br />
Next, we calculate the predicted relative survival for cannabis (PRSC) from Table 7 for<br />
each individual, and we apply the method of “<strong>do</strong>mino” identification to determine whether<br />
age at cannabis initiation has a causal effect upon age at hard <strong>drug</strong> initiation. We specify<br />
PRSC in Table 8 as the indirectly instrumented value of the cannabis initiation hazard.<br />
The non-instrumented alternative would have been to specify the age of cannabis initiation.<br />
However, this would have embodied unobserved heterogeneity, which might have induced a<br />
Table 8<br />
CPHM for hard <strong>drug</strong> initiation<br />
Variable Coefficient S.E. Bootstrap S.E.<br />
Female −0.7609 0.4573 0.4043<br />
Israel −0.6227 0.2894 0.2671<br />
Middle East −1.0511 0.3378 0.3362<br />
Balkan −0.9891 0.4203 0.4572<br />
Eastern Europe −1.0666 0.4070 0.4423<br />
Education 4 −0.4802 0.3201 0.3307<br />
Education 5–7 −0.8362 0.4115 0.3956<br />
Religious (high) −0.6042 0.8012 0.7854<br />
Religious (middle) −0.4497 0.4946 0.4995<br />
Survey 1989 −0.5681 0.2314 0.2041<br />
Survey 1992 −0.5729 0.3025 0.3431<br />
Pub frequency 0.1999 0.1961 0.1984<br />
PRSC 0.3173 0.6052 0.5558<br />
N = 12,382; −2log L = 2128; P-value for χ 2 = 0.0001.
696 M. Beenstock, G. Rahav / Journal of Health Economics 21 (2002) 679–698<br />
spurious gateway effect. The bootstrapped standard errors are based upon 200 resamplings.<br />
Table 8 indicates that PRSC is positive but not statistically significant, implying that there<br />
is not a causal gateway effect from cannabis to hard <strong>drug</strong>s.<br />
When the age of cannabis initiation is specified instead of PRSC in Table 8, its coefficient<br />
turned out to be negative and highly statistically significant, implying that age at hard <strong>drug</strong><br />
initiation varies directly with age at cannabis initiation. This result suggests a gateway<br />
effect from cannabis initiation to hard <strong>drug</strong> initiation. However, the test in Table 8 shows<br />
that this effect is not causal since it results from unobserved heterogeneity. People who are<br />
susceptible to <strong>drug</strong>s happen to initiate cannabis sooner, and initiate hard <strong>drug</strong>s sooner. Thus,<br />
the gateway effect is spurious.<br />
In summary, beginning to smoke at an earlier age induces earlier <strong>use</strong> of cannabis, which<br />
induces earlier <strong>use</strong> of hard <strong>drug</strong>s. The former link in the gateway chain is highly statistically<br />
significant, whereas the latter link is not robust. In these respects, the results from experiment<br />
2 complement those obtained from experiment 1.<br />
5. Conclusion<br />
Controlling for cohort and other effects, people who grew up when <strong>cigarette</strong>s were relatively<br />
cheap were more likely to smoke, and to start smoking younger. As a causal consequence<br />
they were more likely to <strong>use</strong> cannabis afterwards and to initiate cannabis sooner. Our<br />
findings from natural experimentation indicate for the first time a causal gateway effect from<br />
<strong>cigarette</strong>s to cannabis, both for sequencing and for timing. On the other hand, we <strong>do</strong> not find<br />
a causal gateway effect from cannabis to hard <strong>drug</strong>s, both for sequencing and for timing.<br />
The latter result has to be qualified by two considerations. Beca<strong>use</strong> hard <strong>drug</strong> <strong>use</strong> is rare,<br />
hypothesis testing is more difficult. Secondly, the identification of the causal gateway effect<br />
from cannabis to hard <strong>drug</strong>s was indirect.<br />
These findings imply that higher <strong>cigarette</strong> taxes will not only reduce <strong>cigarette</strong> smoking,<br />
they will also reduce cannabis consumption. However, they will not reduce the consumption<br />
of hard <strong>drug</strong>s. They further imply that if cannabis is decriminalized, and the consumption of<br />
cannabis increases (Model, 1991), it will not effect the consumption of hard <strong>drug</strong>s. Hence,<br />
if policy makers are reluctant to decriminalize cannabis for gateway reasons our results <strong>do</strong><br />
not support this position. It should be recalled, however, that just as the anti-<strong>drug</strong> legislation<br />
in the early part of the 20th century was politically inspired (Musto, 1973), so scientific<br />
reasoning in the 21st century may not sway the issue.<br />
We admit that our approach has been somewhat ad hoc. This stems from the fact that the<br />
rational addiction model refers to single substances rather than multiple substances. There<br />
is a need to extend the rational addiction model to multiple substances in order to shed<br />
theoretical light upon the gateway phenomenon. Why <strong>do</strong> some people advance to cannabis<br />
from <strong>cigarette</strong>s, or from cannabis to hard <strong>drug</strong>s, while others <strong>do</strong> not? Such a model might<br />
suggest how the <strong>prices</strong> of <strong>cigarette</strong>s, cannabis and hard <strong>drug</strong>s <strong>affect</strong> the consumption of these<br />
substances at different stages in the life cycle. In the absence of price data for <strong>illicit</strong> <strong>drug</strong>s<br />
in Israel, we have been forced to place all the burden of identification upon <strong>cigarette</strong> <strong>prices</strong>.<br />
The availability of <strong>illicit</strong> <strong>drug</strong> price data in the US makes the extension of our approach<br />
there of particular interest.
Acknowledgements<br />
M. Beenstock, G. Rahav / Journal of Health Economics 21 (2002) 679–698 697<br />
We wish to thank Irena Vovk for her excellent research assistance; the Israel Science<br />
Foundation and the Eshkol Institute for financial support; the Israel Anti-Drug Authority<br />
for providing the data; Michael Hvoshnyansky who helped us prepare the final version of<br />
the paper; and three referees whose remarks considerably improved the paper.<br />
References<br />
Andrews, D.W.K., Buchinsky, M., 1999. A three-step method for choosing the number of bootstrap repetitions.<br />
Econometrica 68, 23–51.<br />
Barnea, Z., Teichman, M., Rahav, G., Gil, R., Rozenbloom, Y., 1990., The Use of Drugs and Alcohol Among the<br />
Population of Israel: An Epidemiologic Study. The Anti-Drugs Authority, Jerusalem.<br />
Baumrind, D., 1983. Specious causal attributions in the social sciences: the reformulated stepping stone theory of<br />
heroin <strong>use</strong> as an exemplar. Journal of Personality and Social Psychology 45, 1289–1298.<br />
Becker, G.S., Murphy, K.M., 1988. A theory of rational addiction. Journal of Political Economy 75, 700–765.<br />
Beenstock, M., Rahav, G., 2000. Maturing Out as a Life-Cycle or Duration Dependent Phenomenon in the Natural<br />
History of Drug Use in Israel, mimeo.<br />
Beenstock, M., Rahav, G., 2001. Immunity and Susceptibility in Illicit Drug Initiation in Israel.<br />
Ben-Sira, Z., 1993. Smoking: A Follow-up on Behavior Patterns and Change. The Louis Guttman Israel Institute<br />
of Applied Social Research, Jerusalem (in Hebrew).<br />
Chaloupka, F.J., 1991. Rational addictive behavior and <strong>cigarette</strong> smoking. Journal of Political Economy 99, 722–<br />
742.<br />
Douglas, S., Hariharan, G., 1994. The hazard of starting smoking: estimates from a split population duration<br />
model. Journal of Health Economics 13, 213–230.<br />
Evans, W.N., Ringel, J.S., 1999. Can higher <strong>cigarette</strong> taxes improve birth outcomes? Journal of Public Economics<br />
18, 135–154.<br />
Frey, B.S., 1997. Drugs and Economic Policy, Economic Policy.<br />
Greene, W.H., 2000., Econometric Analysis, 4th Edition. Prentice-Hall, Englewood Cliffs, NJ.<br />
Grossman, M., Chaloupka, F.J., 1999. The demand for cocaine by young adults: a rational addiction approach.<br />
Journal of Health Economics 18, 427–474.<br />
Hougaard, P., 1995. Frailty models for survival data. Lifetime Data Analysis 1, 255–274.<br />
Kandel, D.S., 1975. Stages in a<strong>do</strong>lescent involvement in <strong>drug</strong> <strong>use</strong>. Science 190, 912–924.<br />
Klein, J.P., Moeschberger, M.L., 1997. Survival Analysis. Springer, New York.<br />
Larson, M.G., Dinse, G.E., 1985. A mixture model for the regression analysis of competing risks data. Applied<br />
Statistics 34, 201–211.<br />
Maddala, G.S., 1983. Limited-Dependent and Qualitative Variables in Econometrics. Cambridge University Press,<br />
Cambridge.<br />
Miron, J.A., Zweibel, J., 1991. Alcohol consumption during prohibition. American Economic Review 81, 242–247.<br />
papers and proceedings..<br />
Miron, J.A., Zweibel, J., 1995. The economic case against <strong>drug</strong> prohibition. Journal of Economic Perspectives 9,<br />
175–192.<br />
Model, K., 1991. The effect of marijuana decriminalization on hospital emergency room <strong>drug</strong> episodes. Journal<br />
of the American Statistical Association 88, 737–747.<br />
Moore, M.H., 1973. Policies to achieve discrimination on the effective price of heroin. American Economic Review<br />
63, 270–277.<br />
Mullahy, J., Sindelar, J.L., 1993. Alcoholism, work and income. Journal of Labor Economics 11, 494–520.<br />
Musto, D.F., 1973. The American Disease: Origins of Narcotic Control. Yale University Press, New Haven.<br />
Nisbet, C.T., Vakil, F., 1972. Some estimates of price and expenditure elasticities of demand for marijuana among<br />
UCLA students. Review of Economics and Statistics 54, 473–475.<br />
O’Donnell, J.A., Clayton, R.R., 1982. The stepping stone hypothesis: marijuana, heroin and causality. Chemical<br />
Dependency 4, 229–241.
698 M. Beenstock, G. Rahav / Journal of Health Economics 21 (2002) 679–698<br />
Pacula, R.L., 1998. A<strong>do</strong>lescent Alcohol and Marijuana Consumption: Is there Really a <strong>Gateway</strong> Effect? NBER<br />
working paper 6348.<br />
Prinz, A., 1997. Do European <strong>drug</strong>s policies matter? Economic Policy.<br />
Rottenberg, S., 1968. The clandestine distribution of heroin, its discovery and suppression. Journal of Political<br />
Economy 75, 78–90.<br />
Tsibel, N., 2000. Event history analysis accounting for measurement errors and missing data, Ph.D. dissertation.<br />
The Hebrew University of Jerusalem.<br />
White, M.D., Lusketich, W.A., 1983. Heroin: price elasticity and enforcement strategies. Economic Inquiry 21,<br />
557–564.