The Democratic Domino Theory: An Empirical Investigation
The Democratic Domino Theory: An Empirical Investigation
The Democratic Domino Theory: An Empirical Investigation

Create successful ePaper yourself
Turn your PDF publications into a flip-book with our unique Google optimized e-Paper software.
DEMOCRATIC DOMINO THEORY 543<br />
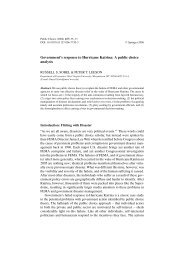
TABLE 4 <strong>The</strong> Spread of Democracy, 1991–2001<br />
SAR<br />
SEM<br />
1 2 3 4 1 2 3 4<br />
Rho 0.135 ∗∗∗ 0.097 ∗∗∗ 0.014 0.028 ∗∗∗<br />
(3.602) (7.864) (0.288) (4.329)<br />
Lambda 0.132 ∗∗∗ 0.169 ∗∗∗ −0.018 0.036 ∗∗∗<br />
(3.559) (4.636) (0.255) (5.051)<br />
Lagged Democracy −0.187 ∗∗∗ −0.153 ∗∗∗ −0.207 ∗∗∗ −0.152 ∗∗∗<br />
Level (11.927) (5.490) (12.139) (8.612)<br />
Constant 0.839 ∗∗∗ 1.186 ∗∗∗ −5.348 ∗∗∗ −6.058 ∗∗∗ 0.970 ∗∗∗ 1.320 ∗∗∗ −5.441 ∗∗∗ −6.243 ∗∗∗<br />
(6.413) (9.942) (7.047) (7.677) (6.713) (9.247) (5.482) (8.612)<br />
Log-likelihood −2232.099 −2166.390 −1477.112 −1458.236 −2232.099 −2160.803 −1477.065 −1458.096<br />
R-squared 0.023 0.145 0.940 0.943 0.022 0.163 0.940 0.943<br />
Observations 945 945 945 945 945 945 945 945<br />
Notes: Dependent variable: change in democracy (t-statistics in parentheses). Spatial weight matrix: first-order contiguity. ∗∗∗ = 1%,<br />
∗∗ = 5%, ∗ = 10%. Variable included but not reported: island dummy in columns 1 and 2. Columns 3 and 4 include year and country<br />
fixed effects.<br />
democratic dominoes fall has been overstated by those<br />
who have reasoned according to domino effect logic. Although<br />
his comments referred specifically to communist<br />
as opposed to democratic dominoes, President Eisenhower,<br />
for example, argued that dominoes “go over very<br />
quickly” and, when falling in an undesirable direction,<br />
create a “disintegration that would have the most profound<br />
influences.” 8 A spread rate of approximately 11%<br />
(and only about half this size or smaller if we use the<br />
estimates that include two-way fixed effects) is hardly<br />
one that could be described as leading political dominoes<br />
to “go over very quickly” and is not one capable<br />
of producing “the most profound influences.” Perhaps<br />
communist dominoes fall far “harder” than democratic<br />
ones. But democratic dominoes, at least, do not generate<br />
impressive spillover effects.<br />
To see this, consider a simple example, such as the<br />
United States, which has only two first-order contiguous<br />
geographic neighbors, Canada and Mexico. Between 1996<br />
and 2000 democracy in the United States and Canada did<br />
not measurably change and in Mexico increased from 4 to<br />
8, a positive four-unit democracy score change. <strong>The</strong> average<br />
change in democracy in North America was therefore<br />
1.33. Using the estimates from Tables 1–4 we can predict<br />
what the change in democracy would be in these countries<br />
and for North America as a whole if instead the United<br />
States became dramatically less democratic, falling to, say,<br />
the level of democracy in Iran over this four-year period,<br />
which was 3.<br />
8 Presidential News Conference, April 7, 1954.<br />
<strong>The</strong> equation for calculating the difference between<br />
Canada and Mexico’s current changes in democracy and<br />
their changes in democracy under this scenario is simply:<br />
∂F i = w i,j·∂F j . Using a democracy spread rate of<br />
0.11 from Tables 1–4, for Canada, this means its change in<br />
democracy would fall by: (0.11 × 1) × (3 − 10) =−0.77,<br />
making its new change in democracy: 0 − 0.77 =−0.77.<br />
For Mexico this operation is slightly more difficult because<br />
unlike Canada, which has only the United States as<br />
a neighbor, Mexico has three neighbors: the United States,<br />
Guatemala, and Belize. <strong>The</strong> presence of these additional<br />
neighbors softens the fall in Mexico’s democracy increase<br />
that would occur if American democracy fell to the level<br />
in Iran because having more neighbors dilutes the democracy<br />
contagion effect coming from any one neighbor. It is<br />
easy to see this when we calculate the change in Mexico’s<br />
democracy increase: (0.11 × (1/3)) × (3 − 10) =−0.257,<br />
which would make Mexico’s new change in democracy:<br />
4 − 0.257 = 3.74. If the United States had a decrease<br />
in democracy sufficient to make it as undemocratic as<br />
Iran, the average change in North American democracy<br />
would therefore be: (−7 − 0.77 + 3.47)/3 ≈−1.43. This<br />
amounts to a (1.33 −−1.43 = ) 2.76-unit overall reduction<br />
in North America’s average democracy score change<br />
over the period. To put the size of this effect in perspective,<br />
this democracy change decrease is slightly larger than the<br />
current difference in democracy between Mexico and the<br />
United States; slightly smaller than the current difference<br />
in democracy between Russia and the United States; and<br />
2.76 times larger than the current difference in democracy<br />
between France and the United States.