The Democratic Domino Theory: An Empirical Investigation
The Democratic Domino Theory: An Empirical Investigation
The Democratic Domino Theory: An Empirical Investigation

You also want an ePaper? Increase the reach of your titles
YUMPU automatically turns print PDFs into web optimized ePapers that Google loves.
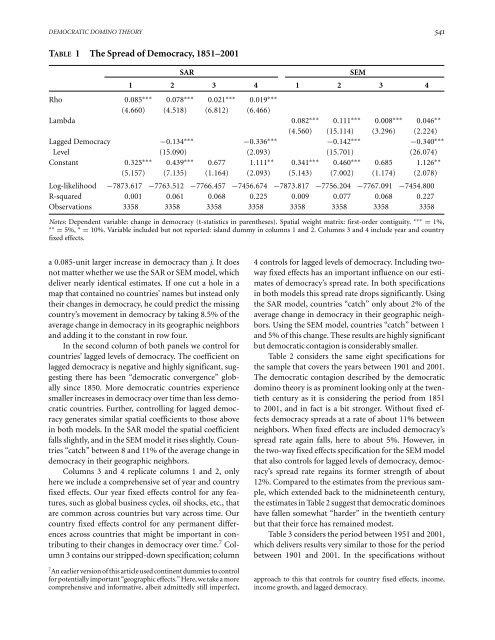
DEMOCRATIC DOMINO THEORY 541<br />
TABLE 1 <strong>The</strong> Spread of Democracy, 1851–2001<br />
SAR<br />
SEM<br />
1 2 3 4 1 2 3 4<br />
Rho 0.085 ∗∗∗ 0.078 ∗∗∗ 0.021 ∗∗∗ 0.019 ∗∗∗<br />
(4.660) (4.518) (6.812) (6.466)<br />
Lambda 0.082 ∗∗∗ 0.111 ∗∗∗ 0.008 ∗∗∗ 0.046 ∗∗<br />
(4.560) (15.114) (3.296) (2.224)<br />
Lagged Democracy −0.134 ∗∗∗ −0.336 ∗∗∗ −0.142 ∗∗∗ −0.340 ∗∗∗<br />
Level (15.090) (2.093) (15.701) (26.074)<br />
Constant 0.325 ∗∗∗ 0.439 ∗∗∗ 0.677 1.111 ∗∗ 0.341 ∗∗∗ 0.460 ∗∗∗ 0.685 1.126 ∗∗<br />
(5.157) (7.135) (1.164) (2.093) (5.143) (7.002) (1.174) (2.078)<br />
Log-likelihood −7873.617 −7763.512 −7766.457 −7456.674 −7873.817 −7756.204 −7767.091 −7454.800<br />
R-squared 0.001 0.061 0.068 0.225 0.009 0.077 0.068 0.227<br />
Observations 3358 3358 3358 3358 3358 3358 3358 3358<br />
Notes: Dependent variable: change in democracy (t-statistics in parentheses). Spatial weight matrix: first-order contiguity. ∗∗∗ = 1%,<br />
∗∗ = 5%, ∗ = 10%. Variable included but not reported: island dummy in columns 1 and 2. Columns 3 and 4 include year and country<br />
fixed effects.<br />
a 0.085-unit larger increase in democracy than j. Itdoes<br />
not matter whether we use the SAR or SEM model, which<br />
deliver nearly identical estimates. If one cut a hole in a<br />
map that contained no countries’ names but instead only<br />
their changes in democracy, he could predict the missing<br />
country’s movement in democracy by taking 8.5% of the<br />
average change in democracy in its geographic neighbors<br />
and adding it to the constant in row four.<br />
In the second column of both panels we control for<br />
countries’ lagged levels of democracy. <strong>The</strong> coefficient on<br />
lagged democracy is negative and highly significant, suggesting<br />
there has been “democratic convergence” globally<br />
since 1850. More democratic countries experience<br />
smaller increases in democracy over time than less democratic<br />
countries. Further, controlling for lagged democracy<br />
generates similar spatial coefficients to those above<br />
in both models. In the SAR model the spatial coefficient<br />
falls slightly, and in the SEM model it rises slightly. Countries<br />
“catch” between 8 and 11% of the average change in<br />
democracy in their geographic neighbors.<br />
Columns 3 and 4 replicate columns 1 and 2, only<br />
here we include a comprehensive set of year and country<br />
fixed effects. Our year fixed effects control for any features,<br />
such as global business cycles, oil shocks, etc., that<br />
are common across countries but vary across time. Our<br />
country fixed effects control for any permanent differences<br />
across countries that might be important in contributing<br />
to their changes in democracy over time. 7 Column<br />
3 contains our stripped-down specification; column<br />
7 <strong>An</strong> earlier version of this article used continent dummies to control<br />
for potentially important “geographic effects.” Here, we take a more<br />
comprehensive and informative, albeit admittedly still imperfect,<br />
4 controls for lagged levels of democracy. Including twoway<br />
fixed effects has an important influence on our estimates<br />
of democracy’s spread rate. In both specifications<br />
in both models this spread rate drops significantly. Using<br />
the SAR model, countries “catch” only about 2% of the<br />
average change in democracy in their geographic neighbors.<br />
Using the SEM model, countries “catch” between 1<br />
and 5% of this change. <strong>The</strong>se results are highly significant<br />
but democratic contagion is considerably smaller.<br />
Table 2 considers the same eight specifications for<br />
the sample that covers the years between 1901 and 2001.<br />
<strong>The</strong> democratic contagion described by the democratic<br />
domino theory is as prominent looking only at the twentieth<br />
century as it is considering the period from 1851<br />
to 2001, and in fact is a bit stronger. Without fixed effects<br />
democracy spreads at a rate of about 11% between<br />
neighbors. When fixed effects are included democracy’s<br />
spread rate again falls, here to about 5%. However, in<br />
the two-way fixed effects specification for the SEM model<br />
that also controls for lagged levels of democracy, democracy’s<br />
spread rate regains its former strength of about<br />
12%. Compared to the estimates from the previous sample,<br />
which extended back to the midnineteenth century,<br />
the estimates in Table 2 suggest that democratic dominoes<br />
have fallen somewhat “harder” in the twentieth century<br />
but that their force has remained modest.<br />
Table 3 considers the period between 1951 and 2001,<br />
which delivers results very similar to those for the period<br />
between 1901 and 2001. In the specifications without<br />
approach to this that controls for country fixed effects, income,<br />
income growth, and lagged democracy.