
Create successful ePaper yourself
Turn your PDF publications into a flip-book with our unique Google optimized e-Paper software.
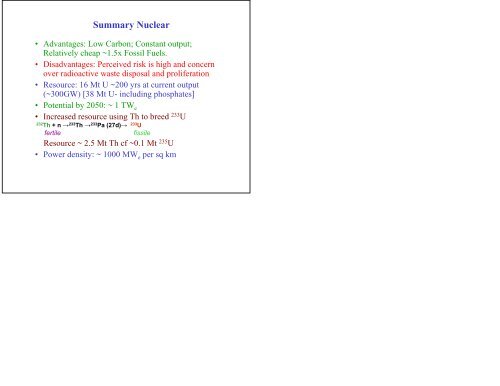
Summary Nuclear<br />
• Advantages: Low Carbon; Constant output;<br />
Relatively cheap ~1.5x Fossil Fuels.<br />
• Disadvantages: Perceived risk is high and concern<br />
over radioactive waste disposal and proliferation<br />
• Resource: 16 Mt U ~200 yrs at current output<br />
(~300GW) [38 Mt U- including phosphates]<br />
• Potential by 2050: ~ 1 TW e<br />
• Increased resource using Th to breed 233 U<br />
232<br />
Th + n → 233 Th → 233 Pa (27d)→ 233 U<br />
fertile<br />
fissile<br />
Resource ~ 2.5 Mt Th cf ~0.1 Mt 235 U<br />
• Power density: ~ 1000 MW e per sq km