Macroeconomic Factors and Equity Prices - Pakistan Institute of ...
Macroeconomic Factors and Equity Prices - Pakistan Institute of ...
Macroeconomic Factors and Equity Prices - Pakistan Institute of ...
Create successful ePaper yourself
Turn your PDF publications into a flip-book with our unique Google optimized e-Paper software.
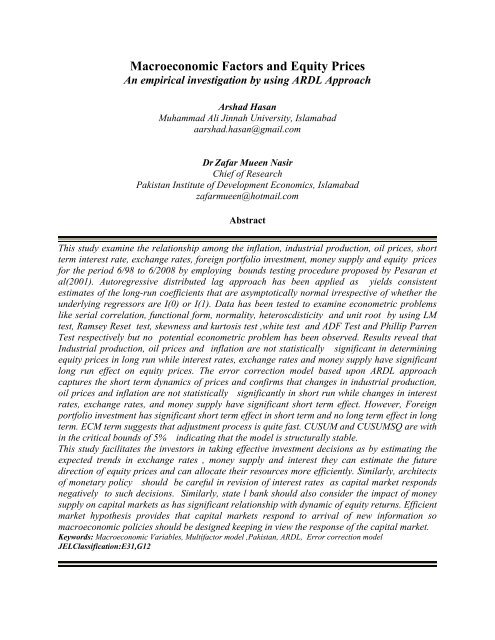
<strong>Macroeconomic</strong> <strong>Factors</strong> <strong>and</strong> <strong>Equity</strong> <strong>Prices</strong><br />
An empirical investigation by using ARDL Approach<br />
Arshad Hasan<br />
Muhammad Ali Jinnah University, Islamabad<br />
aarshad.hasan@gmail.com<br />
Dr Zafar Mueen Nasir<br />
Chief <strong>of</strong> Research<br />
<strong>Pakistan</strong> <strong>Institute</strong> <strong>of</strong> Development Economics, Islamabad<br />
zafarmueen@hotmail.com<br />
Abstract<br />
This study examine the relationship among the inflation, industrial production, oil prices, short<br />
term interest rate, exchange rates, foreign portfolio investment, money supply <strong>and</strong> equity prices<br />
for the period 6/98 to 6/2008 by employing bounds testing procedure proposed by Pesaran et<br />
al(2001). Autoregressive distributed lag approach has been applied as yields consistent<br />
estimates <strong>of</strong> the long-run coefficients that are asymptotically normal irrespective <strong>of</strong> whether the<br />
underlying regressors are I(0) or I(1). Data has been tested to examine econometric problems<br />
like serial correlation, functional form, normality, heteroscdisticity <strong>and</strong> unit root by using LM<br />
test, Ramsey Reset test, skewness <strong>and</strong> kurtosis test ,white test <strong>and</strong> ADF Test <strong>and</strong> Phillip Parren<br />
Test respectively but no potential econometric problem has been observed. Results reveal that<br />
Industrial production, oil prices <strong>and</strong> inflation are not statistically significant in determining<br />
equity prices in long run while interest rates, exchange rates <strong>and</strong> money supply have significant<br />
long run effect on equity prices. The error correction model based upon ARDL approach<br />
captures the short term dynamics <strong>of</strong> prices <strong>and</strong> confirms that changes in industrial production,<br />
oil prices <strong>and</strong> inflation are not statistically significantly in short run while changes in interest<br />
rates, exchange rates, <strong>and</strong> money supply have significant short term effect. However, Foreign<br />
portfolio investment has significant short term effect in short term <strong>and</strong> no long term effect in long<br />
term. ECM term suggests that adjustment process is quite fast. CUSUM <strong>and</strong> CUSUMSQ are with<br />
in the critical bounds <strong>of</strong> 5% indicating that the model is structurally stable.<br />
This study facilitates the investors in taking effective investment decisions as by estimating the<br />
expected trends in exchange rates , money supply <strong>and</strong> interest they can estimate the future<br />
direction <strong>of</strong> equity prices <strong>and</strong> can allocate their resources more efficiently. Similarly, architects<br />
<strong>of</strong> monetary policy should be careful in revision <strong>of</strong> interest rates as capital market responds<br />
negatively to such decisions. Similarly, state l bank should also consider the impact <strong>of</strong> money<br />
supply on capital markets as has significant relationship with dynamic <strong>of</strong> equity returns. Efficient<br />
market hypothesis provides that capital markets respond to arrival <strong>of</strong> new information so<br />
macroeconomic policies should be designed keeping in view the response <strong>of</strong> the capital market.<br />
Keywords: <strong>Macroeconomic</strong> Variables, Multifactor model ,<strong>Pakistan</strong>, ARDL, Error correction model<br />
JELClassification:E31,G12
1. Introduction<br />
The link among macroeconomic variables <strong>and</strong> the equity market has always attracted the<br />
curiosity <strong>of</strong> academicians <strong>and</strong> practitioners as it has an innate appeal. Debate on impact <strong>of</strong><br />
macroeconomic factor on equity prices has been at the centre <strong>of</strong> theoretical <strong>and</strong> empirical<br />
research since the seminal paper <strong>of</strong> Chen et al (1986). The relationship between the<br />
macroeconomic variables <strong>and</strong> the equity prices has been tested in many empirical studies.<br />
Literature reveals that asset pricing theories do not specify the underlying macroeconomic<br />
factors that influence equity prices. Such studies include Roll <strong>and</strong> Ross(1980), Fama(1981),<br />
Chen et al.1(986), Hamao(1986), Faff(1988), Chen(1991), Maysami <strong>and</strong> Koh(2000), <strong>and</strong> Paul<br />
<strong>and</strong> Mallik(2001). In most <strong>of</strong> the studies variable selection <strong>and</strong> empirical analyses is based on<br />
economic rationale, financial theory <strong>and</strong> investors’ intuition i.e Chen et al.(1986), Mukharjee <strong>and</strong><br />
Naka(1995). These studies generally apply Eagle <strong>and</strong> Granger (1987) procedure or Johanson <strong>and</strong><br />
Jusilieus (1990, 1991) approach in VAR Framework. In <strong>Pakistan</strong>, Fazal(2006) <strong>and</strong> Nishat(2001)<br />
also apply the same procedure to explore the relationship between macroeconomic factors <strong>and</strong><br />
equity prices by using Johanson <strong>and</strong> Jusilieus (1990,1991) procedure.<br />
The aim <strong>of</strong> this study is to test the relationship between the inflation, industrial production, oil<br />
prices, short term interest rate, exchange rates, foreign portfolio investment, money supply <strong>and</strong><br />
equity prices for the period 6/98 60 6/2008 by employing bounds testing procedure proposed by<br />
Pesaran, Shin <strong>and</strong> Smith (1996, 2001). This methodology is adopted as it has following<br />
additional benefits. First , determining the order <strong>of</strong> integration <strong>of</strong> macroeconomic factors <strong>and</strong><br />
equity market returns is not an issue .The Pesaran ARDL approach yields consistent estimates <strong>of</strong><br />
the long-run coefficients that are asymptotically normal irrespective <strong>of</strong> whether the underlying<br />
regressors are I(0) or I(1) <strong>and</strong> <strong>of</strong> the extent <strong>of</strong> cointegration. Secondly, some econometric<br />
procedures used to assess the impact <strong>of</strong> macroeconomic factors on equity prices is do not allow<br />
one to distinguish clearly between long run <strong>and</strong> short run relationships. However, the ARDL<br />
approach allows exploring correct dynamic structure.<br />
ARDL approach in an error-correction setting has been widely applied to examine the impact <strong>of</strong><br />
macroeconomic factors on economic growth but it is strongly underutilized in the capital market<br />
filament <strong>of</strong> literature. In <strong>Pakistan</strong> only Akmal (2007) investigate the relationship between stock<br />
returns <strong>and</strong> inflation for the <strong>Pakistan</strong>i equity market for the period 1971-2006 by employing<br />
autoregressive distribution lag approach Therefore, this study first time explores the relationship
among equity prices <strong>and</strong> a broader portfolio <strong>of</strong> macroeconomic variables by using a powerful<br />
ARDL Approach <strong>and</strong> <strong>of</strong>fers greater insight from a new dimension. The broad set <strong>of</strong><br />
macroeconomic variable include industrial production index , consumer price index, money<br />
supply , exchange rate, foreign portfolio investment, Treasury bill rates <strong>and</strong> oil prices. This set <strong>of</strong><br />
data has been used first time in <strong>Pakistan</strong>. Karachi stock exchange index has been used as proxy<br />
for equity market prices.<br />
The paper is organized in V Sections. Section II summarizes some recent literature on the<br />
subject. Section III explains data <strong>and</strong> mathematical model employed to capture the influence <strong>of</strong><br />
macroeconomic factors on equity prices. Section IV incorporates the findings <strong>of</strong> study <strong>and</strong><br />
discusses results <strong>of</strong> bounds testing procedure proposed by Pesaran. Section V concludes the<br />
study <strong>and</strong> discusses some implications for the current debate about the impacts <strong>of</strong><br />
macroeconomic factors on equity prices in general.<br />
2. Literature Review<br />
The relationship between equity market returns <strong>and</strong> economic fundamentals has been extensively<br />
researched in developed markets e.g. Chen et al. (1986), Fama(1990), Chen( 1991), Cheung<br />
<strong>and</strong> Ng (1998) , Choi et al.(1999), Dickinson (2000), Nasseh <strong>and</strong> Strauss(2000). However the<br />
literature with reference to transition economies is limited <strong>and</strong> that too is focused on Asia Pacific<br />
Rim countries. Only few studies are available with reference to <strong>Pakistan</strong> which is one <strong>of</strong> the<br />
major countries <strong>of</strong> south Asia <strong>and</strong> lies on cross roads <strong>of</strong> Central Asia, Middle East. Now take an<br />
overview <strong>of</strong> some significant recent empirical work in this area.<br />
Chen, Roll <strong>and</strong> Ross (1986) investigate the existence <strong>of</strong> long run relationship among equity<br />
prices <strong>and</strong> industrial production, inflation, risk premium, market return, oil prices, term structure<br />
<strong>and</strong> consumption for US <strong>and</strong> provides that industrial production, risk premium, yield curve, <strong>and</strong><br />
unanticipated inflation can explain expected returns during periods <strong>of</strong> high volatility. However,<br />
oil prices, market index, <strong>and</strong> consumption are not priced in the market. Chan, Chen <strong>and</strong> Hsieh<br />
(1985), Chen, Roll <strong>and</strong> Ross (1986), Burnmeister <strong>and</strong> Wall (1986), Beenstock <strong>and</strong> Chan (1988),<br />
Chang <strong>and</strong> Pinegar (1990), Kryzanowski <strong>and</strong> Zhang (1992), Chen <strong>and</strong> Jordan (1993), Sauer<br />
(1994), Rahman, Coggin <strong>and</strong> Lee (1998) also explore the relationship among industrial<br />
production <strong>and</strong> equity market returns <strong>and</strong> find mixed results.
Paul <strong>and</strong> Mallik (2001) explore the long run relationship among macroeconomic factors <strong>and</strong><br />
equity prices in Australian banking <strong>and</strong> finance sector by using quarterly data for the period<br />
1980 -98. Multivariate cointegration analysis is performed to investigate the causal <strong>and</strong> dynamic<br />
relationship among consumer price index , interest rates, <strong>and</strong> seasonally adjusted GDP <strong>and</strong> ASX<br />
Banking <strong>and</strong> Finance Index by using autoregressive distributed lag (ARDL) model proposed by<br />
Pesaran <strong>and</strong> Shin (1995)<strong>and</strong> reveal that interest rate has a significant negative effect on equity<br />
prices <strong>and</strong> GDP growth has a significant a positive effect on the equity prices <strong>of</strong> banking <strong>and</strong><br />
finance sector. However, no significant effect <strong>of</strong> inflation is observed on equity prices.<br />
Fazal <strong>and</strong> Mahmood (2001) explore causal relationship between equity prices <strong>and</strong> economic<br />
activity, investment spending, <strong>and</strong> consumption expenditure for the period 7/1959 to 6/99 by<br />
employing cointegration analysis <strong>and</strong> VECM <strong>and</strong> provide evidence about existence <strong>of</strong> long run<br />
relationship among above stated variables. Unidirectional causality has also been found flowing<br />
from macro variables to equity prices. However it is observed <strong>Pakistan</strong>i equity in unable to<br />
influence aggregate dem<strong>and</strong>. Fazal(2006) again examines relationship to investigate the<br />
stochastic properties <strong>of</strong> the variables by considering the shifts as a result <strong>of</strong> economic<br />
liberalization <strong>and</strong> finds unidirectional causality between the real sector <strong>and</strong> equity prices. No<br />
significant change in patterns is observed<br />
Maysami et al (2004) examines the long run relationship among macroeconomic variables <strong>and</strong><br />
STI <strong>and</strong> sectoral indices like the property index, finance index <strong>and</strong> the hotel index <strong>and</strong> finds STI<br />
<strong>and</strong> the property index have long term relationship with industrial production, inflation ,<br />
exchange rate , changes in the short <strong>and</strong> long-term interest rates <strong>and</strong> money supply.<br />
Theoretical <strong>and</strong> empirical research on relationship between inflation <strong>and</strong> equity prices shows<br />
mixed results. Literature supports the evidence that positive relationship between nominal stock<br />
returns <strong>and</strong> inflation over the long horizons. Kessal (1956) concludes that unexpected inflation<br />
increases the firm’s equity value if the firm is net debtor Some more studies that find positive<br />
relationship between inflation <strong>and</strong> equity prices include Firth(1979), Gultekin(1983),<br />
Boudhouch <strong>and</strong> Richarson(1993). More recently Ioannidis et al. (2004) finds evidence about<br />
existence <strong>of</strong> positive relation between inflation <strong>and</strong> equity market returns in Greece for the<br />
period 1985 -2003. Empirical Literature also <strong>of</strong>fers evidence about existence <strong>of</strong> negative<br />
relationship between nominal equity prices <strong>and</strong> inflation in long run. Fama (1981) finds that<br />
there is negative association between equity market returns <strong>and</strong> inflation. Spyrou (2001) finds
evidence about presence <strong>of</strong> negative correlation between equity market returns <strong>and</strong> the inflation<br />
in Greece for the period 1990 -1995. Similarly, some studies established mixed results about the<br />
relationship between stock market returns <strong>and</strong> inflation. Mark (2001) finds the mixed empirical<br />
evidence about relationship between equity market returns <strong>and</strong> inflation. Amidhud (1996) reports<br />
the presence <strong>of</strong> negative correlations between equity prices <strong>and</strong> inflation in short run which is<br />
followed by positive association in the long run. Akmal (2007) investigate the relationship<br />
between stock returns <strong>and</strong> inflation for the <strong>Pakistan</strong>i equity market for the period 1971-2006 by<br />
employing autoregressive distribution lag approach. Findings <strong>of</strong> study indicate that stocks are<br />
hedges against inflationary pressures (inflation) in long run <strong>and</strong> this relationship is statistically<br />
significant at α=0.10 Chan, Chen <strong>and</strong> Hsieh (1985), Chen, Roll <strong>and</strong> Ross (1986), Burnmeister<br />
<strong>and</strong> Wall (1986), Burmeister <strong>and</strong> MacElroy (1988), Chang <strong>and</strong> Pinegar (1990), Defina (1991)<br />
Kryzanowski <strong>and</strong> Zhang (1992), Chen <strong>and</strong> Jordan (1993), Sauer(1994), Rahman, Coggin <strong>and</strong><br />
Lee (1998) also explore the relationship among inflation <strong>and</strong> equity market returns. Similarly,<br />
Beenstock <strong>and</strong> Chan (1988), Sauer (1994) explore the relationship among money supply <strong>and</strong><br />
equity market returns.<br />
Shahid (2008) explores causal relationships among equity prices <strong>and</strong> industrial production,<br />
money supply , exports, exchange rate , foreign direct investment <strong>and</strong> interest rates for the<br />
period 3/95 to 3/2007 by employing cointegration analysis <strong>and</strong> Toda <strong>and</strong> Yamamoto Granger<br />
causality test on quarterly data. Short run relationships among variables have also been<br />
investigated by using Bivariate Vector Autoregressive Model for variance decomposition <strong>and</strong><br />
impulse response functions. The study concludes that equity prices in India lead economic<br />
activity in general. However, Interest rate is found to lead the equity prices.<br />
Therefore no significant study is present with reference to <strong>Pakistan</strong> that considers broader set <strong>of</strong><br />
variables <strong>and</strong> long term data. This study fills this gap <strong>and</strong> explores relationship between equity<br />
prices <strong>and</strong> macroeconomic factors.<br />
3. Data Description <strong>and</strong> Methodology<br />
This study explores the long term causal relationship among macro economic variables <strong>and</strong><br />
<strong>Pakistan</strong>i capital market for the period 6/1998 to 6/2008 by using monthly data. The<br />
macroeconomic variables include Industrial Production Index, Broad Money, Oil <strong>Prices</strong>, Foreign<br />
Exchange Rate, Inflation <strong>and</strong> Interest Rate. Monthly time series has been chosen as it is
consistent with earlier work done by Chan <strong>and</strong> Faff (1998) to explore the long run relation ship<br />
between macroeconomic variables <strong>and</strong> equity markets. Variables have been measured <strong>and</strong><br />
measured by using following proxies<br />
3.1 Data Description<br />
3.1.1 Dependent Variable<br />
<strong>Equity</strong> market returns has been calculated by using following equation<br />
R t = ln (I t / I t-1 )<br />
Where: R t is Return for month ‘t’;<strong>and</strong> I t <strong>and</strong> I t-1 are closing values <strong>of</strong> KSE- 100 Index for<br />
month ‘t’ <strong>and</strong> ‘t-1’ respectively.<br />
3.1.2 Independent Variables<br />
Industrial production Index<br />
Industrial production index has been used as proxy to measure the growth rate in real sector.<br />
Industrial production presents a measure <strong>of</strong> overall economic activity in the economy <strong>and</strong> affects<br />
stock prices through its influence on expected future cash flows It is hypothesized that an<br />
increase in industrial production is positively related to equity prices.<br />
Narrow Money (M1)<br />
Narrow Money (M 1 ) is used as a proxy <strong>of</strong> money supply. Increase in money supply leads to<br />
increase in liquidity that ultimately results in upward movement <strong>of</strong> nominal equity prices so it is<br />
hypothesized that an increase in money supply is positively related to equity market returns<br />
Consumer Price Index (CPI)<br />
Consumer Price Index is used as a proxy <strong>of</strong> inflation rate. CPI is chosen as it is a broad base<br />
measure to calculate average change in prices <strong>of</strong> goods <strong>and</strong> services during a specific period.<br />
Inflation is ultimately translated into nominal interest rate <strong>and</strong> an increase in nominal interest<br />
rates increase discount rate which results in reduction <strong>of</strong> present value <strong>of</strong> cash flows so it is<br />
hypothesized that an increase in inflation is negatively related to equity prices .
Oil <strong>Prices</strong><br />
Brent oil prices have been used as proxy for oil prices. Increase in oil prices increase the cost <strong>of</strong><br />
production <strong>and</strong> decrease the earning <strong>of</strong> the corporate sector due to decrease in pr<strong>of</strong>it margins or<br />
decrease in dem<strong>and</strong> <strong>of</strong> product so oil prices are negatively related to equity prices. However, for<br />
oil <strong>and</strong> gas sector increase in oil prices increase the corporate revenues <strong>and</strong> pr<strong>of</strong>its so oil prices<br />
are positively related to equity prices. It is hypothesized that an increase in oil rates is negatively<br />
related to equity market returns<br />
Foreign Exchange Rate<br />
This study employs foreign exchange rate as end <strong>of</strong> month US$/Rs exchange rate It is<br />
hypothesized that depreciation in home currency is negatively related to equity prices.<br />
T Bill Rate<br />
Treasury bill rates have been used as proxy <strong>of</strong> Interest rate. Increase in interest rates leads to<br />
increase in discount rate <strong>and</strong> it ultimately results in decrease in present value <strong>of</strong> future cash flows<br />
which represent fair intrinsic value <strong>of</strong> shares. Therefore, it is hypothesized that an increase in<br />
interest rate is negatively related to equity market returns<br />
Foreign Portfolio Investment<br />
Foreign portfolio Investment has been used as proxy <strong>of</strong> Investor confidence. Foreign portfolio<br />
investment increases liquidity in market <strong>and</strong> higher dem<strong>and</strong> leads to increase in market prices <strong>of</strong><br />
shares so it is hypothesized that an increase in foreign portfolio investment is positively related<br />
to equity market returns<br />
Methodology<br />
To examine the relationship among macroeconomic factors <strong>and</strong> equity market returns following<br />
model has been tested<br />
Ln I t = β0+ β 1 LnIPI t + β 2 lnOil t + β 3 lnXRate t + β 4 TBill t + β 4 CPI t + β 4 FPI t + β 4 M1 t µ t<br />
Where<br />
I= KSE -100 Index<br />
Oil = Oil prices in $
XRate= Foreign Exchange Rates $/ Rs.<br />
TBill = Six Month Treasury Bill Rate<br />
CPI = Consumer Price Index<br />
FPI= Foreign Portfolio Investment<br />
M1= Narrow Money<br />
There are several methods available to test for the existence <strong>of</strong> the long-run equilibrium<br />
relationship among time-series variables. The most widely used methods include Engle <strong>and</strong><br />
Granger (1987) test, fully modified OLS procedure <strong>of</strong> Phillips <strong>and</strong> Hansen’s (1990), maximum<br />
likelihood based Johansen (1988,1991) <strong>and</strong> Johansen-Juselius (1990) tests. These methods<br />
require that the variables in the system are integrated <strong>of</strong> order one I(1). In addition, these<br />
methods suffer from low power <strong>and</strong> do not have good small sample properties. Due to these<br />
problems, a newly developed autoregressive distributed lag (ARDL) approach to cointegration<br />
has become popular in recent years. This study employs autoregressive distributed lag approach<br />
(ARDL) to cointegration following the methodology proposed by Pesaran <strong>and</strong> Shin (1999). This<br />
methodology is chosen as it has certain advantages on other cointegration procedures. For<br />
example, it can be applied regardless <strong>of</strong> the stationary properties <strong>of</strong> the variables in the sample.<br />
Secondly, it allows for inferences on long-run estimates which are not possible under alternative<br />
cointegration procedures. Finally, ARDL Model can accommodate greater number <strong>of</strong> variables<br />
in comparison to other Vector Autoregressive (VAR) models.<br />
First <strong>of</strong> all data has been tested for unit root. This testing is necessary to avoid the possibility <strong>of</strong><br />
spurious regression as Ouattara (2004) reports that bounds test is based on the assumption that<br />
the variables are I(0) or I(1) so in the presence <strong>of</strong> I(2) variables the computed F-statistics<br />
provided by Pesaran et al. (2001) becomes invalid. Similarly other diagonistic tests are applied to<br />
detect serial correlation, heterosidisticity , conflict to normality.<br />
If data is found I(0) or I(1) the the ARDL approach to cointegration is applied which consists <strong>of</strong><br />
three stages. In the first step the existence <strong>of</strong> a long-run relationship between the variables is<br />
established by testing for the significance <strong>of</strong> lagged variables in an error correction mechanism<br />
regression. Then the first lag <strong>of</strong> the levels <strong>of</strong> each variable are added to the equation to create the<br />
error correction mechanism equation <strong>and</strong> a variable addition test is performed by computing an<br />
F-test on the significance <strong>of</strong> all the lagged variables
The second stage is to estimate the ARDL form <strong>of</strong> equation where the optimal lag length is<br />
chosen according to one <strong>of</strong> the st<strong>and</strong>ard criteria such as the Akaike Information or Schwartz<br />
Bayesian. Then the restricted version <strong>of</strong> the equation is solved for the long-run solution. An<br />
ARDL representation <strong>of</strong> above equation is as below:<br />
Ln I t = β 0 + Σ ψ i Ln I t-1 + Σ β i Ln IPI t -i + Σ λ i lnOil t-i + Σ δ i LnXRate t-i + Σ φ i LnTBill t-i + Σ<br />
η i LnCPI t-i + Σ γ i LnFPI t-i+ Σ ζ i LnMI+ µ t<br />
Where i ranges from 1 to p<br />
The third stage entails the estimation <strong>of</strong> the error correction equation using the<br />
differences <strong>of</strong> the variables <strong>and</strong> the lagged long-run solution, <strong>and</strong> determines the speed <strong>of</strong><br />
adjustment <strong>of</strong> returns to equilibrium. A general error correction representation <strong>of</strong> equation is<br />
given below:<br />
∆ Ln I t = β 0 + Σ β i ∆ Ln IPI t -i + Σ λ i ∆ Ln Oil t-i + Σ δ i ∆ LnXRate t-i + Σ φ i ∆ LnTBill t-i + Σ η i<br />
∆CPI t-i + Σ γ i ∆FPI t-i + Σ ζ i ∆M1 t-i +ECM +µ t<br />
Interest rates , inflation , <strong>and</strong> oil prices are expected to have negative impact on returns so the<br />
coefficients λ, φ <strong>and</strong> η are expected to be negative λ < 0 , φ < 0 <strong>and</strong> η < 0.<br />
As industrial production , Foreign portfolio investment , <strong>and</strong> Money supply are expected to have<br />
a positive effect on equity returns so the coefficients β, γ <strong>and</strong> ζ are expected to be positive, i.e. β<br />
> 0, γ > 0, ζ > 0 .<br />
Finally, stability <strong>of</strong> short-run <strong>and</strong> long-run coefficients is examined by employing cumulative<br />
sum (CUSUM) <strong>and</strong> cumulative sum <strong>of</strong> squares (CUSUMSQ) tests. The CUSUM <strong>and</strong><br />
CUSUMSQ statistics are updated recursively <strong>and</strong> plotted against the break points. If the plots <strong>of</strong><br />
CUSUM <strong>and</strong> CUSUMSQ statistics stay with in the critical bonds <strong>of</strong> 5% level <strong>of</strong> significance, the<br />
null hypothesis <strong>of</strong> all coefficients in the given regression are stable can not be rejected.<br />
4. Empirical Results<br />
Table 1 reports the results <strong>of</strong> unit root test applied to determine the order <strong>of</strong> integration among<br />
time series data. ADF Test <strong>and</strong> Phillips-Perron Test have been used at level <strong>and</strong> first difference<br />
under assumption <strong>of</strong> constant <strong>and</strong> trend.
Table 1<br />
Unit Root Analysis<br />
ADF- Level ADF- Ist Diff PP- Level PP- Ist Diff<br />
Ln Kse100 -2.1686 -12.015 -2.0872 -12.2821<br />
Ln IPI -3.1322 -8.9420 -2.8182 -8.7609<br />
Ln Oil -2.3550 -8.3208 -2.0543 -8.2033<br />
Ln X Rate -2.3659 -6.6074 -3.1003 -6.4168<br />
Ln T Bill -1.6981 -3.6063 -1.3595 -7.8162<br />
Ln CPI 2.9023 -8.6160 2.6215 -8.6190<br />
Ln FPI 0.4762 -3.6651 -0.4640 -10.8700<br />
Ln M1 -1.8832 -10.245 -1.9545 -10.2284<br />
1% Critic. Value -4.0363 -4.0370 -4.0363 -4.0370<br />
5% Critic. Value -3.4477 -3.4480 -3.4477 -3.4480<br />
10%Critic Value -3.1489 -3.1491 -3.1489 -3.1491<br />
Results clearly indicate that the index series are not stationary at level but the first differences <strong>of</strong><br />
the logarithmic transformations <strong>of</strong> the series are stationary. Therefore, it can be safely said that<br />
series are integrated <strong>of</strong> order one I (1).It is worth mentioning that results are robust under<br />
assumption <strong>of</strong> constant trend as well as no trend. This testing is necessary to avoid the<br />
possibility <strong>of</strong> spurious regression as Ouattara (2004) reports that bounds test is based on the<br />
assumption that the variables are I(0) or I(1) so in the presence <strong>of</strong> I(2) variables the computed F-<br />
statistics provided by Pesaran et al. (2001) becomes invalid..<br />
Now causal nexus among the macroeconomic variables has been studied by employing<br />
Autoregressive Distribution Lag(ARDL) approach proposed by Peseran <strong>and</strong> Shin(2001) .<br />
Akaike Information Criterion, Schwarz Bayesian Criterion <strong>and</strong> Hannan-Quinn, Log Likelihood<br />
equation are most commonly used measures to determine the number <strong>of</strong> lags. Duration <strong>of</strong> the lag<br />
which provides the smallest critical value is identified as the model’s duration <strong>of</strong> lag if no<br />
autocorrelation is observed. In this study maximum duration <strong>of</strong> lag has been taken as 3. The<br />
number <strong>of</strong> lags which minimize the Schwarz Bayesian Criterion is 2 <strong>and</strong> LM test confirms that<br />
no autocorrelation problem exists at this duration <strong>of</strong> Lag. Criteria <strong>and</strong> test values are given in<br />
Table 2(a) <strong>and</strong> Table2 (b).
Table 2(a)<br />
Statistics for Selecting the Lag Order<br />
AIC SBC LL<br />
Lag 1 127.2179 114.6742 136.2179<br />
Lag 2 125.6181 113.1121* 134.6181<br />
Lag 3 128.7087 113.4699 139.7087<br />
Table2 (b)<br />
Diagnostic Tests<br />
Item Test Applied CHSQ(χ 2 ) Prob<br />
Serial Correlation Lagrange Multiplier Test 18.74 0.095<br />
Normality Test <strong>of</strong> Skewness <strong>and</strong> Kurtosis 2.88 0.236<br />
Functional Form Ramsey's RESET Test 0.59 0.443<br />
Heteroscedisticity. White Test 4.68 0.03<br />
Above results indicate that econometric problems like autocorrelation, conflict to normal<br />
distribution has not been observed. Similarly, no model specification error exists with reference<br />
to Functional form. Shrestha(2005) states that presence <strong>of</strong> hetero-scedisticity does not effect the<br />
estimates <strong>and</strong> as time series in the equation are <strong>of</strong> mixed order <strong>of</strong> integration so it is natural to detect<br />
heteroscedisticity.<br />
Table 3 below exhibits results <strong>of</strong> ARDL Model based on Schwarz Bayesian Criterion.<br />
Table 3(a)<br />
ARDL(1,0,0,0,0,0,1,0) selected based on SBC<br />
Regressor Coefficient S. Error T Ratio Prob.<br />
Ln INDEX(-1) 0.6068 0.0742 8.1819 0.000<br />
Ln IPI -0.0225 0.0388 0.5783 0.564<br />
Ln OIL 0.0481 0.0360 1.3345 0.185<br />
Ln XRATE 0.4675 0.2239 2.0879 0.039<br />
Ln TBILL - 0.0797 0.0176 4.5251 0.000<br />
Ln CPI 0.2757 0.3315 0.8316 0.407<br />
Ln FPI 0.7712 0.3376 2.2841 0.024<br />
Ln FPI(-1) -0.7401 0.3428 -2.1589 0.033<br />
Ln M1 0.4790 0.1037 4.6178 0.000<br />
Table 3(b)<br />
R 2 0.9929 Adj R 2 0.9925<br />
AIC 125.61 SBC 113.11<br />
F Statistics 1949<br />
F Significance 0.000<br />
DW Statistics 2.1000
Results reveal that industrial production, oil prices, inflation are not statistically significantly<br />
while interest rates, exchange rates, foreign portfolio investment <strong>and</strong> money supply have<br />
significant impact on equity prices.<br />
The results <strong>of</strong> the bounds testing approach for Co-integration show that the calculated<br />
F-statistics is 1949 which is significant at 1 percent level <strong>of</strong> significance implying that the null<br />
hypothesis <strong>of</strong> no cointegration cannot be accepted <strong>and</strong> there exists cointegration relationship<br />
among the variables in this model.<br />
An analysis <strong>of</strong> above Table 3 (a & b) indicates that macroeconomic variables significantly<br />
explain equity prices. The value <strong>of</strong> R-Bar-Squared is 0.99 which indicates a high degree <strong>of</strong><br />
correlation among variables. F statistics is also significant at 1% which indicates overall<br />
goodness <strong>of</strong> fit<br />
Table 4 displays the results long term coefficients under ARDL Approach. Results reveal that<br />
industrial production, oil prices, inflation <strong>and</strong> foreign portfolio investment are not statistically<br />
significantly while interest rates, exchange rates <strong>and</strong> money supply have significant long run<br />
effect on equity prices.<br />
Table 4<br />
Estimated Long Run Coefficients for selected ARDL Model<br />
Regressor Coefficient S. Error T Ratio Prob.<br />
LNIPI -0.0572 0.0964 -0.5934 0.554<br />
LNOIL 0.1222 0.0829 1.4743 0.143<br />
LNXRATE 1.1891 0.5260 2.2604 0.026<br />
LNTBILL -0.2027 0.0369 -5.4946 0.000<br />
LNCPI 0.7012 0.8286 0.8463 0.399<br />
LNFPI 0.0794 0.2713 0.2927 0.770<br />
LNM1 1.2185 0.1704 7.1487 0.000<br />
Interest rates are significantly negatively related with equity returns which are logical as increase<br />
in interest rates leads to increase in discount rate <strong>and</strong> it ultimately results in decrease in present<br />
value <strong>of</strong> future cash flows which represent fair intrinsic value <strong>of</strong> shares. X rate is significantly<br />
related to equity prices <strong>and</strong> as exchange rate is taken as $/ Rs so Ln XRate will always be<br />
negative so depreciation <strong>of</strong> home currency is negatively related to equity market prices. Money<br />
growth rate is positively related with equity prices that are in line with results drawn by Maysami
<strong>and</strong> Koh (2000). The possible reason is that increase in money supply leads to increase in<br />
liquidity that ultimately results in upward movement <strong>of</strong> nominal equity prices.<br />
Error Correction Representation <strong>of</strong> above long run relationship is reported in Table 5 which<br />
captures the short-run dynamics <strong>of</strong> relationship among macroeconomic variables <strong>and</strong> equity<br />
prices. The error correction model based upon ARDL approach establishes that changes in<br />
industrial production, oil prices <strong>and</strong> inflation are not statistically significantly while changes in<br />
interest rates, exchange rates, foreign portfolio investment <strong>and</strong> money supply have significant<br />
short term effect.<br />
Table 5(a)<br />
Error Correction Representation for the Selected ARDL Model<br />
Regressor Coefficient S. Error T Ratio Prob.<br />
∆LnIPI -0.2248 0.0389 -0.5783 0.564<br />
∆LnOIL 0.0481 0.0360 1.3345 0.185<br />
∆LnXRATE 0.4675 0.2239 2.0879 0.039<br />
∆LnTBILL -0.0797 0.0176 -4.5251 0.000<br />
∆LnCPI 0.2757 0.3315 0.8316 0.407<br />
∆LnFPI 0.7713 0.3377 2.2841 0.024<br />
∆LnM1 0.4790 0.1037 4.6178 0.000<br />
ECM(-1) -0.3932 0.0742 -5.3007 O.000<br />
Table 5(b)<br />
R 2 0.2670 Adj R 2 0.2137<br />
AIC 125.61 BIC 113.11<br />
F Statistics 1949<br />
F Significance 0.000<br />
DW Statistics 2.1000<br />
ECM = Ln Index + 0.057190*Ln IPI -0.12224*LnOiL -1.1891*Ln XRate +<br />
0.20266*LnTBill -0.70118*LnCPI -0.079440*Ln FPI -1.2185*LnM1<br />
According to results short term elasticities <strong>of</strong> interest rates, exchange rates <strong>and</strong> money supply<br />
are -0.08 , 0.47, <strong>and</strong> 0.48 respectively. It is worth mentioning that these elasticities are much<br />
lower than long run elasticities. It is also observed that foreign portfolio investment is not<br />
significant in long term but it is statistically significant in short term. ECM (-1) is one period lag<br />
value <strong>of</strong> error terms that are obtained from the long-run relationship. The coefficient <strong>of</strong> ECM(-1)
indicates how much <strong>of</strong> the disequilibrium in the short-run will be fixed (eliminated) in the longrun.<br />
As expected, the error correction variable ECM (-1) has been found negative <strong>and</strong> also<br />
statistically significant. The Coefficient <strong>of</strong> the ECM term suggests that adjustment process is<br />
quite fast <strong>and</strong> 39% <strong>of</strong> the previous year’s disequilibrium in equity prices from its equilibrium<br />
path will be corrected in the current year.<br />
Finally, CUSUM <strong>and</strong> CUSUMSQ plots are drawn to check the stability <strong>of</strong> short run <strong>and</strong> long<br />
run coefficients in the ARDL error correction model. Figure 1 shows the cumulative sum <strong>of</strong><br />
recursive residuals whereas Fig 2 displays the cumulative sum <strong>of</strong> squares <strong>of</strong> recursive residuals<br />
Fig 1<br />
Plot <strong>of</strong> Cumulative Sum <strong>of</strong> Recursive<br />
Residuals<br />
30<br />
25<br />
20<br />
15<br />
10<br />
5<br />
0<br />
-5<br />
-10<br />
-15<br />
-20<br />
-25<br />
-30<br />
1998M8 2000M4 2001M12 2003M8 2005M4 2006M12 2008M6<br />
The straight lines represent critical bounds at 5% significance level<br />
Fig. 2<br />
1.5<br />
Plot <strong>of</strong> Cumulative Sum <strong>of</strong> Squares <strong>of</strong><br />
Recursive Residuals<br />
1.0<br />
0.5<br />
0.0<br />
-0.5<br />
1998M8 2000M4 2001M12 2003M8 2005M4 2006M12 2008M6<br />
The straight lines represent critical bounds at 5% significance level<br />
Figure 1& 2 show that both CUSUM <strong>and</strong> CUSUMSQ are with in the critical bounds <strong>of</strong> 5% so it<br />
indicates that the model is structurally stable.
5. Conclusion<br />
This study examine the relationship among the inflation, industrial production, oil prices, short<br />
term interest rate, exchange rates, foreign portfolio investment, money supply <strong>and</strong> equity prices<br />
for the period 6/98 to 6/2008 by using autoregressive distributed lag approach based on bounds<br />
testing procedure proposed by Pesaran <strong>and</strong> Shin(2001). Autoregressive distributed lag approach<br />
has been applied it more powerful procedure to explore the long run relationship as well short<br />
term dynamics <strong>of</strong> relationship <strong>and</strong> yields consistent estimates <strong>of</strong> the long-run coefficients that<br />
are asymptotically normal irrespective <strong>of</strong> whether the underlying regressors are I(0) or I(1). Data<br />
has been tested to examine econometric problems like serial correlation, functional form,<br />
normality, heteroscdasticity <strong>and</strong> unit root by using LM test, Ramsey Reset test, skewness <strong>and</strong><br />
kurtosis test ,white test <strong>and</strong> ADF Test <strong>and</strong> Phillip Parren Test respectively. Results indicate that<br />
econometric problems like autocorrelation, conflict to normal distribution has not been observed.<br />
Similarly, no model specification error exists with reference to Functional form. Unit root test<br />
clearly indicate that the index series are not stationary at level but the first differences <strong>of</strong> the<br />
logarithmic transformations <strong>of</strong> the series are stationary However, white test indicates the presence<br />
<strong>of</strong> heteroscedisticity. Shrestha(2005) states that presence <strong>of</strong> hetero-scedisticity does not effect the<br />
estimates so in ARDL we deal with data series which may not be integrated at same level so<br />
detection <strong>of</strong> heteroscedisticity it is quite natural..<br />
Results <strong>of</strong> ARDL long run coefficients reveal that Industrial production, oil prices <strong>and</strong> inflation<br />
are not statistically significant in determining equity prices in long run while interest rates,<br />
exchange rates <strong>and</strong> money supply have significant long run effect on equity prices. The error<br />
correction model based upon ARDL approach captures the short term dynamics <strong>of</strong> prices <strong>and</strong> it<br />
also confirms that changes in industrial production, oil prices <strong>and</strong> inflation are not statistically<br />
significantly in short run while changes in interest rates, exchange rates, <strong>and</strong> money supply have<br />
significant short term effect. However, Foreign portfolio investment has significant short term<br />
effect in short term <strong>and</strong> no long term effect in long term. The error correction variable ECM (-1)<br />
has been found negative <strong>and</strong> statistically significant The Coefficient <strong>of</strong> the ECM term suggests<br />
that adjustment process is quite fast <strong>and</strong> 39% <strong>of</strong> the previous year’s disequilibrium in equity<br />
prices from its equilibrium path will be corrected in the current year. CUSUM <strong>and</strong> CUSUMSQ<br />
plots are drawn to check the stability <strong>of</strong> short run <strong>and</strong> long run coefficients in the ARDL error
correction model <strong>and</strong> . CUSUM <strong>and</strong> CUSUMSQ are with in the critical bounds <strong>of</strong> 5% that<br />
indicates that the model is structurally stable.<br />
This study facilitates the investors in taking effective investment decisions as by estimating the<br />
expected trends in exchange rates , money supply <strong>and</strong> interest they can estimate the future<br />
direction <strong>of</strong> equity prices <strong>and</strong> can allocate their resources more efficiently. Efficient market<br />
hypothesis provides that capital markets respond to arrival <strong>of</strong> new information so<br />
macroeconomic policies should be designed keeping in view the response <strong>of</strong> the capital market.<br />
Therefore, architects <strong>of</strong> monetary policy should be careful in revision <strong>of</strong> interest rates as capital<br />
market responds negatively to such decisions. Similarly, State Bank <strong>of</strong> <strong>Pakistan</strong> should also<br />
consider the impact <strong>of</strong> money supply on capital markets as has significant relationship with<br />
dynamic <strong>of</strong> equity returns.<br />
6. References<br />
Akmal M.S.(2007), “stock returns <strong>and</strong> inflation: an ARDL econometric investigation utilizing<br />
<strong>Pakistan</strong>i data” <strong>Pakistan</strong> Economic <strong>and</strong> Social Review Volume 45, No. 1 pp. 89-105<br />
Amihud, Y. (1996), Unexpected inflation <strong>and</strong> stock returns revised – Evidence from Israel.<br />
Journal <strong>of</strong> Money Credit <strong>and</strong> Banking, Volume 28, pp. 22-33<br />
Bahmani-Oskooee, M. <strong>and</strong> A. Nasir (2004), “ARDL approach to test the productivity bias<br />
hypothesis”, Review <strong>of</strong> Development Economics J., Volume 8, pp. 483-488.<br />
Boudhouch <strong>and</strong> Richarson (1993), “Stock returns <strong>and</strong> inflation: A long-horizon prospective” ,<br />
American Economic Review, pp.1346-1355.<br />
Beenstock, M. <strong>and</strong> Chan, K.F. 1998, “Economic Forces in the London Stock Market”, Oxford<br />
Bulletin <strong>of</strong> Economics <strong>and</strong> Statistics, 50 (1): 27-39.<br />
Burmeister, E. <strong>and</strong> K.D.Wall (1986), “The Arbitrage Pricing Theory <strong>and</strong> <strong>Macroeconomic</strong> Factor<br />
Measures”, The Financial Review, Vol.21, no.1, pp.1-20<br />
Burmeister,E. <strong>and</strong> M.B.McElroy (1988), “Joint Estimation <strong>of</strong> Factor Sensitivities <strong>and</strong> Risk<br />
Premia for the Arbitrage Pricing Theory”, The Journal <strong>of</strong> Finance, Vol.43, no.3, pp.721-735<br />
Chen, N.(1983),“Some Empirical Tests <strong>of</strong> the Theory <strong>of</strong> Arbitrage Pricing”, The Journal <strong>of</strong><br />
Finance, Vol.38, pp.1393-1414.<br />
Chen, N. F., Roll, R., & Ross, S. (1986) , “Economic forces <strong>and</strong> the stock market”, Journal <strong>of</strong><br />
Business, 59, 383-403.<br />
Dickey, D.A. <strong>and</strong> Fuller, W.A. (1979),” Distribution for the Estimators for Autoregressive Time<br />
Series with Unit Root”, Journal <strong>of</strong> American Statistical Association, 74, 427-431.
DeFina, R.H., (1991), “Does Inflation Depress the Stock Market?”, Business Review, Federal<br />
Reserve Bank <strong>of</strong> Philadelphia, 3-12.<br />
Fazal H <strong>and</strong> Mahmood T.(2001), “The Stock Market <strong>and</strong> the Economy in <strong>Pakistan</strong>”<br />
<strong>Pakistan</strong> Development Review, 40 : 2 pp. 107–114<br />
The<br />
Fazal H(2006), “Stock <strong>Prices</strong>, Real Sector <strong>and</strong> the Causal Analysis: The Case <strong>of</strong> <strong>Pakistan</strong>”<br />
Journal <strong>of</strong> Management <strong>and</strong> Social Sciences Vol. 2, No. 2, 179-185<br />
Engle, R. F. <strong>and</strong> Granger, C. W. J.(1987),” Cointegration <strong>and</strong> Error Correction:<br />
Representation, Estimation <strong>and</strong> Testing” , Econometrica; 55: 251-276.<br />
Fama, E. F. (1981), Stock returns, real activity, inflation <strong>and</strong> money. American Economic<br />
Review, Volume 71(4), pp. 545-565.<br />
Firth (1979),“The relationship between stock market returns <strong>and</strong> rates <strong>of</strong> inflation”, Journal <strong>of</strong><br />
Finance, Volume 34, pp. 743-760.<br />
Flannery, M. J. & Protopapadakis, A. A. (2002), “ <strong>Macroeconomic</strong> factors do influence<br />
aggregate stock returns” , The Review <strong>of</strong> Financial Studies, 15, 3, 751-782<br />
Geske, R. <strong>and</strong> Roll, R., 1983. The fiscal <strong>and</strong> monetary linkage between stock returns <strong>and</strong><br />
inflation. Journal <strong>of</strong> Finance; 38: 1-33.<br />
Hamao, Y., 1988. An empirical examination <strong>of</strong> Arbitrage Pricing Theory: using<br />
Japanese data. Working Paper. University <strong>of</strong> California, USA<br />
Ioannidis et al. (2004), Inflation, Uncertainty <strong>and</strong> Stock Market Returns Evidence Using Greek<br />
Data. Under Publication<br />
Johansen, S. <strong>and</strong> Juselius, K.(1990),” Maximum likelihood estimation <strong>and</strong> inference on<br />
cointegration with application to the dem<strong>and</strong> for money” ,Oxford Bulletin <strong>of</strong> Economics <strong>and</strong><br />
Statistics; 52: 169-210.<br />
Johansen, S.1(988),” Statistical analysis <strong>of</strong> cointegration vectors”, Journal <strong>of</strong> Economic<br />
Dynamics <strong>and</strong> Control; 12: 231-254.<br />
Johansen, S., Juselius, K.(1990), “Maximum likelihood estimation <strong>and</strong> inference on<br />
cointegration – With applications to the dem<strong>and</strong> for money”, Oxford Bulletin <strong>of</strong> Economics <strong>and</strong><br />
Statistics 51, 169–210<br />
Johansen, S.1(991),”Estimation <strong>and</strong> Hypothesis Testing <strong>of</strong> Cointegration Vectors<br />
in Gaussian Vector Autoregressive Models”, Econometrica; 59(6): 1551-<br />
1580.
Maysami, R. C. <strong>and</strong> Kho, T. S.(2000),”A vector error correction model <strong>of</strong> the Singapore stock<br />
market”, International Review <strong>of</strong> Economics <strong>and</strong> Finance; 9:79-96.<br />
Maysami R Cooper, Lee Chuin Howe L. C. , Hamzah A.(2004), “Relationship between<br />
<strong>Macroeconomic</strong> Variables <strong>and</strong> Stock Market Indices: Cointegration Evidence from Stock<br />
Exchange <strong>of</strong> Singapore’s All-S Sector Indices” , Jurnal Pengurusan 24 47-77<br />
McElroy, M.B. <strong>and</strong> E. Burmeister (1988), “Arbitrage Pricing Theory as a Restricted Nonlinear<br />
Multivariate Regression Model: Iterated Nonlinear Seemingly Unrelated Regression Estimates”,<br />
Journal <strong>of</strong> Business <strong>and</strong> Economic Statistics, Vol.6, pp.29-42.<br />
Mukharjee, T. K. <strong>and</strong> Naka, A.(1995),”Dynamic relations between macroeconomic<br />
variables <strong>and</strong> the Japanese stock market: an application <strong>of</strong> a vector error correction<br />
model”, The Journal <strong>of</strong> Financial Research; 18 (2): 223-237.<br />
Nasseh, A. <strong>and</strong> Strauss, J.(2000),”Stock prices <strong>and</strong> domestic <strong>and</strong> international macroeconomic<br />
activity: a cointegration approach” , The Quarterly Review <strong>of</strong> Economics <strong>and</strong> Finance; 40(2):<br />
229-245<br />
Min, B. Shrestha (2005), “ARDL Modelling Approach to Co-integration Test”. mimeo.<br />
Pesaran <strong>and</strong> Shin (1995, 1998), An autoregressive distributed lag modeling approach to cointegration<br />
analysis. DAE Working papers, No.9514.<br />
Pesaran et al. (1996), Testing for the existence <strong>of</strong> a long run relationship. DAE Working papers,<br />
No.9622.<br />
Pesaran, M. Hasem, Yongcheol Shin <strong>and</strong> Richard J. Smith (2001),” Bounds testing approaches to<br />
the analysis <strong>of</strong> level relationships”, Journal <strong>of</strong> Applied Econometrics, Volume 16(3), pp. 289-<br />
326.<br />
Phillips, P. C. B., <strong>and</strong> P. Perron(1988), “Testing for a Unit Root in Time Series Regression” ,<br />
Biometrika 75, 335-46.<br />
Ross, S. A. (1976),”The arbitrage theory <strong>of</strong> capital assets” , Journal <strong>of</strong> Economic Theory, 341-<br />
360.<br />
Kazi H.M(2008),” Stock Market Price Movements <strong>and</strong> <strong>Macroeconomic</strong> Variables”,<br />
International Review <strong>of</strong> Business Research Papers, Vol. 4 No.3 Pp.114-126<br />
Shahid A (2008),” Aggregate Economic Variables <strong>and</strong>Stock Markets in India” International<br />
Research Journal <strong>of</strong> Finance <strong>and</strong> Economics, Issue 14<br />
Spyrou (2001), “Inflation <strong>and</strong> stock returns”, Applied Economic Letters, pp. 447-450.


