Pricing Policy Effectiveness is Domestic Water Demand Management
Pricing Policy Effectiveness is Domestic Water Demand Management
Pricing Policy Effectiveness is Domestic Water Demand Management
Create successful ePaper yourself
Turn your PDF publications into a flip-book with our unique Google optimized e-Paper software.
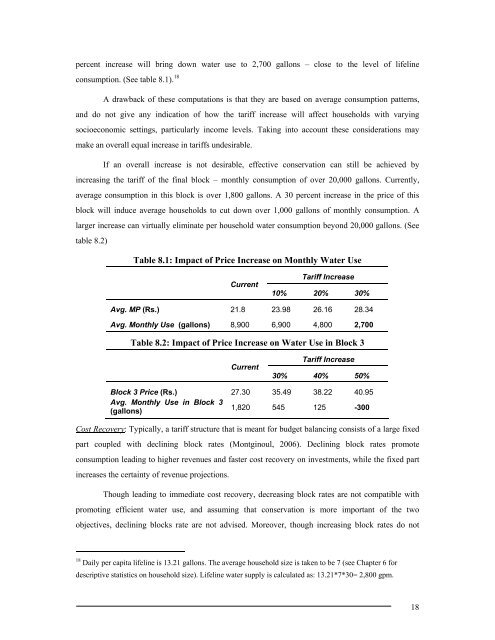
percent increase will bring down water use to 2,700 gallons – close to the level of lifeline<br />
consumption. (See table 8.1). 18<br />
A drawback of these computations <strong>is</strong> that they are based on average consumption patterns,<br />
and do not give any indication of how the tariff increase will affect households with varying<br />
socioeconomic settings, particularly income levels. Taking into account these considerations may<br />
make an overall equal increase in tariffs undesirable.<br />
If an overall increase <strong>is</strong> not desirable, effective conservation can still be achieved by<br />
increasing the tariff of the final block – monthly consumption of over 20,000 gallons. Currently,<br />
average consumption in th<strong>is</strong> block <strong>is</strong> over 1,800 gallons. A 30 percent increase in the price of th<strong>is</strong><br />
block will induce average households to cut down over 1,000 gallons of monthly consumption. A<br />
larger increase can virtually eliminate per household water consumption beyond 20,000 gallons. (See<br />
table 8.2)<br />
Table 8.1: Impact of Price Increase on Monthly <strong>Water</strong> Use<br />
Current<br />
Tariff Increase<br />
10% 20% 30%<br />
Avg. MP (Rs.) 21.8 23.98 26.16 28.34<br />
Avg. Monthly Use (gallons) 8,900 6,900 4,800 2,700<br />
Table 8.2: Impact of Price Increase on <strong>Water</strong> Use in Block 3<br />
Current<br />
Tariff Increase<br />
30% 40% 50%<br />
Block 3 Price (Rs.) 27.30 35.49 38.22 40.95<br />
Avg. Monthly Use in Block 3<br />
(gallons)<br />
1,820 545 125 -300<br />
Cost Recovery: Typically, a tariff structure that <strong>is</strong> meant for budget balancing cons<strong>is</strong>ts of a large fixed<br />
part coupled with declining block rates (Montginoul, 2006). Declining block rates promote<br />
consumption leading to higher revenues and faster cost recovery on investments, while the fixed part<br />
increases the certainty of revenue projections.<br />
Though leading to immediate cost recovery, decreasing block rates are not compatible with<br />
promoting efficient water use, and assuming that conservation <strong>is</strong> more important of the two<br />
objectives, declining blocks rate are not adv<strong>is</strong>ed. Moreover, though increasing block rates do not<br />
18 Daily per capita lifeline <strong>is</strong> 13.21 gallons. The average household size <strong>is</strong> taken to be 7 (see Chapter 6 for<br />
descriptive stat<strong>is</strong>tics on household size). Lifeline water supply <strong>is</strong> calculated as: 13.21*7*30= 2,800 gpm.<br />
18


