Pricing Policy Effectiveness is Domestic Water Demand Management
Pricing Policy Effectiveness is Domestic Water Demand Management
Pricing Policy Effectiveness is Domestic Water Demand Management
You also want an ePaper? Increase the reach of your titles
YUMPU automatically turns print PDFs into web optimized ePapers that Google loves.
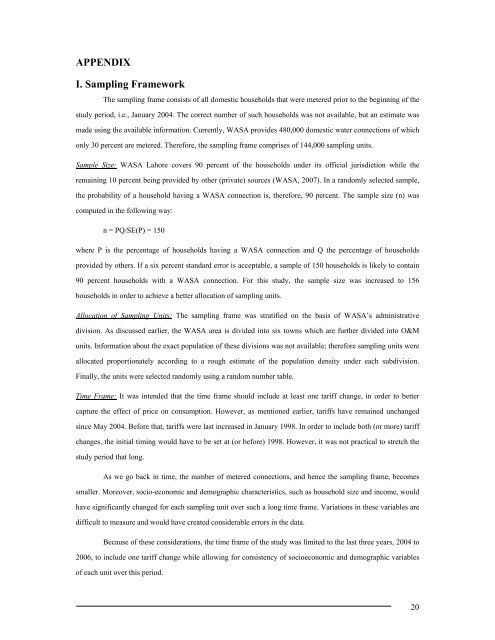
APPENDIX<br />
I. Sampling Framework<br />
The sampling frame cons<strong>is</strong>ts of all domestic households that were metered prior to the beginning of the<br />
study period, i.e., January 2004. The correct number of such households was not available, but an estimate was<br />
made using the available information. Currently, WASA provides 480,000 domestic water connections of which<br />
only 30 percent are metered. Therefore, the sampling frame compr<strong>is</strong>es of 144,000 sampling units.<br />
Sample Size: WASA Lahore covers 90 percent of the households under its official jur<strong>is</strong>diction while the<br />
remaining 10 percent being provided by other (private) sources (WASA, 2007). In a randomly selected sample,<br />
the probability of a household having a WASA connection <strong>is</strong>, therefore, 90 percent. The sample size (n) was<br />
computed in the following way:<br />
n = PQ/SE(P) = 150<br />
where P <strong>is</strong> the percentage of households having a WASA connection and Q the percentage of households<br />
provided by others. If a six percent standard error <strong>is</strong> acceptable, a sample of 150 households <strong>is</strong> likely to contain<br />
90 percent households with a WASA connection. For th<strong>is</strong> study, the sample size was increased to 156<br />
households in order to achieve a better allocation of sampling units.<br />
Allocation of Sampling Units: The sampling frame was stratified on the bas<strong>is</strong> of WASA’s admin<strong>is</strong>trative<br />
div<strong>is</strong>ion. As d<strong>is</strong>cussed earlier, the WASA area <strong>is</strong> divided into six towns which are further divided into O&M<br />
units. Information about the exact population of these div<strong>is</strong>ions was not available; therefore sampling units were<br />
allocated proportionately according to a rough estimate of the population density under each subdiv<strong>is</strong>ion.<br />
Finally, the units were selected randomly using a random number table.<br />
Time Frame: It was intended that the time frame should include at least one tariff change, in order to better<br />
capture the effect of price on consumption. However, as mentioned earlier, tariffs have remained unchanged<br />
since May 2004. Before that, tariffs were last increased in January 1998. In order to include both (or more) tariff<br />
changes, the initial timing would have to be set at (or before) 1998. However, it was not practical to stretch the<br />
study period that long.<br />
As we go back in time, the number of metered connections, and hence the sampling frame, becomes<br />
smaller. Moreover, socio-economic and demographic character<strong>is</strong>tics, such as household size and income, would<br />
have significantly changed for each sampling unit over such a long time frame. Variations in these variables are<br />
difficult to measure and would have created considerable errors in the data.<br />
Because of these considerations, the time frame of the study was limited to the last three years, 2004 to<br />
2006, to include one tariff change while allowing for cons<strong>is</strong>tency of socioeconomic and demographic variables<br />
of each unit over th<strong>is</strong> period.<br />
20


