A. General Information - Pacific Lutheran University
A. General Information - Pacific Lutheran University
A. General Information - Pacific Lutheran University

You also want an ePaper? Increase the reach of your titles
YUMPU automatically turns print PDFs into web optimized ePapers that Google loves.
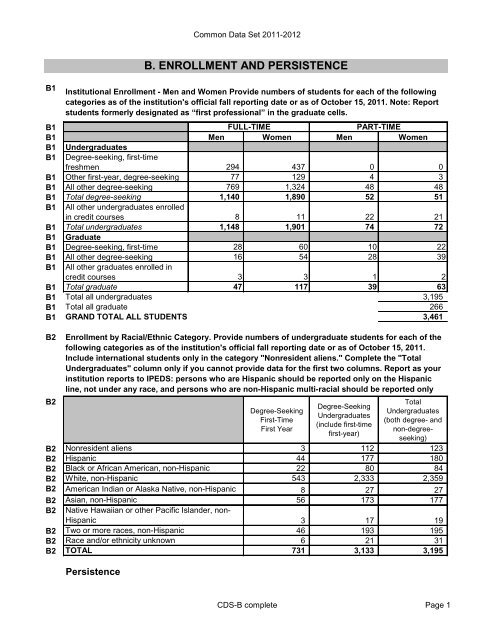
Common Data Set 2011-2012<br />
B1<br />
B1<br />
B1 Men<br />
FULL-TIME<br />
Women Men<br />
PART-TIME<br />
Women<br />
B1 Undergraduates<br />
B1 Degree-seeking, first-time<br />
freshmen 294 437 0 0<br />
B1 Other first-year, degree-seeking 77 129 4 3<br />
B1 All other degree-seeking 769 1,324 48 48<br />
B1 Total degree-seeking 1,140 1,890 52 51<br />
B1 All other undergraduates enrolled<br />
in credit courses 8 11 22 21<br />
B1 Total undergraduates 1,148 1,901 74 72<br />
B1 Graduate<br />
B1 Degree-seeking, first-time 28 60 10 22<br />
B1 All other degree-seeking 16 54 28 39<br />
B1 All other graduates enrolled in<br />
credit courses 3 3 1 2<br />
B1 Total graduate 47 117 39 63<br />
B1 Total all undergraduates<br />
3,195<br />
B1 Total all graduate<br />
266<br />
B1 GRAND TOTAL ALL STUDENTS<br />
3,461<br />
B2 Enrollment by Racial/Ethnic Category. Provide numbers of undergraduate students for each of the<br />
following categories as of the institution's official fall reporting date or as of October 15, 2011.<br />
Include international students only in the category "Nonresident aliens." Complete the "Total<br />
Undergraduates" column only if you cannot provide data for the first two columns. Report as your<br />
institution reports to IPEDS: persons who are Hispanic should be reported only on the Hispanic<br />
line, not under any race, and persons who are non-Hispanic multi-racial should be reported only<br />
B2 under "Two or more races."<br />
Total<br />
Degree-Seeking<br />
Degree-Seeking<br />
Undergraduates<br />
Undergraduates<br />
First-Time<br />
(both degree- and<br />
(include first-time<br />
First Year<br />
non-degreeseeking)<br />
first-year)<br />
B2 Nonresident aliens<br />
3 112 123<br />
B2 Hispanic<br />
44 177 180<br />
B2 Black or African American, non-Hispanic<br />
22 80 84<br />
B2 White, non-Hispanic<br />
543 2,333 2,359<br />
B2 American Indian or Alaska Native, non-Hispanic<br />
8 27 27<br />
B2 Asian, non-Hispanic<br />
56 173 177<br />
B2 Native Hawaiian or other <strong>Pacific</strong> Islander, non-<br />
Hispanic<br />
3 17 19<br />
B2 Two or more races, non-Hispanic<br />
46 193 195<br />
B2 Race and/or ethnicity unknown<br />
6 21 31<br />
B2 TOTAL<br />
731 3,133 3,195<br />
Persistence<br />
B. ENROLLMENT AND PERSISTENCE<br />
Institutional Enrollment - Men and Women Provide numbers of students for each of the following<br />
categories as of the institution's official fall reporting date or as of October 15, 2011. Note: Report<br />
students formerly designated as “first professional” in the graduate cells.<br />
CDS-B complete Page 1