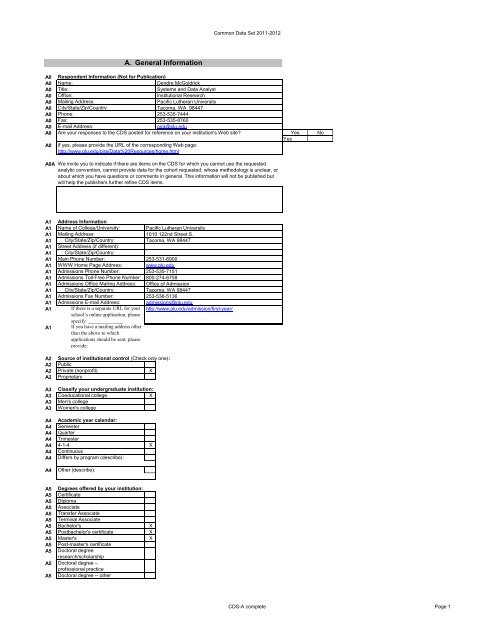
A. General Information - Pacific Lutheran University
A. General Information - Pacific Lutheran University
A. General Information - Pacific Lutheran University

You also want an ePaper? Increase the reach of your titles
YUMPU automatically turns print PDFs into web optimized ePapers that Google loves.
Common Data Set 2011-2012<br />
A0 Respondent <strong>Information</strong> (Not for Publication)<br />
A0 Name: Deirdre McGoldrick<br />
A0 Title: Systems and Data Analyst<br />
A0 Office: Institutional Research<br />
A0 Mailing Address: <strong>Pacific</strong> <strong>Lutheran</strong> <strong>University</strong><br />
A0 City/State/Zip/Country: Tacoma, WA 98447<br />
A0 Phone: 253-535-7444<br />
A0 Fax: 253-535-8760<br />
A0 E-mail Address: oira@plu.edu<br />
A0 Are your responses to the CDS posted for reference on your institution's Web site? Yes No<br />
Yes<br />
A0 If yes, please provide the URL of the corresponding Web page:<br />
http://www.plu.edu/oira/Data%20Resources/home.html<br />
A0A<br />
A. <strong>General</strong> <strong>Information</strong><br />
We invite you to indicate if there are items on the CDS for which you cannot use the requested<br />
analytic convention, cannot provide data for the cohort requested, whose methodology is unclear, or<br />
about which you have questions or comments in general. This information will not be published but<br />
will help the publishers further refine CDS items.<br />
A1 Address <strong>Information</strong><br />
A1 Name of College/<strong>University</strong>:<br />
<strong>Pacific</strong> <strong>Lutheran</strong> <strong>University</strong><br />
A1 Mailing Address:<br />
1010 122nd Street S.<br />
A1 City/State/Zip/Country:<br />
Tacoma, WA 98447<br />
A1 Street Address (if different):<br />
A1 City/State/Zip/Country:<br />
A1 Main Phone Number:<br />
253-531-6900<br />
A1 WWW Home Page Address: www.plu.edu<br />
A1 Admissions Phone Number:<br />
253-535-7151<br />
A1 Admissions Toll-Free Phone Number: 800-274-6758<br />
A1 Admissions Office Mailing Address: Office of Admission<br />
A1 City/State/Zip/Country:<br />
Tacoma, WA 98447<br />
A1 Admissions Fax Number:<br />
253-536-5136<br />
A1 Admissions E-mail Address:<br />
admissions@plu.edu<br />
A1 If there is a separate URL for your<br />
school’s online application, please<br />
specify: ______________<br />
http://www.plu.edu/admission/first-year/<br />
A1 If you have a mailing address other<br />
than the above to which<br />
applications should be sent, please<br />
provide:<br />
A2<br />
A2<br />
Source of institutional control (Check only one):<br />
Public<br />
A2 Private (nonprofit) X<br />
A2 Proprietary<br />
A3 Classify your undergraduate institution:<br />
A3 Coeducational college X<br />
A3 Men's college<br />
A3 Women's college<br />
A4 Academic year calendar:<br />
A4 Semester<br />
A4 Quarter<br />
A4 Trimester<br />
A4 4-1-4 X<br />
A4 Continuous<br />
A4 Differs by program (describe):<br />
A4<br />
Other (describe):<br />
A5 Degrees offered by your institution:<br />
A5 Certificate<br />
A5 Diploma<br />
A5 Associate<br />
A5 Transfer Associate<br />
A5 Terminal Associate<br />
A5 Bachelor's X<br />
A5 Postbachelor's certificate X<br />
A5 Master's X<br />
A5 Post-master's certificate<br />
A5 Doctoral degree<br />
research/scholarship<br />
A5 Doctoral degree –<br />
professional practice<br />
A5 Doctoral degree -- other<br />
CDS-A complete Page 1
Common Data Set 2011-2012<br />
B1<br />
B1<br />
B1 Men<br />
FULL-TIME<br />
Women Men<br />
PART-TIME<br />
Women<br />
B1 Undergraduates<br />
B1 Degree-seeking, first-time<br />
freshmen 294 437 0 0<br />
B1 Other first-year, degree-seeking 77 129 4 3<br />
B1 All other degree-seeking 769 1,324 48 48<br />
B1 Total degree-seeking 1,140 1,890 52 51<br />
B1 All other undergraduates enrolled<br />
in credit courses 8 11 22 21<br />
B1 Total undergraduates 1,148 1,901 74 72<br />
B1 Graduate<br />
B1 Degree-seeking, first-time 28 60 10 22<br />
B1 All other degree-seeking 16 54 28 39<br />
B1 All other graduates enrolled in<br />
credit courses 3 3 1 2<br />
B1 Total graduate 47 117 39 63<br />
B1 Total all undergraduates<br />
3,195<br />
B1 Total all graduate<br />
266<br />
B1 GRAND TOTAL ALL STUDENTS<br />
3,461<br />
B2 Enrollment by Racial/Ethnic Category. Provide numbers of undergraduate students for each of the<br />
following categories as of the institution's official fall reporting date or as of October 15, 2011.<br />
Include international students only in the category "Nonresident aliens." Complete the "Total<br />
Undergraduates" column only if you cannot provide data for the first two columns. Report as your<br />
institution reports to IPEDS: persons who are Hispanic should be reported only on the Hispanic<br />
line, not under any race, and persons who are non-Hispanic multi-racial should be reported only<br />
B2 under "Two or more races."<br />
Total<br />
Degree-Seeking<br />
Degree-Seeking<br />
Undergraduates<br />
Undergraduates<br />
First-Time<br />
(both degree- and<br />
(include first-time<br />
First Year<br />
non-degreeseeking)<br />
first-year)<br />
B2 Nonresident aliens<br />
3 112 123<br />
B2 Hispanic<br />
44 177 180<br />
B2 Black or African American, non-Hispanic<br />
22 80 84<br />
B2 White, non-Hispanic<br />
543 2,333 2,359<br />
B2 American Indian or Alaska Native, non-Hispanic<br />
8 27 27<br />
B2 Asian, non-Hispanic<br />
56 173 177<br />
B2 Native Hawaiian or other <strong>Pacific</strong> Islander, non-<br />
Hispanic<br />
3 17 19<br />
B2 Two or more races, non-Hispanic<br />
46 193 195<br />
B2 Race and/or ethnicity unknown<br />
6 21 31<br />
B2 TOTAL<br />
731 3,133 3,195<br />
Persistence<br />
B. ENROLLMENT AND PERSISTENCE<br />
Institutional Enrollment - Men and Women Provide numbers of students for each of the following<br />
categories as of the institution's official fall reporting date or as of October 15, 2011. Note: Report<br />
students formerly designated as “first professional” in the graduate cells.<br />
CDS-B complete Page 1
Common Data Set 2011-2012<br />
B3 Number of degrees awarded from July 1, 2010 to June 30, 2011<br />
B3 Certificate/diploma<br />
B3 Associate degrees<br />
B3 Bachelor's degrees 835<br />
B3 Postbachelor's certificates 17<br />
B3 Master's degrees 121<br />
B3 Post-Master's certificates<br />
B3 Doctoral degrees –<br />
research/scholarship<br />
B3 Doctoral degrees – professional<br />
practice<br />
B3 Doctoral degrees – other<br />
Graduation Rates<br />
The items in this section correspond to data elements collected by the IPEDS Web-based Data Collection<br />
System's Graduation Rate Survey (GRS). For complete instructions and definitions of data elements, see<br />
the IPEDS GRS instructions and glossary on the 2011 Web-based survey.<br />
For Bachelor's or Equivalent Programs<br />
Please provide data for the Fall 2005 cohort if available. If Fall 2005 cohort data are<br />
not available, provide data for the Fall 2004 cohort.<br />
B4<br />
B5<br />
B6<br />
B7<br />
B8<br />
B9<br />
B10<br />
Fall 2005 Cohort<br />
Report for the cohort of full-time first-time bachelor's (or equivalent) degree-seeking undergraduate<br />
students who entered in Fall 2005. Include in the cohort those who entered your institution during the<br />
summer term preceding Fall 2005.<br />
Initial 2005 cohort of first-time, full-time bachelor's (or equivalent) degree-seeking<br />
undergraduate students; total all students:<br />
Of the initial 2005 cohort, how many did not persist and did not graduate for the<br />
following reasons: death, permanent disability, service in the armed forces, foreign aid<br />
service of the federal government, or official church missions; total allowable<br />
exclusions:<br />
Final 2005 cohort, after adjusting for allowable exclusions: (subtract question B5 from<br />
question B4)<br />
Of the initial 2005 cohort, how many completed the program in four years or less (by<br />
August 31, 2009):<br />
Of the initial 2005 cohort, how many completed the program in more than four years<br />
but in five years or less (after August 31, 2009 and by August 31, 2010):<br />
Of the initial 2005 cohort, how many completed the program in more than five years but<br />
in six years or less (after August 31, 2010 and by August 31, 2011):<br />
Total graduating within six years (sum of questions B7, B8, and B9):<br />
690<br />
1<br />
689<br />
340<br />
101<br />
15<br />
456<br />
CDS-B complete Page 2
Common Data Set 2011-2012<br />
B11<br />
Six-year graduation rate for 2005 cohort (question B10 divided by question B6):<br />
66%<br />
B4<br />
B5<br />
B6<br />
B7<br />
B8<br />
B9<br />
B10<br />
B11<br />
Fall 2004 Cohort<br />
Report for the cohort of full-time first-time bachelor's (or equivalent) degree-seeking undergraduate<br />
students who entered in Fall 2004. Include in the cohort those who entered your institution during the<br />
summer term preceding Fall 2004.<br />
Initial 2004 cohort of first-time, full-time bachelor's (or equivalent) degree-seeking<br />
undergraduate students; total all students:<br />
Of the initial 2004 cohort, how many did not persist and did not graduate for the<br />
following reasons: death, permanent disability, service in the armed forces, foreign aid<br />
service of the federal government, or official church missions; total allowable<br />
exclusions:<br />
Final 2004 cohort, after adjusting for allowable exclusions: (subtract question B5 from<br />
question B4)<br />
Of the initial 2004 cohort, how many completed the program in four years or less (by<br />
August 31, 2008):<br />
Of the initial 2004 cohort, how many completed the program in more than four years<br />
but in five years or less (after August 31, 2008 and by August 31, 2009):<br />
Of the initial 2004 cohort, how many completed the program in more than five years but<br />
in six years or less (after August 31, 2009 and by August 31, 2010):<br />
Total graduating within six years (sum of questions B7, B8, and B9):<br />
Six-year graduation rate for 2004 cohort (question B10 divided by question B6):<br />
701<br />
1<br />
700<br />
372<br />
78<br />
17<br />
467<br />
67%<br />
For Two-Year Institutions<br />
B12<br />
B13<br />
B14<br />
B15<br />
Please provide data for the 2008 cohort if available. If 2008 cohort data are not<br />
available, provide data for the 2007 cohort.<br />
2008 Cohort<br />
Initial 2008 cohort, total of first-time, full-time degree/certificate-seeking students:<br />
Of the initial 2008 cohort, how many did not persist and did not graduate for the<br />
following reasons: death, permanent disability, service in the armed forces, foreign aid<br />
service of the federal government, or official church missions; total allowable<br />
exclusions:<br />
Final 2008 cohort, after adjusting for allowable exclusions (Subtract question B13 from<br />
question B12):<br />
Completers of programs of less than two years duration (total):<br />
0<br />
CDS-B complete Page 3
Common Data Set 2011-2012<br />
B16<br />
B17<br />
Completers of programs of less than two years within 150 percent of normal time:<br />
Completers of programs of at least two but less than four years (total):<br />
B18<br />
B19<br />
B20<br />
B21<br />
Completers of programs of at least two but less than four-years within 150 percent of<br />
normal time:<br />
Total transfers-out (within three years) to other institutions:<br />
Total transfers to two-year institutions:<br />
Total transfers to four-year institutions:<br />
2007 Cohort<br />
B12 Initial 2007 cohort, total of first-time, full-time degree/certificate-seeking students:<br />
B13<br />
B14<br />
B15<br />
B16<br />
B17<br />
Of the initial 2007 cohort, how many did not persist and did not graduate for the<br />
following reasons: death, permanent disability, service in the armed forces, foreign aid<br />
service of the federal government, or official church missions; total allowable<br />
exclusions:<br />
Final 2007 cohort, after adjusting for allowable exclusions (Subtract question B13 from<br />
question B12):<br />
Completers of programs of less than two years duration (total):<br />
Completers of programs of less than two years within 150 percent of normal time:<br />
Completers of programs of at least two but less than four years (total):<br />
0<br />
B18<br />
B19<br />
B20<br />
B21<br />
Completers of programs of at least two but less than four-years within 150 percent of<br />
normal time:<br />
Total transfers-out (within three years) to other institutions:<br />
Total transfers to two-year institutions:<br />
Total transfers to four-year institutions:<br />
Retention Rates<br />
Report for the cohort of all full-time, first-time bachelor’s (or equivalent) degree-seeking undergraduate<br />
students who entered in Fall 2010 (or the preceding summer term). The initial cohort may be adjusted for<br />
students who departed for the following reasons: death, permanent disability, service in the armed forces,<br />
foreign aid service of the federal government or official church missions. No other adjustments to the initial<br />
cohort should be made.<br />
B22<br />
For the cohort of all full-time bachelor’s (or equivalent) degree-seeking undergraduate<br />
students who entered your institution as freshmen in Fall 2010 (or the preceding<br />
summer term), what percentage was enrolled at your institution as of the date your<br />
institution calculates its official enrollment in Fall 2011?<br />
82%<br />
CDS-B complete Page 4
Common Data Set 2011-2012<br />
C. FIRST-TIME, FIRST-YEAR (FRESHMAN) ADMISSION<br />
Applications<br />
C1 First-time, first-year, (freshmen) students: Provide the number of degree-seeking, first-time, firstyear<br />
students who applied, were admitted, and enrolled (full- or part-time) in Fall 2011. Include<br />
early decision, early action, and students who began studies during summer in this cohort.<br />
Applicants should include only those students who fulfilled the requirements for consideration for<br />
admission (i.e., who completed actionable applications) and who have been notified of one of the<br />
following actions: admission, nonadmission, placement on waiting list, or application withdrawn<br />
(by applicant or institution). Admitted applicants should include wait-listed students who were<br />
C1 Total first-time, first-year (freshman) men who applied<br />
1334<br />
C1 Total first-time, first-year (freshman) women who applied<br />
1955<br />
C1 Total first-time, first-year (freshman) men who were admitted<br />
975<br />
C1 Total first-time, first-year (freshman) women who were admitted<br />
1545<br />
C1 Total full-time, first-time, first-year (freshman) men who enrolled<br />
294<br />
C1 Total part-time, first-time, first-year (freshman) men who enrolled<br />
C1 Total full-time, first-time, first-year (freshman) women who enrolled<br />
437<br />
C1 Total part-time, first-time, first-year (freshman) women who enrolled<br />
C2<br />
C2<br />
C2<br />
C2<br />
C2<br />
C2<br />
C2<br />
C2<br />
C2<br />
Freshman wait-listed students (students who met admission requirements but whose final<br />
admission was contingent on space availability)<br />
Do you have a policy of placing students on a waiting list?<br />
If yes, please answer the questions below for Fall 2011 admissions:<br />
Number of qualified applicants offered a placed on waiting list<br />
Number accepting a place on the waiting list<br />
Number of wait-listed students admitted<br />
Is your waiting list ranked?<br />
If yes, do you release that information to students?<br />
Do you release that information to school counselors?<br />
Yes<br />
No<br />
X<br />
C3<br />
C3<br />
C3<br />
C3<br />
Admission Requirements<br />
High school completion requirement<br />
High school diploma is required and GED is<br />
accepted<br />
High school diploma is required and GED is not<br />
accepted<br />
High school diploma or equivalent is not required<br />
X<br />
C4<br />
C4<br />
C4<br />
C4<br />
Does your institution require or recommend a general college-preparatory program for degreeseeking<br />
students?<br />
Require<br />
Recommend<br />
Neither require nor recommend<br />
X<br />
C5<br />
Distribution of high school units required and/or recommended. Specify the distribution of academic<br />
high school course units required and/or recommended of all or most degree-seeking students using<br />
Carnegie units (one unit equals one year of study or its equivalent). If you use a different system for<br />
calculating units, please convert.<br />
C5<br />
Units<br />
Required<br />
Units<br />
Recommended<br />
C5 Total academic units 17<br />
CDS-C complete Page 1
Common Data Set 2011-2012<br />
C5 English 4<br />
C5 Mathematics 2 3<br />
C5 Science 2<br />
C5 Of these, units that must be<br />
lab<br />
2<br />
C5 Foreign language 2 2<br />
C5 Social studies 2<br />
C5 History<br />
C5 Academic electives 3<br />
C5 Computer Science<br />
C5 Visual/Performing Arts 1<br />
C5 Other (specify)<br />
C6<br />
C6<br />
C6<br />
C6<br />
C6<br />
C6<br />
Basis for Selection<br />
Do you have an open admission policy, under which virtually all secondary school graduates or students<br />
with GED equivalency diplomas are admitted without regard to academic record, test scores, or other<br />
qualifications? If so, check which applies:<br />
Open admission policy as described above for all students<br />
Open admission policy as described above for most students, but--<br />
selective admission for out-of-state students<br />
selective admission to some programs<br />
other (explain)<br />
C7<br />
C7<br />
Relative importance of each of the following academic and nonacademic factors in first-time, firstyear,<br />
degree-seeking (freshman) admission decisions.<br />
Very Important Important Considered Not Considered<br />
C7 Academic<br />
C7 Rigor of secondary school<br />
record<br />
X<br />
C7 Class rank X<br />
C7 Academic GPA X<br />
C7 Standardized test scores X<br />
C7 Application Essay X<br />
C7 Recommendation(s) X<br />
C7 Nonacademic<br />
C7 Interview X<br />
C7 Extracurricular activities X<br />
C7 Talent/ability X<br />
C7 Character/personal qualities X<br />
C7 First generation X<br />
C7 Alumni/ae relation X<br />
C7 Geographical residence X<br />
C7 State residency X<br />
C7 Religious<br />
affiliation/commitment<br />
X<br />
C7 Racial/ethnic status X<br />
C7 Volunteer work X<br />
C7 Work experience X<br />
C7 Level of applicant’s interest X<br />
C8<br />
SAT and ACT Policies<br />
Entrance exams<br />
Yes<br />
No<br />
CDS-C complete Page 2
Common Data Set 2011-2012<br />
C8A Does your institution make use of SAT, ACT, or SAT Subject Test<br />
scores in admission decisions for first-time, first-year, degree-seeking X<br />
applicants?<br />
C8A If yes, place check marks in the appropriate boxes below to reflect your institution’s policies for use in<br />
admission for Fall 2013.<br />
C8A<br />
C8A Require Recommend<br />
ADMISSION<br />
Require for Some Consider if<br />
Submitted<br />
C8A SAT or ACT<br />
X<br />
C8A ACT only<br />
C8A SAT only<br />
C8A SAT and SAT Subject Tests or<br />
ACT<br />
C8A SAT Subject Tests only<br />
Not Used<br />
C8B If your institution will make use of the ACT in admission decisions for first-time, first-year, degree-seeking applicants<br />
for Fall 2013, please indicate which ONE of the following applies: (regardless of whether the writing score will be used<br />
in the admissions process):<br />
C8B ACT with Writing Component required<br />
C8B<br />
C8B<br />
C8C Please indicate how your institution will use the SAT or ACT writing component; check all that apply:<br />
C8C SAT essay ACT essay<br />
C8C For admission<br />
C8C For placement<br />
C8C For advising<br />
C8C In place of an application essay<br />
C8C As a validity check on the<br />
application essay<br />
C8C No college policy as of now<br />
C8C Not using essay component X X<br />
C8D In addition, does your institution use applicants' test scores for academic advising?<br />
C8D Yes No<br />
X<br />
C8E<br />
C8E<br />
ACT with Writing component recommended<br />
ACT with or without Writing component accepted<br />
Latest date by which SAT or ACT scores must be received for fall-<br />
Latest date by which SAT Subject Test scores must be received for<br />
fall-term admission<br />
X<br />
C8F<br />
C8F<br />
If necessary, use this space to clarify your test policies (e.g., if tests are recommended for some students,<br />
C8G Please indicate which tests your institution uses for placement (e.g., state tests):<br />
C8G SAT<br />
C8G ACT<br />
C8G SAT Subject Tests<br />
C8G AP<br />
C8G CLEP<br />
C8G Institutional Exam<br />
C8G State Exam (specify):<br />
CDS-C complete Page 3
Common Data Set 2011-2012<br />
Freshman Profile<br />
Provide percentages for ALL enrolled, degree-seeking, full-time and part-time, first-time, first-year<br />
(freshman) students enrolled in Fall 2011, including students who began studies during summer,<br />
international students/nonresident aliens, and students admitted under special arrangements.<br />
C9<br />
Percent and number of first-time, first-year (freshman) students enrolled in Fall 2011 who<br />
submitted national standardized (SAT/ACT) test scores. Include information for ALL enrolled,<br />
degree-seeking, first-time, first-year (freshman) students who submitted test scores. Do not<br />
include partial test scores (e.g., mathematics scores but not critical reading for a category of<br />
students) or combine other standardized test results (such as TOEFL) in this item. Do not convert<br />
SAT scores to ACT scores and vice versa. The 25th percentile is the score that 25 percent scored<br />
at or below; the 75th percentile score is the one that 25 percent scored at or above.<br />
C9 Percent submitting SAT scores 87% Number submitting SAT scores<br />
634<br />
C9 Percent submitting ACT scores 36% Number submitting ACT scores<br />
263<br />
C9 25th Percentile 75th Percentile<br />
C9 SAT Critical Reading 490 620<br />
C9 SAT Math 480 600<br />
SAT Writing 480 600<br />
SAT Essay<br />
C9 ACT Composite 21 27<br />
C9 ACT Math 21 27<br />
C9 ACT English 21 28<br />
C9 ACT Writing<br />
C9<br />
C9<br />
Percent of first-time, first-year (freshman) students with scores in each range:<br />
SAT Critical<br />
Reading SAT Math SAT Writing<br />
C9 700-800 5.40% 4.30% 2.50%<br />
C9 600-699 28.50% 25.40% 23.20%<br />
C9 500-599 39.40% 44.00% 41.50%<br />
C9 400-499 22.90% 24.90% 27.30%<br />
C9 300-399 3.80% 1.40% 5.50%<br />
C9 200-299<br />
Totals should = 100% 100.00% 100.00% 100.00%<br />
C9 ACT Composite ACT English ACT Math<br />
C9 30-36 10.60% 18.30% 10.30%<br />
C9 24-29 48.30% 38.50% 45.00%<br />
C9 18-23 36.90% 35.10% 35.50%<br />
C9 12-17 4.20% 6.90% 9.20%<br />
C9 6-11 1.20%<br />
C9 Below 6<br />
Totals should = 100% 100.00% 100.00% 100.00%<br />
C10 Percent of all degree-seeking, first-time, first-year (freshman) students who had high school class rank<br />
within each of the following ranges (report information for those students from whom you collected high<br />
school rank information).<br />
C10 Percent in top tenth of high school graduating class<br />
33%<br />
C10 Percent in top quarter of high school graduating class<br />
67%<br />
C10 Percent in top half of high school graduating class<br />
91% Top half +<br />
C10 Percent in bottom half of high school graduating class<br />
9% bottom half = 100%<br />
C10 Percent in bottom quarter of high school graduating class<br />
1%<br />
CDS-C complete Page 4
Common Data Set 2011-2012<br />
C10<br />
Percent of total first-time, first-year (freshmen) students who submitted high school<br />
class rank:<br />
27%<br />
C11 Percentage of all enrolled, degree-seeking, first-time, first-year (freshman) students who had high school<br />
grade-point averages within each of the following ranges (using 4.0 scale). Report information only for<br />
those students from whom you collected high school GPA.<br />
C11 Percent who had GPA of 3.75 and higher<br />
46.40%<br />
C11 Percent who had GPA between 3.50 and 3.74<br />
23.70%<br />
C11 Percent who had GPA between 3.25 and 3.49<br />
11.80%<br />
C11 Percent who had GPA between 3.00 and 3.24<br />
9.50%<br />
C11 Percent who had GPA between 2.50 and 2.99<br />
7.50%<br />
C11 Percent who had GPA between 2.0 and 2.49<br />
1.10%<br />
C11<br />
C11<br />
Percent who had GPA between 1.0 and 1.99<br />
Percent who had GPA below 1.0<br />
Totals should = 100%<br />
100.00%<br />
C12<br />
C12<br />
Average high school GPA of all degree-seeking, first-time, first-year<br />
(freshman) students who submitted GPA:<br />
Percent of total first-time, first-year (freshman) students who<br />
submitted high school GPA:<br />
3.62<br />
99.30%<br />
Admission Policies<br />
C13 Application Fee<br />
C13 Yes No<br />
C13 Does your institution have an<br />
X<br />
application fee?<br />
C13 Amount of application fee: $40.00<br />
C13 Yes No<br />
C13 Can it be waived for applicants<br />
with financial need?<br />
C13 If you have an application fee and an on-line application option,<br />
C13 Same fee:<br />
X<br />
C13 Free:<br />
C13 Reduced:<br />
X<br />
C13 Yes No<br />
C13 Can on-line application fee be<br />
waived for applicants with<br />
financial need?<br />
X<br />
C14 Application closing date<br />
C14 Yes No<br />
C14 Does your institution have an<br />
application closing date?<br />
X<br />
C14 Application closing date (fall):<br />
C14 Priority date: 2/1<br />
C15 Yes No<br />
C15 Are first-time, first-year students accepted for terms other than X<br />
C16 Notification to applicants of admission decision sent (fill in one only)<br />
CDS-C complete Page 5
Common Data Set 2011-2012<br />
C16 On a rolling basis beginning<br />
(date):<br />
C16 By (date):<br />
C16 Other:<br />
1-Oct<br />
C17 Reply policy for admitted applicants (fill in one only)<br />
C17 Must reply by (date):<br />
C17 No set date:<br />
C17 Must reply by May 1 or within<br />
_____ weeks if notified<br />
2<br />
thereafter<br />
C17 Other:<br />
C17<br />
C17<br />
C17<br />
C17<br />
C17<br />
C17<br />
Deadline for housing deposit (MM/DD):<br />
Amount of housing deposit:<br />
Refundable if student does not enroll?<br />
Yes, in full<br />
Yes, in part<br />
No<br />
NA<br />
NA<br />
C18 Deferred admission<br />
C18 Yes No<br />
C18 Does your institution allow students to postpone enrollment after<br />
admission?<br />
X<br />
C18<br />
If yes, maximum period of postponement:<br />
C19 Early admission of high school students<br />
C19 Yes No<br />
C19 Does your institution allow high school students to enroll as full-time,<br />
first-time, first-year (freshman) students one year or more before high<br />
school graduation?<br />
X<br />
C20 Common Application<br />
Question removed from CDS.<br />
(Initiated during 2006-2007 cycle)<br />
Early Decision and Early Action Plans<br />
C21 Early Decision<br />
C21 Yes No<br />
C21 Does your institution offer an early decision plan (an admission plan<br />
that permits students to apply and be notified of an admission<br />
decision well in advance of the regular notification date and that asks<br />
X<br />
students to commit to attending if accepted) for first-time, first-year<br />
(freshman) applicants for fall enrollment?<br />
C21<br />
C21<br />
C21<br />
C21<br />
C21<br />
C21<br />
C21<br />
C21<br />
C21<br />
If “yes,” please complete the following:<br />
First or only early decision plan closing date<br />
First or only early decision plan notification date<br />
Other early decision plan closing date<br />
Other early decision plan notification date<br />
For the Fall 2011 entering class:<br />
Number of early decision applications received by your institution<br />
Number of applicants admitted under early decision plan<br />
Please provide significant details about your early decision plan:<br />
CDS-C complete Page 6
Common Data Set 2011-2012<br />
C22 Early action<br />
C22 Yes No<br />
C22 Do you have a nonbinding early action plan whereby students are<br />
notified of an admission decision well in advance of the regular<br />
notification date but do not have to commit to attending your college?<br />
X<br />
C22<br />
C22<br />
C22<br />
If “yes,” please complete the following:<br />
Early action closing date<br />
Early action notification date<br />
C22 Is your early action plan a “restrictive” plan under which you limit students from applying to other early plans?<br />
C22 Yes No<br />
C22<br />
CDS-C complete Page 7
Common Data Set 2011-2012<br />
Fall Applicants<br />
D1 Yes No<br />
D1 Does your institution enroll transfer students? (If no,<br />
please skip to Section E)<br />
X<br />
D1 If yes, may transfer students earn advanced standing credit<br />
by transferring credits earned from course work completed X<br />
at other colleges/universities?<br />
D2<br />
D2<br />
Admitted Enrolled<br />
Applicants<br />
Applicants Applicants<br />
D2 Men 314 185 80<br />
D2 Women 623 368 132<br />
D2 Total 937 553 212<br />
D3 Indicate terms for which transfers may enroll:<br />
D3 Fall X<br />
D3 Winter<br />
D3 Spring X<br />
D3 Summer<br />
D4 Yes No<br />
D4 Must a transfer applicant have a minimum number of<br />
credits completed or else must apply as an entering<br />
X<br />
freshman?<br />
D4<br />
D. TRANSFER ADMISSION<br />
Provide the number of students who applied, were admitted, and enrolled as degree-seeking transfer<br />
students in Fall 2011.<br />
Application for Admission<br />
If yes, what is the minimum number of credits and the unit<br />
of measure?<br />
D5<br />
D5<br />
Indicate all items required of transfer students to apply for admission:<br />
Recommended Recommended<br />
Required of All<br />
of All<br />
of Some<br />
Required of Some<br />
D5 High school transcript X<br />
D5 College transcript(s) X<br />
D5 Essay or personal<br />
statement<br />
X<br />
D5 Interview X<br />
D5 Standardized test scores X<br />
D5 Statement of good standing<br />
from prior institution(s)<br />
X<br />
Not Required<br />
D6<br />
D7<br />
If a minimum high school grade point average is required of<br />
transfer applicants, specify (on a 4.0 scale):<br />
If a minimum college grade point average is required of<br />
transfer applicants, specify (on a 4.0 scale):<br />
2.50<br />
CDS-D complete Page 1
Common Data Set 2011-2012<br />
D8<br />
List any other application requirements specific to transfer applicants:<br />
D9<br />
List application priority, closing, notification, and candidate reply dates for transfer students. If applications<br />
are reviewed on a continuous or rolling basis, place a check mark in the “Rolling admission” column.<br />
D9 Priority Date Closing Date Notification Date Reply Date<br />
Rolling<br />
Admission<br />
D9 Fall X<br />
D9 Winter<br />
D9 Spring X<br />
D9 Summer<br />
D10 Yes No<br />
D10 Does an open admission policy, if reported, apply to<br />
transfer students?<br />
D11<br />
Describe additional requirements for transfer admission, if applicable:<br />
D12<br />
Transfer Credit Policies<br />
Report the lowest grade earned for any course that may be<br />
transferred for credit:<br />
1.50<br />
D13 Number Unit Type<br />
D13 Maximum number of credits or courses that may be<br />
transferred from a two-year institution:<br />
64 Semester<br />
D14 Number Unit Type<br />
D14 Maximum number of credits or courses that may be<br />
transferred from a four-year institution:<br />
96 Semester<br />
D15<br />
D16<br />
D17<br />
Minimum number of credits that transfers must complete at<br />
your institution to earn an associate degree:<br />
Minimum number of credits that transfers must complete at<br />
your institution to earn a bachelor’s degree:<br />
Describe other transfer credit policies:<br />
32<br />
CDS-D complete Page 2
Common Data Set 2011-2012<br />
E. ACADEMIC OFFERINGS AND POLICIES<br />
Special study options: Identify those programs available at your institution. Refer to the glossary<br />
E1<br />
for definitions.<br />
E1 Accelerated program<br />
E1 Cooperative education program Y<br />
E1 Cross-registration Y<br />
E1 Distance learning<br />
E1 Double major Y<br />
E1 Dual enrollment Y<br />
E1 English as a Second Language (ESL) Y<br />
E1 Exchange student program (domestic) Y<br />
E1 External degree program<br />
E1 Honors Program Y<br />
E1 Independent study Y<br />
E1 Internships Y<br />
E1 Liberal arts/career combination Y<br />
E1 Student-designed major Y<br />
E1 Study abroad Y<br />
E1 Teacher certification program Y<br />
E1 Weekend college<br />
E1 Other (specify):<br />
E2<br />
This question has been removed from the Common Data Set.<br />
E3 Areas in which all or most students are required to complete some course<br />
work prior to graduation:<br />
E3 Arts/fine arts Y<br />
E3 Computer literacy<br />
E3 English (including composition) Y<br />
E3 Foreign languages Y<br />
E3 History Y<br />
E3 Humanities Y<br />
E3 Mathematics Y<br />
E3 Philosophy Y<br />
E3 Sciences (biological or physical) Y<br />
E3 Social science Y<br />
E3 Other (describe):<br />
Library Collections: The CDS Publishers will collect library data again<br />
when a new Academic Libraries Survey is in place.<br />
CDS-E complete Page 1
Common Data Set 2011-2012<br />
F1<br />
F. STUDENT LIFE<br />
Percentages of first-time, first-year (freshman) degree-seeking students and degree-seeking<br />
undergraduates enrolled in Fall 2011 who fit the following categories:<br />
F1<br />
First-time, first-year<br />
(freshman) Undergraduates<br />
students<br />
F1 Percent who are from out of state (exclude<br />
international/nonresident aliens from the numerator<br />
and denominator)<br />
24% 23%<br />
F1 Percent of men who join fraternities<br />
0% 0%<br />
F1 Percent of women who join sororities<br />
0% 0%<br />
F1 Percent who live in college-owned, -operated, or -<br />
affiliated housing<br />
85% 48%<br />
F1 Percent who live off campus or commute<br />
15% 52%<br />
F1 Percent of students age 25 and older<br />
0% 9%<br />
F1 Average age of full-time students<br />
18 21<br />
F1 Average age of all students (full- and part-time)<br />
18 21<br />
F2 Activities offered Identify those programs available at your institution.<br />
F2 Campus Ministries Y<br />
F2 Choral groups Y<br />
F2 Concert band Y<br />
F2 Dance Y<br />
F2 Drama/theater Y<br />
F2 International Student<br />
Organization<br />
Y<br />
F2 Jazz band Y<br />
F2 Literary magazine Y<br />
F2 Marching band N<br />
F2 Model UN N<br />
F2 Music ensembles Y<br />
F2 Musical theater Y<br />
F2 Opera Y<br />
F2 Pep band Y<br />
F2 Radio station Y<br />
F2 Student government Y<br />
F2 Student newspaper Y<br />
F2 Student-run film society Y<br />
F2 Symphony orchestra Y<br />
F2 Television station Y<br />
F2 Yearbook N<br />
F3<br />
F3<br />
F3<br />
F3<br />
F3<br />
ROTC (program offered in cooperation with Reserve Officers' Training Corps)<br />
At Cooperating<br />
On Campus<br />
Institution<br />
Army ROTC is offered:<br />
YES<br />
Naval ROTC is offered:<br />
Air Force ROTC is offered:<br />
Name of Cooperating<br />
Institution<br />
CDS-F complete Page 1
Common Data Set 2011-2012<br />
F4 Housing: Check all types of college-owned, -operated, or -affiliated housing available for<br />
undergraduates at your institution.<br />
F4 Coed dorms Y<br />
F4 Men's dorms N<br />
F4 Women's dorms Y<br />
F4 Apartments for married students<br />
Y<br />
F4 Apartments for single students Y<br />
F4 Special housing for disabled<br />
Y<br />
students<br />
F4 Special housing for international<br />
students<br />
N<br />
F4 Fraternity/sorority housing N<br />
F4 Cooperative housing N<br />
F4 Theme housing Y<br />
F4 Wellness housing N<br />
F4 Other housing options (specify):<br />
CDS-F complete Page 2
Common Data Set 2011-2012<br />
G. ANNUAL EXPENSES<br />
G0<br />
Please provide the URL of your institution’s net price calculator:<br />
Provide 2012-2013 academic year costs of attendance for the following categories that are<br />
applicable to your institution.<br />
x<br />
G1<br />
Check here if your institution's 2012-2013 academic year costs of attendance are not available at this time<br />
and provide an approximate date (i.e., month/day) when your institution's final 2012-2013 academic year<br />
costs of attendance will be available:<br />
Feb-12<br />
Undergraduate full-time tuition, required fees, room and board List the typical tuition, required<br />
fees, and room and board for a full-time undergraduate student for the FULL 2012-2013 academic<br />
year (30 semester or 45 quarter hours for institutions that derive annual tuition by multiplying<br />
credit hour cost by number of credits). A full academic year refers to the period of time generally<br />
extending from September to June; usually equated to two semesters, two trimesters, three<br />
quarters, or the period covered by a four-one-four plan. Room and board is defined as double<br />
occupancy and 19 meals per week or the maximum meal plan. Required fees include only charges<br />
that all full-time students must pay that are not included in tuition (e.g., registration, health, or<br />
activity fees.) Do not include optional fees (e.g., parking, laboratory use).<br />
G1 First-Year Undergraduates<br />
G1 PRIVATE INSTITUTIONS<br />
Tuition: $30,950 $30,950<br />
G1 PUBLIC INSTITUTIONS<br />
Tuition:<br />
In-district<br />
G1 PUBLIC INSTITUTIONS<br />
In-state (out-of-district):<br />
G1 PUBLIC INSTITUTIONS<br />
Out-of-state:<br />
G1 NONRESIDENT ALIENS<br />
Tuition:<br />
G1 REQUIRED FEES: $0 $0<br />
G1<br />
G1<br />
G1<br />
G1<br />
G1<br />
ROOM AND BOARD:<br />
(on-campus) $9,250 $9,250<br />
ROOM ONLY:<br />
(on-campus) $4,460 $4,460<br />
BOARD ONLY:<br />
(on-campus meal plan) $4,790 $4,790<br />
Comprehensive tuition and room and board fee (if your<br />
college cannot provide separate tuition and room and<br />
board fees):<br />
Other:<br />
CDS-G complete Page 1
Common Data Set 2011-2012<br />
G2 Minimum Maximum<br />
G2 Number of credits per term a student can take for the<br />
stated full-time tuition<br />
12 17<br />
G3 Yes No<br />
G3 Do tuition and fees vary by year of study (e.g., sophomore,<br />
junior, senior)?<br />
X<br />
G4 Yes No<br />
G4 Do tuition and fees vary by undergraduate instructional<br />
program?<br />
X<br />
G4<br />
%<br />
G4<br />
If yes, what percentage of full-time undergraduates pay<br />
more than the tuition and fees reported in G1?<br />
G5<br />
Provide the estimated expenses for a typical full-time undergraduate student:<br />
G5<br />
Commuters<br />
Commuters<br />
Residents<br />
(living at home) (not living at home)<br />
G5 Books and supplies $972 $972 $972<br />
G5 Room only<br />
G5 Board only<br />
G5 Room and board total (if your<br />
college cannot provide separate<br />
room and board figures for<br />
commuters not living at home): $9,250<br />
G5 Transportation $648 $1,272 $1,224<br />
G5 Other expenses $1,704 $1,530 $1,704<br />
G6<br />
G6<br />
G6<br />
G6<br />
G6<br />
G6<br />
Undergraduate per-credit-hour charges (tuition only)<br />
PRIVATE INSTITUTIONS:<br />
$970.00<br />
PUBLIC INSTITUTIONS<br />
In-district:<br />
PUBLIC INSTITUTIONS<br />
In-state (out-of-district):<br />
PUBLIC INSTITUTIONS<br />
Out-of-state:<br />
NONRESIDENT ALIENS:<br />
CDS-G complete Page 2
Common Data Set 2011-2012<br />
H. FINANCIAL AID<br />
Aid Awarded to Enrolled Undergraduates<br />
Enter total dollar amounts awarded to enrolled full-time and less than full-time degree-seeking<br />
undergraduates (using the same cohort reported in CDS Question B1, “total degree-seeking”<br />
undergraduates) in the following categories. (Note: If the data being reported are final figures for the 2010-<br />
2011 academic year (see the next item below), use the 2010-2011 academic year's CDS Question B1<br />
cohort.) Include aid awarded to international students (i.e., those not qualifying for federal aid). Aid that is<br />
non-need-based but that was used to meet need should be reported in the need-based aid columns. (For a<br />
suggested order of precedence in assigning categories of aid to cover need, see the entry for “non-needbased<br />
scholarship or grant aid” on the last page of the definitions section.)<br />
H1 2011-2012<br />
estimated<br />
H1 Indicate the academic year for which data are reported for items H1,<br />
X<br />
H2, H2A, and H6 below:<br />
2010-2011<br />
final<br />
H3<br />
H3<br />
H3<br />
H3<br />
Which needs-analysis methodology does your institution use in awarding institutional aid?<br />
Federal methodology (FM)<br />
X<br />
Institutional methodology (IM)<br />
Both FM and IM<br />
H1<br />
Need-based $<br />
(Include non-needbased<br />
aid used to<br />
meet need.)<br />
Non-needbased<br />
$<br />
(Exclude non-needbased<br />
aid used to<br />
meet need.)<br />
H1<br />
H1<br />
Scholarships/Grants<br />
Federal<br />
$4,171,903 $0<br />
H1 State (i.e., all states, not only the state in which your institution is<br />
located)<br />
$3,205,465 $44,490<br />
H1 Institutional: Endowed scholarships, annual gifts and tuition funded<br />
grants, awarded by the college, excluding athletic aid and tuition<br />
waivers (which are reported below).<br />
$30,113,775 $10,948,417<br />
H1 Scholarships/grants from external sources (e.g., Kiwanis, National<br />
Merit) not awarded by the college<br />
$954,583 $1,716,057<br />
H1 Total Scholarships/Grants<br />
$38,445,726 $12,708,964<br />
H1<br />
H1<br />
Self-Help<br />
Student loans from all sources (excluding parent loans)<br />
$14,016,799 $3,886,808<br />
H1 Federal Work-Study<br />
$1,435,703<br />
H1 State and other (e.g., institutional) work-study/employment (Note:<br />
Excludes Federal Work-Study captured above.)<br />
$455,223 $1,494,096<br />
H1 Total Self-Help<br />
$15,907,725 $5,380,904<br />
H1<br />
H1<br />
Other<br />
Parent Loans<br />
$2,917,375 $4,792,824<br />
H1 Tuition Waivers<br />
Reporting is optional. Report tuition waivers in this row if you choose to report them. Do<br />
not report tuition waivers elsewhere.<br />
H1<br />
Athletic Awards<br />
CDS-H complete Page 1
Common Data Set 2011-2012<br />
H2<br />
Number of Enrolled Students Awarded Aid: List the number of degree-seeking full-time and less-thanfull-time<br />
undergraduates who applied for and were awarded financial aid from any source. Aid that is nonneed-based<br />
but that was used to meet need should be counted as need-based aid. Numbers should<br />
reflect the cohort awarded the dollars reported in H1. Note: In the chart below, students may be counted in<br />
more than one row, and full-time freshmen should also be counted as full-time undergraduates.<br />
H2<br />
H2<br />
First-time<br />
Full-time<br />
Freshmen<br />
Full-time<br />
Undergraduate<br />
(Incl. Fresh.)<br />
Less Than<br />
Full-time<br />
Undergraduate<br />
a) Number of degree-seeking undergraduate students<br />
(CDS Item B1 if reporting on Fall 2011 cohort) 731 3030 103<br />
H2 b) Number of students in line a who applied for needbased<br />
financial aid<br />
H2 c) Number of students in line b who were determined to<br />
have financial need<br />
H2 d) Number of students in line c who were awarded any<br />
financial aid<br />
H2 e) Number of students in line d who were awarded any<br />
need-based scholarship or grant aid<br />
H2 f) Number of students in line d who were awarded any<br />
need-based self-help aid<br />
H2 g) Number of students in line d who were awarded any<br />
non-need-based scholarship or grant aid<br />
H2 h) Number of students in line d whose need was fully met<br />
(exclude PLUS loans, unsubsidized loans, and private<br />
alternative loans)<br />
H2 i) On average, the percentage of need that was met of<br />
students who were awarded any need-based aid.<br />
Exclude any aid that was awarded in excess of need as<br />
well as any resources that were awarded to replace<br />
EFC (PLUS loans, unsubsidized loans, and private<br />
alternative loans)<br />
H2 j) The average financial aid package of those in line d.<br />
Exclude any resources that were awarded to replace<br />
EFC (PLUS loans, unsubsidized loans, and private<br />
alternative loans)<br />
H2 Average need-based scholarship and grant award of<br />
k)<br />
those in line e<br />
H2 l) Average need-based self-help award (excluding PLUS<br />
loans, unsubsidized loans, and private alternative<br />
loans) of those in line f<br />
H2 m) Average need-based loan (excluding PLUS loans,<br />
unsubsidized loans, and private alternative loans) of<br />
those in line f who were awarded a need-based loan<br />
683 2576 53<br />
587 2278 49<br />
587 2264 44<br />
585 2232 27<br />
534 2015 38<br />
461 1800 13<br />
154 515 6<br />
89.6% 85.5% 64.7%<br />
$ 30,889 $ 29,814 $ 15,670<br />
$ 19,337 $ 17,506 $ 8,222<br />
$ 8,558 $ 10,389 $ 9,956<br />
$ 6,862 $ 8,856 $ 9,343<br />
CDS-H complete Page 2
Common Data Set 2011-2012<br />
H2A<br />
Number of Enrolled Students Awarded Non-need-based Scholarships and Grants: List the number of<br />
degree-seeking full-time and less-than-full-time undergraduates who had no financial need and who were<br />
awarded institutional non-need-based scholarship or grant aid. Numbers should reflect the cohort awarded<br />
the dollars reported in H1. Note: In the chart below, students may be counted in more than one row, and<br />
full-time freshmen should also be counted as full-time undergraduates.<br />
H2A<br />
H2A n) Number of students in line a who had no financial need<br />
and who were awarded institutional non-need-based<br />
scholarship or grant aid (exclude those who were<br />
awarded athletic awards and tuition benefits)<br />
First-time<br />
Full-time<br />
Freshmen<br />
Full-time<br />
Undergrad<br />
(Incl. Fresh.)<br />
Less Than<br />
Full-time<br />
Undergrad<br />
136 670 5<br />
H2A o) Average dollar amount of institutional non-need-based<br />
scholarship and grant aid awarded to students in line n $ 15,395 $ 13,580 $ 4,670<br />
H2A p) Number of students in line a who were awarded an<br />
institutional non-need-based athletic scholarship or<br />
grant<br />
H2A q) Average dollar amount of institutional non-need-based<br />
athletic scholarships and grants awarded to students in<br />
line p<br />
H3<br />
Incorporated into H1 above.<br />
Note: These are the graduates and loan types to include and exclude in order to fill out CDS H4, H4a,<br />
H5, and H5a.<br />
Include: * 2011 undergraduate class who<br />
graduated between July 1, 2098 and June 30,<br />
2011 who started at your institution as first- time<br />
students and received a bachelor's degree<br />
between July 1, 2010 and June 30, 2011.<br />
* only loans made to students who borrowed<br />
while enrolled at your institution.<br />
* co-signed loans.<br />
Exclude: * those who transferred in.<br />
* money borrowed at other institutions.<br />
H4<br />
H4a<br />
H5<br />
Provide the percentage of the class (defined above) who borrowed at any time through<br />
any loan programs (institutional, state, Federal Perkins, Federal Stafford Subsidized and<br />
Unsubsidized, private loans that were certified by your institution, etc.; exclude parent<br />
loans). Include both Federal Direct Student Loans and Federal Family Education Loans.<br />
Provide the percentage of the class (defined above) who borrowed at any time through<br />
federal loan programs--Federal Perkins, Federal Stafford Subsidized and Unsubsidized.<br />
Include both Federal Direct Student Loans and Federal Family Education Loans. NOTE:<br />
exclude all institutional, state, private alternative loans and parent loans.<br />
Report the average per-undergraduate-borrower cumulative principal borrowed of those<br />
in line H4.<br />
72%<br />
71%<br />
$29,774<br />
CDS-H complete Page 3
Common Data Set 2011-2012<br />
H5a<br />
Report the average per-undergraduate-borrower cumulative principal borrowed, of those<br />
in H4a, through federal loan programs--Federal Perkins, Federal Stafford Subsidized and<br />
Unsubsidized. Include both Federal Direct Student Loans and Federal Family Education<br />
Loans. These are listed in line H4a. NOTE: exclude all institutional, state, private<br />
alternative loans and exclude parent loans.<br />
$23,729<br />
Aid to Undergraduate Degree-seeking Nonresident Aliens (Note: Report numbers and<br />
dollar amounts for the same academic year checked in item H1.)<br />
H6<br />
H6<br />
H6<br />
H6<br />
Indicate your institution’s policy regarding institutional scholarship and grant aid for undergraduate degreeseeking<br />
nonresident aliens:<br />
Institutional need-based scholarship or grant aid is available<br />
Institutional non-need-based scholarship or grant aid is available<br />
X<br />
Institutional scholarship or grant aid is not available<br />
H6<br />
H6<br />
H6<br />
If institutional financial aid is available for undergraduate degree-seeking nonresident<br />
aliens, provide the number of undergraduate degree-seeking nonresident aliens who<br />
were awarded need-based or non-need-based aid:<br />
Average dollar amount of institutional financial aid awarded to undergraduate degreeseeking<br />
nonresident aliens:<br />
Total dollar amount of institutional financial aid awarded to undergraduate degreeseeking<br />
nonresident aliens:<br />
110<br />
$9,912<br />
$1,090,358<br />
H7<br />
H7<br />
H7<br />
H7<br />
H7<br />
H7<br />
Check off all financial aid forms nonresident alien first-year financial aid applicants must submit:<br />
Institution’s own financial aid form<br />
CSS/Financial Aid PROFILE<br />
International Student’s Financial Aid Application<br />
International Student’s Certification of Finances<br />
X<br />
Other (specify):<br />
Process for First-Year/Freshman Students<br />
H8<br />
H8<br />
H8<br />
H8<br />
H8<br />
H8<br />
H8<br />
H8<br />
Check off all financial aid forms domestic first-year (freshman) financial aid applicants must submit:<br />
FAFSA<br />
X<br />
Institution's own financial aid form<br />
CSS/Financial Aid PROFILE<br />
State aid form<br />
Noncustodial PROFILE<br />
Business/Farm Supplement<br />
Other (specify):<br />
H9<br />
H9<br />
H9<br />
H9<br />
Indicate filing dates for first-year (freshman) students:<br />
Priority date for filing required financial aid forms:<br />
Deadline for filing required financial aid forms:<br />
No deadline for filing required forms (applications processed on a<br />
rolling basis):<br />
January 31st<br />
CDS-H complete Page 4
Common Data Set 2011-2012<br />
H10 Indicate notification dates for first-year (freshman) students (answer a or b):<br />
H10 a) Students notified on or about (date):<br />
H10 Yes No<br />
H10 b) Students notified on a rolling basis: X<br />
H10 If yes, starting date: March 1st<br />
H11<br />
H11<br />
H11<br />
Indicate reply dates:<br />
Students must reply by (date):<br />
or within ___3____ weeks of notification.<br />
May 1st<br />
Types of Aid Available<br />
Please check off all types of aid available to undergraduates at your institution:<br />
H12 Loans<br />
H12 FEDERAL DIRECT STUDENT LOAN PROGRAM (DIRECT LOAN)<br />
H12 Direct Subsidized Stafford Loans<br />
H12 Direct Unsubsidized Stafford Loans<br />
H12 Direct PLUS Loans<br />
H12 Federal Perkins Loans<br />
H12 Federal Nursing Loans<br />
H12 State Loans<br />
H12 College/university loans from institutional funds<br />
H12 Other (specify):<br />
X<br />
X<br />
X<br />
X<br />
X<br />
X<br />
H13<br />
H13<br />
H13<br />
H13<br />
H13<br />
H13<br />
H13<br />
H13<br />
H13<br />
H13<br />
Scholarships and Grants<br />
NEED-BASED:<br />
Federal Pell<br />
SEOG<br />
State scholarships/grants<br />
Private scholarships<br />
College/university scholarship or grant aid from institutional funds<br />
United Negro College Fund<br />
Federal Nursing Scholarship<br />
Other (specify):<br />
X<br />
X<br />
X<br />
X<br />
X<br />
X<br />
H14<br />
H14<br />
Check off criteria used in awarding institutional aid. Check all that apply.<br />
Non-Need Based Need-Based<br />
H14 Academics<br />
X X<br />
H14 Alumni affiliation<br />
X<br />
H14 Art<br />
X<br />
H14<br />
H14<br />
H14<br />
Athletics<br />
Job skills<br />
ROTC<br />
X<br />
H14 Leadership<br />
X<br />
H14<br />
H14<br />
Minority status<br />
Music/drama<br />
X<br />
H14 Religious affiliation<br />
X<br />
H14 State/district residency<br />
CDS-H complete Page 5
Common Data Set 2011-2012<br />
H15<br />
If your institution has recently implemented any major financial aid policy, program, or initiative<br />
to make your institution more affordable to incoming students such as replacing loans with grants,<br />
or waiving costs for families below a certain income level please provide details below:<br />
CDS-H complete Page 6
Common Data Set 2011-2012<br />
I. INSTRUCTIONAL FACULTY AND CLASS SIZE<br />
I1<br />
Please report the number of instructional faculty members in each category for Fall 2011. Include<br />
faculty who are on your institution’s payroll on the census date your institution uses for<br />
IPEDS/AAUP.<br />
The following definition of full-time instructional faculty is used by the American Association of <strong>University</strong> Professors<br />
(AAUP) in its annual Faculty Compensation Survey (the part time definitions are not used by AAUP). Instructional<br />
Faculty is defined as those members of the instructional-research staff whose major regular assignment is instruction,<br />
including those with released time for research. Use the chart below to determine inclusions and exclusions:<br />
(a) instructional faculty in preclinical and clinical medicine, faculty who are not paid (e.g.,<br />
those who donate their services or are in the military), or research-only faculty, postdoctoral<br />
fellows, or pre-doctoral fellows<br />
Full-time<br />
Exclude<br />
Part-time<br />
Include only if<br />
they teach one<br />
or more nonclinical<br />
credit<br />
courses<br />
(b) administrative officers with titles such as dean of students, librarian, registrar, coach,<br />
and the like, even though they may devote part of their time to classroom instruction and<br />
may have faculty status<br />
(c) other administrators/staff who teach one or more non-clinical credit courses even<br />
though they do not have faculty status<br />
(d) undergraduate or graduate students who assist in the instruction of courses, but<br />
have titles such as teaching assistant, teaching fellow, and the like<br />
(e) faculty on sabbatical or leave with pay<br />
(f) faculty on leave without pay<br />
(g) replacement faculty for faculty on sabbatical leave or leave with pay<br />
Exclude<br />
Exclude<br />
Exclude<br />
Include<br />
Exclude<br />
Exclude<br />
Include if they<br />
teach one or<br />
more nonclinical<br />
credit<br />
courses<br />
Include<br />
Exclude<br />
Exclude<br />
Exclude<br />
Include<br />
Full-time instructional faculty: faculty employed on a full-time basis for instruction (including those with released time<br />
for research)<br />
Part-time instructional faculty: Adjuncts and other instructors being paid solely for part-time classroom instruction.<br />
Also includes full-time faculty teaching less than two semesters, three quarters, two trimesters, or two four-month<br />
sessions. Employees who are not considered full-time instructional faculty but who teach one or more non-clinical<br />
credit courses may be counted as part-time faculty.<br />
Minority faculty: includes faculty who designate themselves as Black, non-Hispanic; American Indian or Alaska<br />
Native; Asian, Native Hawaiian or other <strong>Pacific</strong> Islander, or Hispanic.<br />
Doctorate: includes such degrees as Doctor of Philosophy, Doctor of Education, Doctor of Juridical Science, and<br />
Doctor of Public Health in any field such as arts, sciences, education, engineering, business, and public<br />
administration. Also includes terminal degrees formerly designated as “first professional,” including dentistry (DDS or<br />
DMD), medicine (MD), optometry (OD), osteopathic medicine (DO), pharmacy (DPharm or BPharm), podiatric<br />
medicine (DPM), veterinary medicine (DVM), chiropractic (DC or DCM), or law (JD).<br />
Terminal degree: the highest degree in a field: example, M. Arch (architecture) and MFA (master of fine arts).<br />
I1 Full-Time Part-Time Total<br />
I1 a) Total number of instructional faculty<br />
205 46 251<br />
I1 b) Total number who are members of minority groups<br />
23 4 27<br />
I1 c) Total number who are women<br />
107 31 138<br />
I1 d) Total number who are men<br />
98 15 113<br />
I1 e) Total number who are nonresident aliens (international)<br />
5 0 5<br />
I1<br />
f) Total number with doctorate, or other terminal degree<br />
170 27 197<br />
CDS-I Complete Page 1
Common Data Set 2011-2012<br />
g) Total number whose highest degree is a master's but not a terminal<br />
I1 master's<br />
27 8 35<br />
I1 h) Total number whose highest degree is a bachelor's<br />
3 3 6<br />
Total number whose highest degree is unknown or other (Note:<br />
i)<br />
I1 Items f, g, h, and i must sum up to item a.)<br />
5 8 13<br />
Total number in stand-alone graduate/ professional programs in<br />
j)<br />
I1 which faculty teach virtually only graduate-level students<br />
0 0 0<br />
I2<br />
Student to Faculty Ratio<br />
Report the Fall 2011 ratio of full-time equivalent students (full-time plus 1/3 part time) to full-time equivalent<br />
instructional faculty (full time plus 1/3 part time). In the ratio calculations, exclude both faculty and students<br />
in stand-alone graduate or professional programs such as medicine, law, veterinary, dentistry, social work,<br />
business, or public health in which faculty teach virtually only graduate-level students. Do not count<br />
undergraduate or graduate student teaching assistants as faculty.<br />
I2 Fall 2011 Student to Faculty ratio<br />
15 to 1 (based on 3358 students<br />
and 226.67 faculty).<br />
I3 Undergraduate Class Size<br />
In the table below, please use the following definitions to report information about the size of classes and<br />
class sections offered in the Fall 2011 term.<br />
Class Sections: A class section is an organized course offered for credit, identified by discipline and<br />
number, meeting at a stated time or times in a classroom or similar setting, and not a subsection such as a<br />
laboratory or discussion session. Undergraduate class sections are defined as any sections in which at<br />
least one degree-seeking undergraduate student is enrolled for credit. Exclude distance learning classes<br />
and noncredit classes and individual instruction such as dissertation or thesis research, music instruction,<br />
or one-to-one readings. Exclude students in independent study, co-operative programs, internships, foreign<br />
language taped tutor sessions, practicums, and all students in one-on-one classes. Each class section<br />
should be counted only once and should not be duplicated because of course catalog cross-listings.<br />
Class Subsections: A class subsection includes any subsection of a course, such as laboratory,<br />
recitation, and discussion subsections that are supplementary in nature and are scheduled to meet<br />
separately from the lecture portion of the course. Undergraduate subsections are defined as any<br />
subsections of courses in which degree-seeking undergraduate students enrolled for credit. As above,<br />
exclude noncredit classes and individual instruction such as dissertation or thesis research, music<br />
instruction, or one-to-one readings. Each class subsection should be counted only once and should not be<br />
duplicated because of cross-listings.<br />
Using the above definitions, please report for each of the following class-size intervals the number of class<br />
sections and class subsections offered in Fall 2011. For example, a lecture class with 800 students who<br />
met at another time in 40 separate labs with 20 students should be counted once in the “100+” column in<br />
the class section column and 40 times under the “20-29” column of the class subsections table.<br />
I3<br />
Number of Class Sections with Undergraduates Enrolled<br />
I3<br />
Undergraduate Class Size (provide numbers)<br />
I3 CLASS 2-9 10-19 20-29 30-39 40-49 50-99 100+ Total<br />
I3 SECTIONS 80 219 193 75 26 12 2 607<br />
I3 CLASS SUB- 2-9 10-19 20-29 30-39 40-49 50-99 100+ Total<br />
I3 SECTIONS 30 65 25 1 0 1 2 124<br />
CDS-I Complete Page 2
Common Data Set 2011-2012<br />
J. DEGREES CONFERRED<br />
J1 Degrees conferred between July 1, 2010 and June 30, 2011<br />
J1 For each of the following discipline areas, provide the percentage of diplomas/certificates, associate, and bachelor’s degrees awarded. To<br />
determine the percentage, use majors, not headcount (e.g., students with one degree but a double major will be represented twice).<br />
Calculate the percentage from your institution’s IPEDS Completions by using the sum of 1st and 2nd majors for each CIP code as the<br />
numerator and the sum of the Grand Total by 1st Majors and the Grand Total by 2nd major as the denominator. If you prefer, you can<br />
compute the percentages using 1st majors only.<br />
J1 CIP 2010 Categories<br />
Category Diploma/Certificates Associate Bachelor’s<br />
to Include<br />
J1 Agriculture 0.00% 1<br />
J1 Natural resources and conservation 0.00% 3<br />
J1 Architecture 0.00% 4<br />
J1 Area, ethnic, and gender studies 1.90% 5<br />
J1 Communication/journalism 7.03% 9<br />
J1 Communication technologies 0.00% 10<br />
J1 Computer and information sciences 1.23% 11<br />
J1 Personal and culinary services 0.00% 12<br />
J1 Education 6.47% 13<br />
J1 Engineering 0.33% 14<br />
J1 Engineering technologies 0.00% 15<br />
J1 Foreign languages, literatures, and linguistics 4.24% 16<br />
J1 Family and consumer sciences 0.00% 19<br />
J1 Law/legal studies 0.00% 22<br />
J1 English 4.69% 23<br />
J1 Liberal arts/general studies 0.00% 24<br />
J1 Library science 0.00% 25<br />
J1 Biological/life sciences 5.25% 26<br />
J1 Mathematics and statistics 2.57% 27<br />
J1 Military science and military technologies 0.00% 28 & 29<br />
J1 Interdisciplinary studies 3.46% 30<br />
J1 Parks and recreation 3.35% 31<br />
J1 Philosophy and religious studies 2.46% 38<br />
J1 Theology and religious vocations 0.00% 39<br />
J1 Physical sciences 5.25% 40<br />
J1 Science technologies 0.00% 41<br />
J1 Psychology 6.03% 42<br />
J1 Homeland Security, law enforcement, firefighting, and<br />
0.00% 43<br />
protective services<br />
J1 Public administration and social services 1.79% 44<br />
J1 Social sciences 12.05% 45<br />
J1 Construction trades 0.00% 46<br />
J1 Mechanic and repair technologies 0.00% 47<br />
J1 Precision production 0.00% 48<br />
J1 Transportation and materials moving 0.00% 49<br />
J1 Visual and performing arts 6.25% 50<br />
J1 Health professions and related programs 7.59% 51<br />
J1 Business/marketing 13.84% 52<br />
J1 History 4.24% 54<br />
J1 Other 0.00%<br />
J1 TOTAL (should = 100%) 0.00% 0.00% 100.00%<br />
CDS-J complete Page 1