A. General Information - Pacific Lutheran University
A. General Information - Pacific Lutheran University
A. General Information - Pacific Lutheran University

You also want an ePaper? Increase the reach of your titles
YUMPU automatically turns print PDFs into web optimized ePapers that Google loves.
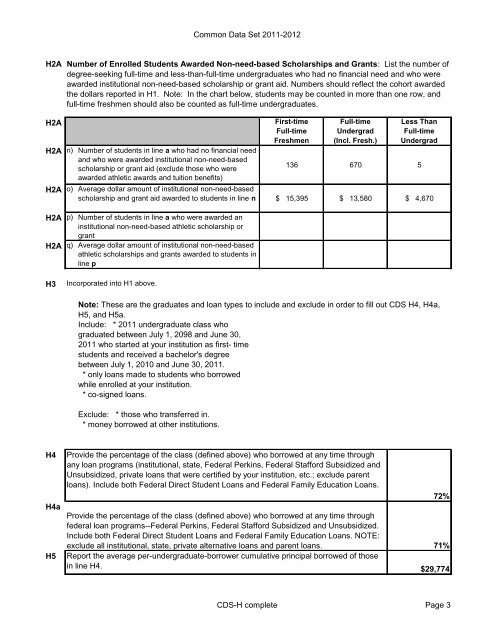
Common Data Set 2011-2012<br />
H2A<br />
Number of Enrolled Students Awarded Non-need-based Scholarships and Grants: List the number of<br />
degree-seeking full-time and less-than-full-time undergraduates who had no financial need and who were<br />
awarded institutional non-need-based scholarship or grant aid. Numbers should reflect the cohort awarded<br />
the dollars reported in H1. Note: In the chart below, students may be counted in more than one row, and<br />
full-time freshmen should also be counted as full-time undergraduates.<br />
H2A<br />
H2A n) Number of students in line a who had no financial need<br />
and who were awarded institutional non-need-based<br />
scholarship or grant aid (exclude those who were<br />
awarded athletic awards and tuition benefits)<br />
First-time<br />
Full-time<br />
Freshmen<br />
Full-time<br />
Undergrad<br />
(Incl. Fresh.)<br />
Less Than<br />
Full-time<br />
Undergrad<br />
136 670 5<br />
H2A o) Average dollar amount of institutional non-need-based<br />
scholarship and grant aid awarded to students in line n $ 15,395 $ 13,580 $ 4,670<br />
H2A p) Number of students in line a who were awarded an<br />
institutional non-need-based athletic scholarship or<br />
grant<br />
H2A q) Average dollar amount of institutional non-need-based<br />
athletic scholarships and grants awarded to students in<br />
line p<br />
H3<br />
Incorporated into H1 above.<br />
Note: These are the graduates and loan types to include and exclude in order to fill out CDS H4, H4a,<br />
H5, and H5a.<br />
Include: * 2011 undergraduate class who<br />
graduated between July 1, 2098 and June 30,<br />
2011 who started at your institution as first- time<br />
students and received a bachelor's degree<br />
between July 1, 2010 and June 30, 2011.<br />
* only loans made to students who borrowed<br />
while enrolled at your institution.<br />
* co-signed loans.<br />
Exclude: * those who transferred in.<br />
* money borrowed at other institutions.<br />
H4<br />
H4a<br />
H5<br />
Provide the percentage of the class (defined above) who borrowed at any time through<br />
any loan programs (institutional, state, Federal Perkins, Federal Stafford Subsidized and<br />
Unsubsidized, private loans that were certified by your institution, etc.; exclude parent<br />
loans). Include both Federal Direct Student Loans and Federal Family Education Loans.<br />
Provide the percentage of the class (defined above) who borrowed at any time through<br />
federal loan programs--Federal Perkins, Federal Stafford Subsidized and Unsubsidized.<br />
Include both Federal Direct Student Loans and Federal Family Education Loans. NOTE:<br />
exclude all institutional, state, private alternative loans and parent loans.<br />
Report the average per-undergraduate-borrower cumulative principal borrowed of those<br />
in line H4.<br />
72%<br />
71%<br />
$29,774<br />
CDS-H complete Page 3