Atmospheric carbon dioxide levels for the last 500 million years
Atmospheric carbon dioxide levels for the last 500 million years
Atmospheric carbon dioxide levels for the last 500 million years

You also want an ePaper? Increase the reach of your titles
YUMPU automatically turns print PDFs into web optimized ePapers that Google loves.
volcanic degassing. Assuming that r r(w) and v h v h (v), g’s<br />
dependence on w and v may be written § drdw 0, dudw 0, and dv h dv 0. [7]<br />
g grw, v h v. [4]<br />
With respect to toc , <strong>the</strong> physiological term may likewise<br />
depend on w because of changing nutrient concentrations in <strong>the</strong><br />
oceans. could also depend on CO 2 <strong>levels</strong>, which in turn depend<br />
on degassing, wea<strong>the</strong>ring rates—because of <strong>the</strong> net uptake rate<br />
u u(w) of atmospheric CO 2 associated with silicate wea<strong>the</strong>ring<br />
(1, 2, 24)—and o<strong>the</strong>r processes, such as organic <strong>carbon</strong> burial,<br />
which we collectively designate by b. Aggregating <strong>the</strong>se dependencies<br />
<strong>the</strong>n yields<br />
w, uw, v, b<br />
toc 0 .<br />
uw, v, b<br />
[5]<br />
Comparison of Eqs. 4 and 5 directly reveals <strong>the</strong> joint dependence<br />
of g and toc on v and w.<br />
Removal of <strong>the</strong> Effects of Sedimentary Recycling<br />
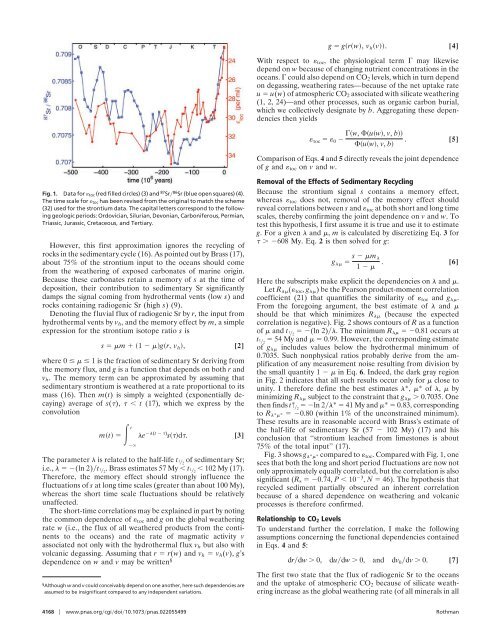
Fig. 1. Data <strong>for</strong> toc (red filled circles) (3) and 87 Sr 86 Sr (blue open squares) (4). Because <strong>the</strong> strontium signal s contains a memory effect,<br />
The time scale <strong>for</strong> toc has been revised from <strong>the</strong> original to match <strong>the</strong> scheme whereas toc does not, removal of <strong>the</strong> memory effect should<br />
(32) used <strong>for</strong> <strong>the</strong> strontium data. The capital letters correspond to <strong>the</strong> following<br />
geologic periods: Ordovician, Silurian, Devonian, Carboniferous, Permian,<br />
Triassic, Jurassic, Cretaceous, and Tertiary.<br />
reveal correlations between s and toc at both short and long time<br />
scales, <strong>the</strong>reby confirming <strong>the</strong> joint dependence on v and w. To<br />
test this hypo<strong>the</strong>sis, I first assume it is true and use it to estimate<br />
g. For a given and , m is calculated by discretizing Eq. 3 <strong>for</strong><br />
However, this first approximation ignores <strong>the</strong> recycling of<br />
rocks in <strong>the</strong> sedimentary cycle (16). As pointed out by Brass (17),<br />
about 75% of <strong>the</strong> strontium input to <strong>the</strong> oceans should come<br />
from <strong>the</strong> wea<strong>the</strong>ring of exposed <strong>carbon</strong>ates of marine origin.<br />
608 My. Eq. 2 is <strong>the</strong>n solved <strong>for</strong> g:<br />
g s m <br />
1 . [6]<br />
Because <strong>the</strong>se <strong>carbon</strong>ates retain a memory of s at <strong>the</strong> time of Here <strong>the</strong> subscripts make explicit <strong>the</strong> dependencies on and .<br />
deposition, <strong>the</strong>ir contribution to sedimentary Sr significantly Let R ( toc , g ) be <strong>the</strong> Pearson product-moment correlation<br />
damps <strong>the</strong> signal coming from hydro<strong>the</strong>rmal vents (low s) and<br />
rocks containing radiogenic Sr (high s) (9).<br />
coefficient (21) that quantifies <strong>the</strong> similarity of toc and g .<br />
From <strong>the</strong> <strong>for</strong>egoing argument, <strong>the</strong> best estimate of and <br />
Denoting <strong>the</strong> fluvial flux of radiogenic Sr by r, <strong>the</strong> input from should be that which minimizes R (because <strong>the</strong> expected<br />
hydro<strong>the</strong>rmal vents by v h , and <strong>the</strong> memory effect by m, a simple<br />
expression <strong>for</strong> <strong>the</strong> strontium isotope ratio s is<br />
correlation is negative). Fig. 2 shows contours of R as a function<br />
of and t1 2<br />
(ln 2). The minimum R 0.81 occurs at<br />
s m 1 gr, v h , [2]<br />
t1 2<br />
54 My and 0.99. However, <strong>the</strong> corresponding estimate<br />
of g includes values below <strong>the</strong> hydro<strong>the</strong>rmal minimum of<br />
0.7035. Such nonphysical ratios probably derive from <strong>the</strong> amplification<br />
of any measurement noise resulting from division by<br />
where 0 1 is <strong>the</strong> fraction of sedimentary Sr deriving from<br />
<strong>the</strong> memory flux, and g is a function that depends on both r and <strong>the</strong> small quantity 1 in Eq. 6. Indeed, <strong>the</strong> dark gray region<br />
v h . The memory term can be approximated by assuming that in Fig. 2 indicates that all such results occur only <strong>for</strong> close to<br />
sedimentary strontium is wea<strong>the</strong>red at a rate proportional to its unity. I <strong>the</strong>re<strong>for</strong>e define <strong>the</strong> best estimates *, * of, by<br />
mass (16). Then m(t) is simply a weighted (exponentially decaying)<br />
average of s(), t (17), which we express by <strong>the</strong> <strong>the</strong>n finds<br />
minimizing R subject to <strong>the</strong> constraint that g 0.7035. One<br />
convolution<br />
2<br />
ln 2* 41 My and * 0.83, corresponding<br />
to R ** 0.80 (within 1% of <strong>the</strong> unconstrained minimum).<br />
These results are in reasonable accord with Brass’s estimate of<br />
t<br />
<strong>the</strong> half-life of sedimentary Sr (57 102 My) (17) and his<br />
mt e <br />
sd. [3] conclusion that ‘‘strontium leached from limestones is about<br />
75% of <strong>the</strong> total input’’ (17).<br />
Fig. 3 shows g ** compared to toc . Compared with Fig. 1, one<br />
The parameter is related to <strong>the</strong> half-life t1 2<br />
of sedimentary Sr;<br />
sees that both <strong>the</strong> long and short period fluctuations are now not<br />
i.e., (ln 2)t1 2<br />
. Brass estimates 57 My t1 2<br />
102 My (17). only approximately equally correlated, but <strong>the</strong> correlation is also<br />
There<strong>for</strong>e, <strong>the</strong> memory effect should strongly influence <strong>the</strong> significant (R s 0.74, P 10 3 , N 46). The hypo<strong>the</strong>sis that<br />
fluctuations of s at long time scales (greater than about 100 My), recycled sediment partially obscured an inherent correlation<br />
whereas <strong>the</strong> short time scale fluctuations should be relatively because of a shared dependence on wea<strong>the</strong>ring and volcanic<br />
unaffected.<br />
processes is <strong>the</strong>re<strong>for</strong>e confirmed.<br />
The short-time correlations may be explained in part by noting<br />
<strong>the</strong> common dependence of toc and g on <strong>the</strong> global wea<strong>the</strong>ring<br />
rate w (i.e., <strong>the</strong> flux of all wea<strong>the</strong>red products from <strong>the</strong> continents<br />
to <strong>the</strong> oceans) and <strong>the</strong> rate of magmatic activity v<br />
associated not only with <strong>the</strong> hydro<strong>the</strong>rmal flux v h but also with<br />
Relationship to CO 2 Levels<br />
To understand fur<strong>the</strong>r <strong>the</strong> correlation, I make <strong>the</strong> following<br />
assumptions concerning <strong>the</strong> functional dependencies contained<br />
in Eqs. 4 and 5:<br />
§ Although w and v could conceivably depend on one ano<strong>the</strong>r, here such dependencies are<br />
assumed to be insignificant compared to any independent variations.<br />
The first two state that <strong>the</strong> flux of radiogenic Sr to <strong>the</strong> oceans<br />
and <strong>the</strong> uptake of atmospheric CO 2 because of silicate wea<strong>the</strong>ring<br />
increase as <strong>the</strong> global wea<strong>the</strong>ring rate (of all minerals in all<br />
4168 www.pnas.orgcgidoi10.1073pnas.022055499 Rothman