Atmospheric carbon dioxide levels for the last 500 million years
Atmospheric carbon dioxide levels for the last 500 million years
Atmospheric carbon dioxide levels for the last 500 million years

You also want an ePaper? Increase the reach of your titles
YUMPU automatically turns print PDFs into web optimized ePapers that Google loves.
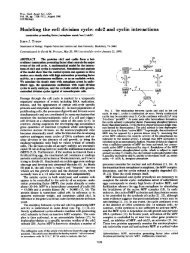
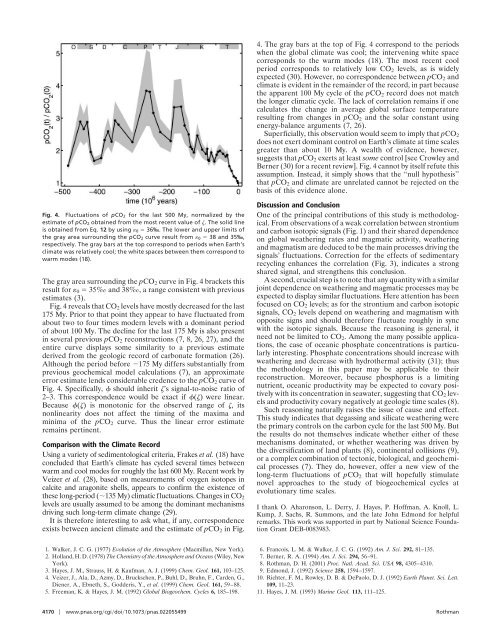
4. The gray bars at <strong>the</strong> top of Fig. 4 correspond to <strong>the</strong> periods<br />
when <strong>the</strong> global climate was cool; <strong>the</strong> intervening white space<br />
corresponds to <strong>the</strong> warm modes (18). The most recent cool<br />
period corresponds to relatively low CO 2 <strong>levels</strong>, as is widely<br />
expected (30). However, no correspondence between pCO 2 and<br />
climate is evident in <strong>the</strong> remainder of <strong>the</strong> record, in part because<br />
<strong>the</strong> apparent 100 My cycle of <strong>the</strong> pCO 2 record does not match<br />
<strong>the</strong> longer climatic cycle. The lack of correlation remains if one<br />
calculates <strong>the</strong> change in average global surface temperature<br />
resulting from changes in pCO 2 and <strong>the</strong> solar constant using<br />
energy-balance arguments (7, 26).<br />
Superficially, this observation would seem to imply that pCO 2<br />
does not exert dominant control on Earth’s climate at time scales<br />
greater than about 10 My. A wealth of evidence, however,<br />
suggests that pCO 2 exerts at least some control [see Crowley and<br />
Berner (30) <strong>for</strong> a recent review]. Fig. 4 cannot by itself refute this<br />
assumption. Instead, it simply shows that <strong>the</strong> ‘‘null hypo<strong>the</strong>sis’’<br />
that pCO 2 and climate are unrelated cannot be rejected on <strong>the</strong><br />
basis of this evidence alone.<br />
Fig. 4. Fluctuations of pCO 2 <strong>for</strong> <strong>the</strong> <strong>last</strong> <strong>500</strong> My, normalized by <strong>the</strong><br />
estimate of pCO 2 obtained from <strong>the</strong> most recent value of . The solid line<br />
is obtained from Eq. 12 by using 0 36‰. The lower and upper limits of<br />
<strong>the</strong> gray area surrounding <strong>the</strong> pCO 2 curve result from 0 38 and 35‰,<br />
respectively. The gray bars at <strong>the</strong> top correspond to periods when Earth’s<br />
climate was relatively cool; <strong>the</strong> white spaces between <strong>the</strong>m correspond to<br />
warm modes (18).<br />
The gray area surrounding <strong>the</strong> pCO 2 curve in Fig. 4 brackets this<br />
result <strong>for</strong> 0 35‰ and 38‰, a range consistent with previous<br />
estimates (3).<br />
Fig. 4 reveals that CO 2 <strong>levels</strong> have mostly decreased <strong>for</strong> <strong>the</strong> <strong>last</strong><br />
175 My. Prior to that point <strong>the</strong>y appear to have fluctuated from<br />
about two to four times modern <strong>levels</strong> with a dominant period<br />
of about 100 My. The decline <strong>for</strong> <strong>the</strong> <strong>last</strong> 175 My is also present<br />
in several previous pCO 2 reconstructions (7, 8, 26, 27), and <strong>the</strong><br />
entire curve displays some similarity to a previous estimate<br />
derived from <strong>the</strong> geologic record of <strong>carbon</strong>ate <strong>for</strong>mation (26).<br />
Although <strong>the</strong> period be<strong>for</strong>e 175 My differs substantially from<br />
previous geochemical model calculations (7), an approximate<br />
error estimate lends considerable credence to <strong>the</strong> pCO 2 curve of<br />
Fig. 4. Specifically, should inherit ’s signal-to-noise ratio of<br />
2–3. This correspondence would be exact if () were linear.<br />
Because () is monotonic <strong>for</strong> <strong>the</strong> observed range of , its<br />
nonlinearity does not affect <strong>the</strong> timing of <strong>the</strong> maxima and<br />
minima of <strong>the</strong> pCO 2 curve. Thus <strong>the</strong> linear error estimate<br />
remains pertinent.<br />
Comparison with <strong>the</strong> Climate Record<br />
Using a variety of sedimentological criteria, Frakes et al. (18) have<br />
concluded that Earth’s climate has cycled several times between<br />
warm and cool modes <strong>for</strong> roughly <strong>the</strong> <strong>last</strong> 600 My. Recent work by<br />
Veizer et al. (28), based on measurements of oxygen isotopes in<br />
calcite and aragonite shells, appears to confirm <strong>the</strong> existence of<br />
<strong>the</strong>se long-period (135 My) climatic fluctuations. Changes in CO 2<br />
<strong>levels</strong> are usually assumed to be among <strong>the</strong> dominant mechanisms<br />
driving such long-term climate change (29).<br />
It is <strong>the</strong>re<strong>for</strong>e interesting to ask what, if any, correspondence<br />
exists between ancient climate and <strong>the</strong> estimate of pCO 2 in Fig.<br />
Discussion and Conclusion<br />
One of <strong>the</strong> principal contributions of this study is methodological.<br />
From observations of a weak correlation between strontium<br />
and <strong>carbon</strong> isotopic signals (Fig. 1) and <strong>the</strong>ir shared dependence<br />
on global wea<strong>the</strong>ring rates and magmatic activity, wea<strong>the</strong>ring<br />
and magmatism are deduced to be <strong>the</strong> main processes driving <strong>the</strong><br />
signals’ fluctuations. Correction <strong>for</strong> <strong>the</strong> effects of sedimentary<br />
recycling enhances <strong>the</strong> correlation (Fig. 3), indicates a strong<br />
shared signal, and streng<strong>the</strong>ns this conclusion.<br />
A second, crucial step is to note that any quantity with a similar<br />
joint dependence on wea<strong>the</strong>ring and magmatic processes may be<br />
expected to display similar fluctuations. Here attention has been<br />
focused on CO 2 <strong>levels</strong>; as <strong>for</strong> <strong>the</strong> strontium and <strong>carbon</strong> isotopic<br />
signals, CO 2 <strong>levels</strong> depend on wea<strong>the</strong>ring and magmatism with<br />
opposite signs and should <strong>the</strong>re<strong>for</strong>e fluctuate roughly in sync<br />
with <strong>the</strong> isotopic signals. Because <strong>the</strong> reasoning is general, it<br />
need not be limited to CO 2 . Among <strong>the</strong> many possible applications,<br />
<strong>the</strong> case of oceanic phosphate concentrations is particularly<br />
interesting. Phosphate concentrations should increase with<br />
wea<strong>the</strong>ring and decrease with hydro<strong>the</strong>rmal activity (31); thus<br />
<strong>the</strong> methodology in this paper may be applicable to <strong>the</strong>ir<br />
reconstruction. Moreover, because phosphorus is a limiting<br />
nutrient, oceanic productivity may be expected to covary positively<br />
with its concentration in seawater, suggesting that CO 2 <strong>levels</strong><br />
and productivity covary negatively at geologic time scales (8).<br />
Such reasoning naturally raises <strong>the</strong> issue of cause and effect.<br />
This study indicates that degassing and silicate wea<strong>the</strong>ring were<br />
<strong>the</strong> primary controls on <strong>the</strong> <strong>carbon</strong> cycle <strong>for</strong> <strong>the</strong> <strong>last</strong> <strong>500</strong> My. But<br />
<strong>the</strong> results do not <strong>the</strong>mselves indicate whe<strong>the</strong>r ei<strong>the</strong>r of <strong>the</strong>se<br />
mechanisms dominated, or whe<strong>the</strong>r wea<strong>the</strong>ring was driven by<br />
<strong>the</strong> diversification of land plants (8), continental collisions (9),<br />
or a complex combination of tectonic, biological, and geochemical<br />
processes (7). They do, however, offer a new view of <strong>the</strong><br />
long-term fluctuations of pCO 2 that will hopefully stimulate<br />
novel approaches to <strong>the</strong> study of biogeochemical cycles at<br />
evolutionary time scales.<br />
I thank O. Aharonson, L. Derry, J. Hayes, P. Hoffman, A. Knoll, L.<br />
Kump, J. Sachs, R. Summons, and <strong>the</strong> late John Edmond <strong>for</strong> helpful<br />
remarks. This work was supported in part by National Science Foundation<br />
Grant DEB-0083983.<br />
1. Walker, J. C. G. (1977) Evolution of <strong>the</strong> Atmosphere (Macmillan, New York).<br />
2. Holland, H. D. (1978) The Chemistry of <strong>the</strong> Atmosphere and Oceans (Wiley, New<br />
York).<br />
3. Hayes, J. M., Strauss, H. & Kaufman, A. J. (1999) Chem. Geol. 161, 103–125.<br />
4. Veizer, J., Ala, D., Azmy, D., Bruckschen, P., Buhl, D., Bruhn, F., Carden, G.,<br />
Diener, A., Ebneth, S., Godderis, Y., et al. (1999) Chem. Geol. 161, 59–88.<br />
5. Freeman, K. & Hayes, J. M. (1992) Global Biogeochem. Cycles 6, 185–198.<br />
6. Francois, L. M. & Walker, J. C. G. (1992) Am. J. Sci. 292, 81–135.<br />
7. Berner, R. A. (1994) Am. J. Sci. 294, 56–91.<br />
8. Rothman, D. H. (2001) Proc. Natl. Acad. Sci. USA 98, 4305–4310.<br />
9. Edmond, J. (1992) Science 258, 1594–1597.<br />
10. Richter, F. M., Rowley, D. B. & DePaolo, D. J. (1992) Earth Planet. Sci. Lett.<br />
109, 11–23.<br />
11. Hayes, J. M. (1993) Marine Geol. 113, 111–125.<br />
4170 www.pnas.orgcgidoi10.1073pnas.022055499 Rothman