DSM Terminal-Area-Concept-Plan-Technical-Report - FINAL
DSM Terminal-Area-Concept-Plan-Technical-Report - FINAL
DSM Terminal-Area-Concept-Plan-Technical-Report - FINAL

You also want an ePaper? Increase the reach of your titles
YUMPU automatically turns print PDFs into web optimized ePapers that Google loves.
Foth Infrastructure & Environment<br />
CONNICO<br />
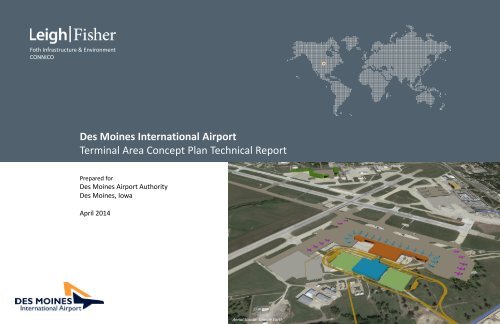
Des Moines International Airport<br />
<strong>Terminal</strong> <strong>Area</strong> <strong>Concept</strong> <strong>Plan</strong> <strong>Technical</strong> <strong>Report</strong><br />
Prepared for<br />
Des Moines Airport Authority<br />
Des Moines, Iowa<br />
April 2014<br />
Aerial Source: Google Earth
Table of Contents<br />
1. Executive Summary . . . . . . . . . . . . . . . . . . . . . . . . . . . . . . . . . . . . . . . . . . . . 3<br />
2. Existing Conditions . . . . . . . . . . . . . . . . . . . . . . . . . . . . . . . . . . . . . . . . . . . . . 6<br />
• Airport Overview<br />
• Airfield Facilities<br />
• Passenger <strong>Terminal</strong> Complex<br />
• Ground Transportation Facilities and Conditions<br />
• Air Cargo Facilities<br />
• General Aviation and Support Facilities<br />
• Iowa Air National Guard Facilities<br />
3. Aviation Demand Forecast . . . . . . . . . . . . . . . . . . . . . . . . . . . . . . . . . . . . . . . 24<br />
• Forecast Approach<br />
• Forecast Summary<br />
• Economic Basis for Airline Traffic<br />
• Historical Aviation Activity<br />
• Aviation Activity Forecasts<br />
5. <strong>Concept</strong> Alternatives Analysis . . . . . . . . . . . . . . . . . . . . . . . . . . . . . . . . . . . . 59<br />
• Land Use Alternatives<br />
• <strong>Terminal</strong> Alternatives<br />
6. Preferred Alternatives Refinements . . . . . . . . . . . . . . . . . . . . . . . . . . . . . . . 74<br />
• Preferred Land Use Alternative Refinements<br />
• Preferred <strong>Terminal</strong> Alternative Refinements<br />
• Project Implementation <strong>Plan</strong><br />
7. Preliminary Financial Capacity Analysis . . . . . . . . . . . . . . . . . . . . . . . . . . . .82<br />
• Key Drivers<br />
• Industry Benchmarks<br />
• Preliminary <strong>Plan</strong> of Finance<br />
• Sensitivity Analyses and Financial Conclusions<br />
4. Demand/Capacity and Facilities Requirements Analyses . . . . . . . . . . . . . . 35<br />
• Passenger <strong>Terminal</strong> Requirements<br />
• Ground Transportation Requirements<br />
• Airfield Requirements<br />
• Cargo, General Aviation, and Support Facility Requirements<br />
2<br />
TERMINAL AREA CONCEPT PLAN TECHNICAL REPORT<br />
Des Moines International Airport
Executive Summary<br />
<strong>Plan</strong> is needed to address obsolescence of existing passenger terminal and general aviation expansion<br />
KEY POINTS<br />
• Airport is growing and<br />
needs to replace its<br />
terminal.<br />
• A workshop approach<br />
was used to guide the<br />
Advisory Committee.<br />
The Des Moines Airport Authority (the Authority)<br />
undertook the preparation of this <strong>Terminal</strong> <strong>Area</strong> <strong>Concept</strong><br />
<strong>Plan</strong> in support of needed improvements to the Des<br />
Moines International Airport (the Airport) terminal<br />
complex. The existing terminal building was first built in<br />
1948 and, although it has been subject to upgrades and<br />
improvements over the years, it has reached the end of its<br />
useful economic life. The Authority seeks a solution to the<br />
problems with the terminal complex, and wants to do so<br />
with a full understanding of the context of the Airport and<br />
the long-term needs of the other functional airport<br />
components (such as air cargo, the Iowa Air National<br />
Guard, corporate aviation, general aviation and airport<br />
support functions). In this sense, this document closely<br />
resembles an airport master plan. The planning effort<br />
includes key elements of a master plan, but with a distinct<br />
focus on the terminal area.<br />
Figure B shows enplanement projections rising at 3.4%<br />
annual until 2032.<br />
Figure A<br />
Passenger Congestion and Overflow at Peak<br />
The <strong>Plan</strong>ning Study<br />
The <strong>Terminal</strong> <strong>Area</strong> <strong>Concept</strong> <strong>Plan</strong> includes all of the elements of<br />
a classic master plan: inventory, forecasts, facility requirements<br />
analysis, alternatives analysis, financial capacity analysis, an<br />
environmental overview, and an airport layout plan (ALP)<br />
update. The study was overseen by an Advisory Committee,<br />
which met with Airport staff and the consultant team four<br />
times over a seven month period, in a workshop setting. The<br />
four workshops were organized as follows:<br />
Workshop #1 established the shortcomings of the existing<br />
terminal complex, presented long range demand forecasts,<br />
and described the preliminary financial capacity analysis.<br />
Figure C indicates shortcomings of the major functional<br />
components of the existing passenger terminal. Passenger<br />
activity levels are described as Million Annual Passengers<br />
(MAP), which reflects both enplanements and deplanements.<br />
The Situation<br />
The Authority operates the busiest and most successful<br />
airport in Iowa; and its activities are growing. The airfield<br />
system is effective in accommodating operational demand<br />
and supporting the Airport’s users. However, the<br />
passenger terminal building is inadequate. In 2013, pieces<br />
of the building structure literally fell from the ceiling to the<br />
floor. Major functional components of the terminal<br />
complex are beyond capacity, or near it. With passenger<br />
traffic increasing and airlines adding routes, the timing was<br />
right for the Authority to address the situation within the<br />
context of a long-range plan.<br />
Source: <strong>DSM</strong> Operations.<br />
Figure B<br />
Historical and Forecast Enplaned Passengers<br />
Figure C<br />
Existing <strong>Terminal</strong> Stress Chart<br />
The goal of plan was to:<br />
• Develop a long-term solution to the obsolescence of the<br />
existing passenger terminal complex and its lack of<br />
capacity expansion potential<br />
• Take a comprehensive look at each of the Airport’s<br />
functional components to ensure they could each grow<br />
and meet projected demands<br />
• Develop a terminal plan must be functional, affordable,<br />
and improve the passenger experience<br />
Illustrated on Figure A is a photo showing passenger<br />
congestion and overflow at the existing passenger terminal<br />
during peak.<br />
3<br />
TERMINAL AREA CONCEPT PLAN TECHNICAL REPORT<br />
Des Moines International Airport
Executive Summary<br />
<strong>Terminal</strong> plan considered long term needs of all airport functions<br />
KEY POINTS<br />
• <strong>Plan</strong> reviewed all Airport<br />
functional needs;<br />
including highest and<br />
best use in each<br />
quadrant.<br />
Workshop #2 presented long range facility requirements for<br />
the primary functional components of the Airport (including<br />
passenger terminal building, roadways, corporate aviation,<br />
military, air cargo, airfield, etc.) and explored at a high level<br />
alternative ways to meet those demands as shown in the<br />
summary in Table ES-1. The review was narrowed to the two<br />
top land use concepts (showing terminal development in the<br />
south or east “quadrants” of the Airport), each of which<br />
allows for compatible future development.<br />
A. Passenger terminal<br />
(square feet)<br />
B. Ground transportation<br />
Table ES-1<br />
Facility Requirements Summary<br />
Existing<br />
Facilities<br />
2.5<br />
MAP<br />
3.0<br />
MAP<br />
4.0<br />
MAP<br />
272,900 207,300 236,000 315,500<br />
Public parking (spaces) 4,258 4,220 5,100 6,800<br />
Employee parking (spaces) 273 280 300 340<br />
Rental car facilities (spaces) 370 350 420 570<br />
Quick turnaround (acres) 8.6 5.5 6.5 8.8<br />
C. Air cargo facilities (acres) 50.0 10.0 10.6 11.7<br />
D. General aviation<br />
Aircraft parking apron<br />
(positions)<br />
Aircraft storage facilities<br />
(square feet)<br />
E. Airline Support<br />
50.0 65.0 65.0 66.0<br />
294,000 286,000 326,100 428,200<br />
Fuel storage (gallons) 440,000 439,300 485,400 599,200<br />
Land <strong>Area</strong> (acres) 1.7 1.7 1.8 2.3<br />
GSE equipment parking<br />
areas (square feet)<br />
n.a. 32,300 37,800 49,200<br />
GSE gross land area (acres) 0.5 0.9 0.9<br />
Workshop #3 explored alternative passenger terminal<br />
development schemes for the two short-listed land use<br />
alternatives and presented results of the technical analyses<br />
conducted. This helped the Advisory Committee in their<br />
deliberations to select a preferred terminal alternative, which<br />
would then be further refined.<br />
Workshop #4 presented information on the refinement of<br />
the preferred terminal area concept, including project costs,<br />
financial capacity and an implementation plan.<br />
The Solution<br />
The <strong>Terminal</strong> <strong>Area</strong> <strong>Concept</strong> <strong>Plan</strong> Advisory Committee selected<br />
an alternative that would build a new terminal complex<br />
(terminal building, auto parking, roadways, etc.) in the south<br />
quadrant of the Airport. This is currently the site of air cargo<br />
operations. Following are some of the key reasons for<br />
selecting this site for a new terminal development area:<br />
• Site is currently underutilized, as a result of fundamental<br />
shifts in the air cargo industry.<br />
• The heavy apron built to support air cargo operations is an<br />
asset that can be more fully used to support commercial<br />
passenger airline operations<br />
• Compared to the alternative of replacing the terminal<br />
building at its current site, developing a new terminal<br />
building on the south site can be done without<br />
affecting passengers during construction.<br />
• The south site has greater expansion capabilities<br />
beyond the planning timeframe and as such was<br />
viewed as a better long range investment.<br />
The preferred terminal alternative is shown graphically<br />
on Figure D. It would be developed in two major phases,<br />
with initial build-out having 14 gates, and full build-out<br />
with four additional gates for a total of 18 gates.<br />
Additionally, as mentioned above, this site has capacity<br />
to expand with more gates as demand may dictate<br />
beyond the projected demand identified in this study.<br />
The initial phase includes a new loop roadway system for<br />
automobile access, a new parking garage (although the<br />
existing garage would continue to be used for long term<br />
parking), a central processor building (housing ticketing,<br />
bag claim, etc.) and a linear concourse with double<br />
loaded end caps. This is a very efficient layout and will<br />
serve the Airport well for decades.<br />
Figure D<br />
Preferred <strong>Terminal</strong> Alternative<br />
4<br />
TERMINAL AREA CONCEPT PLAN TECHNICAL REPORT<br />
Des Moines International Airport
Executive Summary<br />
Funding and implementation plans developed<br />
KEY POINTS<br />
• Phase 1 (14) gates<br />
estimated to cost $420<br />
million in 2014 dollars.<br />
• Inflation will increase<br />
construction costs to<br />
$538 million by 2024<br />
completion.<br />
Enabling projects that are needed in order to make the<br />
preferred alternative work are described as follows:<br />
• Negotiate agreement with Iowa Air National Guard<br />
(IANG) regarding property<br />
and facilities they need to support their new mission<br />
• Relocate Signature Flight Support and FedEx to the<br />
IANG site<br />
• Demolish select buildings in the south quadrant<br />
• Build new parallel taxiway on the southwest side of<br />
Runway 13-31<br />
The cost of this alternative (in 2014 dollars) is shown in<br />
Table ES-2 below. This includes hard construction costs as<br />
well as soft costs such as design, project management, and<br />
contingencies.<br />
The schedule for implementing the terminal program is<br />
shown in Figure E below, with a date of beneficial occupancy<br />
(opening date) of 2024.<br />
Figure E<br />
Project Implementation Schedule<br />
Conclusions<br />
• The Des Moines Airport Authority has developed a<br />
plan for a modern, fully functional passenger terminal<br />
complex to replace its aging and obsolete terminal<br />
infrastructure. Once completed, it will provide a high<br />
level of service to its passengers and serve the region<br />
effectively for decades. Implementing the plan<br />
requires many steps and there are challenges the<br />
Authority will face. Following are some conclusions<br />
and recommendations for moving the project forward.<br />
• The Authority should continue refining the plan<br />
through a programming effort, which will provide<br />
greater detail and clarity to the plan. This will likely<br />
reduce the magnitude of some of the contingencies<br />
included in the cost estimate.<br />
Table ES-2<br />
Refined Order of Magnitude Cost Summary<br />
• It is important to work with the airlines on this plan<br />
and seek alignment with them.<br />
The timeline for building the terminal and support facilities was<br />
established to take into account other priorities for Airport<br />
funding, especially the airfield which requires major<br />
rehabilitation. With inflation adjustments made for construction<br />
costs, and considering the implementation timeline, a<br />
conceptual funding plan for the $538 million project was<br />
developed, as shown on Figure F.<br />
Figure F<br />
<strong>Concept</strong>ual Funding <strong>Plan</strong><br />
• The conceptual funding plan includes a $200 million<br />
plug for non-AIP grants. The Airport will need to get<br />
creative in finding these additional sources of monies<br />
in order to make the plan viable.<br />
• Negotiations with the IANG are an important element<br />
of moving the plan forward. A portion of the property<br />
that has been used by the IANG to support its<br />
previous mission is needed for key plan elements,<br />
especially corporate general aviation.<br />
5<br />
TERMINAL AREA CONCEPT PLAN TECHNICAL REPORT<br />
Des Moines International Airport
EXISTING CONDITIONS<br />
• Airport Overview<br />
• Airfield Facilities<br />
• Passenger <strong>Terminal</strong> Complex<br />
• Ground Transportation Facilities and Conditions<br />
• Air Cargo Facilities<br />
• General Aviation and Support Facilities<br />
• Iowa Air National Guard Facilities
Introduction and Airport Overview<br />
Key regional airport with strong local traffic base<br />
KEY POINTS<br />
• Most important Airport<br />
in Iowa<br />
• Over two million<br />
passengers served in<br />
2013<br />
Airport setting<br />
Des Moines International Airport (the Airport) is a civilmilitary<br />
public airport located three miles southwest of<br />
downtown Des Moines, in the southern portion of Polk<br />
County (Figure 1). It was opened in 1933 and has since<br />
served residents and visitors of the Des Moines Metropolitan<br />
Statistical <strong>Area</strong> (MSA) consisting of Polk, Dallas, Warren, Des<br />
Moines and Guthrie counties in Iowa. It is classified in the<br />
National <strong>Plan</strong> of Integrated Airport Systems as a primary<br />
commercial service airport and has an important role in the<br />
national, state, and local air transportation systems.<br />
Des Moines International Airport is a small air traffic hub and<br />
ranked as the 86 th largest passenger airport in the United<br />
States in 2012. It is primarily an Origin and Destination (O&D)<br />
airport with 96% of its passengers originating from the<br />
Airport and the remaining 4% connecting.<br />
This large O&D passenger base reflects the strength of the<br />
Des Moines MSA’s economy and its role as a business, trade,<br />
manufacturing, and government center. In August 2013, the<br />
Airport was served by four mainline passenger airlines, three<br />
low-cost carrier airlines, and seven regional affiliates, which<br />
together provided 49 daily nonstop departures to 15<br />
destinations. The Airport was also served by two national allcargo<br />
airlines – FedEx and UPS – as well as regional feeder<br />
cargo airlines.<br />
Figure 1<br />
Airport Vicinity Map<br />
Des Moines International Airport<br />
7<br />
TERMINAL AREA CONCEPT PLAN TECHNICAL REPORT<br />
Des Moines International Airport
Airport Overview<br />
Airport setting and site overview<br />
Airport site overview<br />
The Airport occupies over 2,600 acres of land bounded by<br />
residential neighborhoods to the north; Fleur Drive to the<br />
east; Highway 5 to the south; and Highway 28 to the west.<br />
The main entrance to the passenger terminal is on Fleur<br />
Drive.<br />
Figure 2 presents the overall Airport site, which consists of<br />
the following primary components:<br />
• Airfield – The airfield takes up a majority of the total<br />
Airport land area, and includes two runways and<br />
associated taxiways, aprons, and other safety-related<br />
protection zones.<br />
• Passenger terminal building – The passenger terminal<br />
building is located in the east quadrant of the Airport and<br />
includes the terminal building, an intermediate connector,<br />
and the concourse to accommodate 11 aircraft gates.<br />
• Air cargo – The majority of 2 of cargo operations take<br />
place in the south cargo area. Two all-cargo carriers –<br />
United Parcel Service (UPS) and FedEx - operate their<br />
regional hub and express freight service out of these<br />
facilities. A small cargo operation also exists immediately<br />
south of the passenger terminal building. An East Air<br />
Cargo Building (Building 5) located on the south portion of<br />
the east quadrant is used by the commercial carriers for<br />
air cargo carried on commercial passenger flights.<br />
• General aviation – General aviation activities are scattered<br />
around the Airport. Elliott Aviation, a fixed-based<br />
operator (FBO), leases land to the north, east of the Iowa<br />
Air National Guard. Occupying portion of the east<br />
quadrant, north of the passenger terminal, is another FBO,<br />
Signature Flight Support. Aircraft storage facilities are<br />
located in the north, east, and south quadrants of the<br />
Airport.<br />
• Parking and ground transportation – Two 4-level parking<br />
garages are located in front of the passenger terminal<br />
building along with 5 surface parking lots distributed along<br />
Fleur Drive. Rental car lots are close-in to the terminal<br />
building , served by Cowles Drive and Duck Pond Road.<br />
The Quick Turn-Around (QTA) facility for wash, fuel, light<br />
maintenance and short-term storage of rental cars is<br />
located on South Airport Frontage Road adjacent to the<br />
rental car surface lot.<br />
• Support facilities – Primary support facilities include: airline maintenance<br />
facilities; fuel farm; Federal Aviation Administration (FAA) air traffic control<br />
facilities; employee parking; Aircraft Rescue and Firefighting (ARFF); and<br />
airfield / airport maintenance support facilities.<br />
LEGEND<br />
Figure 2<br />
Airport Site Overview<br />
Des Moines International Airport<br />
8<br />
TERMINAL AREA CONCEPT PLAN TECHNICAL REPORT<br />
Des Moines International Airport
Existing Airfield Facilities<br />
Runway and Taxiway System<br />
The airfield is depicted on Figure 3, and consists of runways,<br />
taxiways, apron areas, and other facilities. Airfield facilities<br />
meet Airport Reference Code (ARC) D-IV criteria – meaning<br />
the runways and taxiways can accommodate air carrier<br />
aircraft with approach speeds up to 165 knots and<br />
wingspans of up to 170 feet. Airplane Design Group (ADG)<br />
IV aircraft include the Boeing 757-200/300 and Boeing 767-<br />
400, among others.<br />
Figure 3<br />
Airfield Facilities Map<br />
Des Moines International Airport<br />
Runways<br />
The airfield currently consists of two runways and<br />
associated taxiways in a cross configuration. Runway data,<br />
including key airfield dimensions and navigational aids, are<br />
summarized in Table 1.<br />
Runway 5-23, running in the southwest - northeast<br />
orientation, is 9,003 feet long by 150 feet wide. The runway<br />
has both concrete and asphalt surfaces and is used for both<br />
arrivals and departures. A full-length parallel taxiway,<br />
Taxiway P, is located 400 feet south of Runway 5-23, while a<br />
partial parallel taxiway, Taxiway R, is located 400 feet north<br />
of the runway.<br />
Runway 13-31, running in the northwest - southeast<br />
orientation, is 9,001 feet long by 150 feet wide. The runway<br />
has an asphalt surface and is used for both arrivals and<br />
departures. A full-length parallel taxiway, Taxiway D, is<br />
located 400 feet north of Runway 13-31.<br />
Taxiways<br />
Figure 3 shows the taxiways that connect the runway<br />
system to the aircraft parking aprons. All taxiways at the<br />
Airport are at least 75 feet wide. Taxiway shoulders are 25<br />
feet wide, which meets the FAA design guidelines for<br />
Taxiway Design Group (TDG) 5 aircraft – equivalent to the<br />
Boeing 757-200/300 and Boeing 767-400 aircraft.<br />
Taxiways are designated with a single letter and includes the<br />
following:<br />
• Taxiway A connects the terminal ramp area to Taxiway P<br />
• Taxiway B connects the terminal ramp to Runway 5-23<br />
and the general aviation ramp to both Runway 5-23 and<br />
Taxiway D<br />
• Taxiway C connects the terminal ramp to Taxiway D<br />
9<br />
TERMINAL AREA CONCEPT PLAN TECHNICAL REPORT<br />
Des Moines International Airport
Existing Airfield Facilities<br />
Runway and Taxiway System<br />
• Taxiway D is the full-length parallel taxiway north of Runway<br />
13-31. Taxiways D-1, D-2, D-4, D-5, and D-6 serve as<br />
connectors from the runway to the general aviation, Iowa Air<br />
National Guard (IANG), and terminal ramp areas<br />
• Taxiway P is the full-length parallel taxiway south of Runway<br />
5-23. Taxiways P-1, P-3, P-4, P-5, P-6, and P-7 serve as<br />
connectors from the runway to the terminal and south cargo<br />
ramp areas<br />
• Taxiway R is the partial parallel taxiway north of Runway 5-<br />
23. Taxiways R-1, and R-3 serve as connectors from the<br />
runway to the general aviation ramp area<br />
Navigational Aids and Approach Minimums<br />
Navigational aids enable the Airport to accommodate air traffic,<br />
especially during periods of low cloud cover and reduced<br />
visibility. The navigational aids installed at the Airport enable<br />
aircraft to operate under most weather conditions. In addition<br />
to these navigational aids, the FAA Airport Traffic Control Tower<br />
(ATCT) is located on the north quadrant of the Airport (Building<br />
73), directly west of the Elliott Aviation hangar and east of the<br />
Iowa Air National Guard, see Figure 14. The ATCT operates 24-<br />
hours a day.<br />
Airport runways include precision instrument approach<br />
procedures to allow continuous aircraft operations during<br />
periods of low visibility. A precision approach utilizes groundor<br />
satellite-based navigational aids to provide pilots with<br />
definitive guidance on the horizontal and vertical position of<br />
the aircraft.<br />
Runways 5 and 13 are equipped with a Category I ILS, which<br />
allows aircraft approaches to a decision height of 200 feet<br />
above ground level (AGL), with visibility minimums of 2400 RVR<br />
(0.5 miles) and 1800 RVR (0.38 miles) respectively.<br />
Runway 31 is equipped with Category IIIB ILS approaches to<br />
allow aircraft to land in even the most challenging of visibility<br />
conditions. Execution of these approaches requires aircraft to<br />
be equipped with specific avionics and pilots to receive<br />
additional training. Pilots flying the Category IIIB approach are<br />
able to land with a zero-foot cloud ceiling with visibility as low<br />
as 600 feet.<br />
Table 1<br />
Runway Data<br />
Des Moines International Airport<br />
Runway 13 Runway 31 Runway 5 Runway 23<br />
Airport Reference Code D-IV D-IV D-IV D-IV<br />
Runway length (feet) 9,001 9,001 9,003 9,003<br />
Runway width (feet) 150 150 150 150<br />
Runway end elevation (feet AMSL) 912.2 957.5 915.6 934.5<br />
Instrument approach procedures<br />
ILS CAT I<br />
RNAV(GPS)<br />
ILS CAT IIIB<br />
RNAV(GPS)<br />
ILS CAT I<br />
RNAV(GPS)<br />
VOR/DME<br />
RNAV(GPS)<br />
Runway approach slope 50:1 50:1 50:1 34:1<br />
Runway lighting HIRL HIRL HIRL HIRL<br />
Runway marking Precision Precision Precision Non-precision<br />
Pavement material Asphalt Asphalt<br />
Pavement strength (thousand lbs)<br />
Single gear<br />
Dual gear<br />
Dual tandem gear<br />
Approach aids<br />
133 (S)<br />
180 (D)<br />
340 (2D)<br />
VASI-4, MALSR, LOC,<br />
GS<br />
133 (S)<br />
180 (D)<br />
340 (2D)<br />
PAPI, ALSF2,<br />
Centerline Lights, TDZ<br />
Lights, LOC, GS<br />
Portland<br />
Cement/Asphalt<br />
133 (S)<br />
180 (D)<br />
340 (2D)<br />
PAPI, MALSR, LOC, GS<br />
Portland<br />
Cement/Asphalt<br />
133 (S)<br />
180 (D)<br />
340 (2D)<br />
PAPI, REIL<br />
Approach visibility minimums 1800 RVR 600 RVR 2400 RVR 1 mi<br />
ALSF-2 = High-intensity approach light system with centerline<br />
sequenced flasher<br />
AMSL = Above Mean Sea Level<br />
CAT = Category<br />
DME = Distance measuring equipment<br />
GPS = Global positioning system<br />
GS = Glideslope<br />
HIRL = High-intensity runway lights<br />
ILS = Instrument landing system<br />
LOC = Localizer<br />
MALSR = Medium-intensity approach light system<br />
with runway alignment indicator lights<br />
PAPI = Precision approach path indicator<br />
REIL = Runway end identifier lights<br />
RNAV = <strong>Area</strong> navigation<br />
RVR = Runway visual range<br />
VASI = Visual approach slope indicator<br />
VOR = Very high frequency omnidirectional range<br />
Sources: Airport Layout <strong>Plan</strong>, Des Moines International Airport, 2011.<br />
Airport Master <strong>Plan</strong>, Des Moines International Airport, 2007.<br />
10<br />
TERMINAL AREA CONCEPT PLAN TECHNICAL REPORT<br />
Des Moines International Airport
Existing Passenger <strong>Terminal</strong> Complex<br />
<strong>Terminal</strong> Complex Overview<br />
The Airport’s passenger terminal complex is located in the east<br />
quadrant of the Airport marked by Runway 23 to the north,<br />
Runway 31 to the south, and Fleur Drive to the east. It<br />
occupies approximately 90 acres of land, providing a home for<br />
the passenger terminal building, aircraft parking apron, east<br />
cargo facilities, Signature Flight Support, entrance / circulation<br />
roadways, and automobile parking areas – see Table 2.<br />
Figure 4<br />
East Quadrant Overview<br />
Des Moines International Airport<br />
Passenger <strong>Terminal</strong> Building<br />
The original passenger terminal building was built in 1948 with<br />
an open concourse. In the late 1950s, the ground-load<br />
concourse was enclosed to provide shelter for the passengers.<br />
Then, in the late 1960s, a concourse was added on the second<br />
level to accommodate larger size aircraft and provide improved<br />
passenger level of service. The existing baggage system and<br />
passenger loading bridges were added in the 1980s.<br />
An overview of the existing terminal complex is shown on<br />
Figure 4. Floor plans of the terminal building are shown on<br />
Figures 5 through 7.<br />
Airport<br />
Building<br />
Number<br />
Table 2<br />
Existing East Quadrant Facilities<br />
Building Description<br />
Building <strong>Area</strong><br />
(square feet)<br />
1 Passenger <strong>Terminal</strong> and Concourse 273,000<br />
2 Federal Inspection Facility (Customs) 5,335<br />
4 Deicer Storage Building 180<br />
5 East Air Cargo Building 7,150<br />
6 Parking Office 1,800<br />
7 Des Moines Flying Services Hangar 12,840<br />
8 Signature Maintenance Hangar 24,000<br />
9 Signature Storage Hangar 15,000<br />
10 Signature East Office / Hangar 30,620<br />
11 Storm Water Control Building 200<br />
Sources: 2011 Airport Layout <strong>Plan</strong>, Foth Infrastructure & Environment.<br />
2007 Master <strong>Plan</strong> report.<br />
11<br />
TERMINAL AREA CONCEPT PLAN TECHNICAL REPORT<br />
Des Moines International Airport
Existing Passenger <strong>Terminal</strong> Complex<br />
Existing Passenger <strong>Terminal</strong> Building<br />
The existing passenger terminal has 11 aircraft gates and<br />
consists of three primary levels, totaling approximately<br />
273,000 square feet. Concession support, airport support,<br />
maintenance, storage and mechanical spaces are located on<br />
the basement level. There’s a loading dock on the ground<br />
level located to the north of the existing passenger terminal<br />
where service items are received.<br />
On the first level are primary passenger processing areas:<br />
airline ticket counters and offices, baggage sorting and<br />
makeup devices, baggage claim, bag storage offices, rental car<br />
counters, concessions, meeter/greeter space, and airline<br />
operations spaces. The second level currently houses a<br />
staggered 6-lane security screening checkpoint, a central<br />
concessions node, and passenger holdrooms on the airside -<br />
Concourse A (5 gates) to the south, and Concourse C (6 gates)<br />
to the north. The airport administration offices are located<br />
landside on the second level. An approximately 1,600 sf<br />
Emergency Operations Center (EOC) is located on the third<br />
level, accessible from the airport administration area. The<br />
fourth level houses the original airport control tower and is<br />
not currently used.<br />
Table 3 summarizes the existing terminal space allocation.<br />
Figure 5<br />
Existing <strong>Terminal</strong> – Basement Level<br />
Des Moines International Airport<br />
12<br />
TERMINAL AREA CONCEPT PLAN TECHNICAL REPORT<br />
Des Moines International Airport
Existing Passenger <strong>Terminal</strong> Complex<br />
Existing Passenger <strong>Terminal</strong> Building<br />
Figure 6<br />
Existing <strong>Terminal</strong> – First Level<br />
Des Moines International Airport<br />
13<br />
TERMINAL AREA CONCEPT PLAN TECHNICAL REPORT<br />
Des Moines International Airport
Existing Passenger <strong>Terminal</strong> Complex<br />
Existing Passenger <strong>Terminal</strong><br />
Figure 7<br />
Existing <strong>Terminal</strong> – Second, Third and Fourth Levels<br />
Des Moines International Airport<br />
14<br />
TERMINAL AREA CONCEPT PLAN TECHNICAL REPORT<br />
Des Moines International Airport
Existing Passenger <strong>Terminal</strong> Complex<br />
Existing Passenger <strong>Terminal</strong><br />
Table 3<br />
Existing <strong>Terminal</strong> Space Allocation Summary (in square feet)<br />
Des Moines International Airport<br />
First Level<br />
Second Level<br />
<strong>Terminal</strong> Functions<br />
Basement Level<br />
Airline Ops/Apron<br />
Ticketing/ Bag<br />
Claim<br />
Airport<br />
Administration<br />
Concourse<br />
TOTAL<br />
Ticketing / Airline ticket offices 0.0 0.0 11,720.0 0.0 0.0 11,720.0<br />
Outbound baggage makeup area 0.0 0.0 16,955.0 0.0 0.0 16,955.0<br />
Inbound baggage delivery area 0.0 0.0 4,060.0 0.0 0.0 4,060.0<br />
Baggage claim area 0.0 0.0 7,440.0 0.0 0.0 7,440.0<br />
Security screening / TSA offices 84.6 0.0 1,965.0 0.0 12,160.0 14,209.6<br />
Concessions 0.0 0.0 4,240.0 0.0 9,406.0 13,646.0<br />
Holdrooms 0.0 3,595.0 0.0 0.0 18,411.0 22,006.0<br />
Restrooms 0.0 310.0 2,120.0 527.0 2,928.0 5,885.0<br />
Public circulation 6,860.4 1,005.0 32,010.0 6,310.0 17,985.0 64,170.4<br />
Bag storage office / Airline support 0.0 10,928.0 805.0 715.0 0.0 12,448.0<br />
Airport support 22,366.5 25,360.0 5,915.0 24,712.0 5,008.0 83,361.5<br />
Concessions support 3,669.2 1,790.0 3,685.0 0.0 0.0 9,144.2<br />
Rental car / Ground transportation 0.0 0.0 3,600.0 0.0 0.0 3,600.0<br />
Miscellaneous/others 702.7 186.0 0.0 3,613.0 0.0 4,501.7<br />
Subtotal 33,683.3 43,174.0 94,515.0 35,877.0 65,898.0 273,147.3<br />
Total Floor <strong>Area</strong> 33,683.3 137,689.0 101,775.0 273,147.3<br />
15<br />
TERMINAL AREA CONCEPT PLAN TECHNICAL REPORT<br />
Des Moines International Airport
Existing Passenger <strong>Terminal</strong> Complex<br />
Existing Passenger <strong>Terminal</strong> Situation<br />
KEY POINTS<br />
• Key terminal functional<br />
areas exceed their<br />
capacity during peak<br />
periods<br />
• The customer<br />
experience continues to<br />
erode<br />
Issues with an Aging Passenger <strong>Terminal</strong> Facility<br />
Throughout the past 65+ years, the existing terminal building<br />
had gone through many physical transformations, ranging from<br />
expansions, renovations, and modernizations, to address<br />
immediate issues and passenger demands. However, the<br />
existing structure and building systems remain original, have<br />
literally fallen apart and are beyond its useful lives. The<br />
existing structural column grid, designed to handle much lower<br />
passenger volumes, is inadequate to provide expansion and<br />
flexibilities to accommodate modern demands. Some<br />
outdated uses and functions, such as airline ticket offices, and<br />
the original airport control tower on the fourth level, are<br />
currently unused and not in optimal locations to attract<br />
leaseholds; therefore, have been non-revenue generators to<br />
the Airport.<br />
There’s also limited airside concessions to capitalize on<br />
passengers with longer airside dwell times due to current<br />
security protocols. With airlines trending towards flying larger<br />
and more fuel efficient aircraft, larger holdrooms that provide<br />
maximum exposure to concessions are in high demand.<br />
Restrooms also quickly become undersized with increased<br />
passenger traffic.<br />
The photos below provide a graphic illustration of the existing<br />
passenger terminal conditions, showing congestions at the<br />
existing terminal curbside, check-in/ticketing, security screening<br />
checkpoint, holdrooms, and baggage claim areas.<br />
Doubled parked vehicles during morning peak<br />
<strong>Terminal</strong> Curbside<br />
Check-in passenger queue overflow<br />
Check-in / Ticketing<br />
Overflow at security checkpoint queue<br />
Security Screening Checkpoint<br />
Passenger seating & staging overflow into circulation corridor<br />
Holdrooms<br />
Check-in overflow at Ticketing Lobby<br />
Check-in / Ticketing<br />
Baggage claim overflow into circulation corridor<br />
Baggage Claim<br />
16<br />
TERMINAL AREA CONCEPT PLAN TECHNICAL REPORT<br />
Des Moines International Airport
Ground Transportation Facilities<br />
Overview and Parking<br />
KEY POINTS<br />
• 2,073 spaces are<br />
currently available for<br />
close-in public parking,<br />
divided into short-term<br />
parking and long-term<br />
parking<br />
• 2,185 spaces are<br />
currently available for<br />
remote/economy<br />
parking and are served<br />
by an Airport shuttle<br />
• Employee parking is<br />
provided in a lot north<br />
of the terminal complex<br />
(273 spaces)<br />
• Three off-airport parking<br />
competitors operate<br />
approximately 800<br />
spaces<br />
• Hold areas for taxicabs<br />
(8 spaces) and<br />
limousines (3 spaces)<br />
are provided along the<br />
inbound roadways<br />
Existing ground transportation facilities are shown in Figure 8.<br />
There are four categories of ground transportation facilities :<br />
• Parking – two garages, five surface lots, and hold lots<br />
• Roadways – Cowles Drive and Duck Pond Road<br />
• Curbsides – two pick-up/drop-off areas at terminal<br />
• Rental Cars – close-in lots and a remote service area<br />
Parking<br />
A summary of the available parking facilities are shown in Table<br />
4. Two facilities are available for close-in short-term public<br />
parking (341 spaces). Three facilities, including two parking<br />
garages and their connectors, are available for close-in longterm<br />
public parking (1,732 spaces). Four economy surface lots<br />
are available for public parking (2,185 spaces) and are served<br />
by an Airport shuttle bus. Additionally, three off-airport parking<br />
companies operate approximately 800 spaces for public<br />
parking. A 273 space lot, north of the terminal complex, is<br />
provided for employee parking. Lastly, separate hold areas<br />
along the inbound roadways are reserved for taxicabs queuing<br />
(8 spaces) and limousines waiting for passengers (3 spaces).<br />
Table 4<br />
Overview of Parking Facilities<br />
Des Moines International Airport<br />
Short-Term Parking Spaces<br />
North Garage Level 1 243<br />
Short-Term Surface Lot 98<br />
Total 341<br />
Long-Term Parking Spaces<br />
North Garage Levels 2-4 699<br />
Long-Term Surface Lot 280<br />
South Garage Lvls 1-4* 675<br />
Garage Connectors 78<br />
Total 1,732<br />
*The majority of Level 1 of the<br />
South Garage is dedicated to<br />
rental cars, with 18 spaces<br />
dedicated to public parking<br />
Economy Parking Spaces<br />
Lot #1 848<br />
Lot #2 658<br />
Lot #3 379<br />
Lot #4 300<br />
Total 2,185<br />
Employee Parking Spaces<br />
Total 273<br />
Off-Airport Parking Spaces<br />
Keck Lot 500<br />
Jet Parking 150<br />
1st Class Lot 150<br />
Total 800<br />
Figure 8<br />
Ground Transportation Facilities Overview<br />
Des Moines International Airport<br />
17<br />
TERMINAL AREA CONCEPT PLAN TECHNICAL REPORT<br />
Des Moines International Airport
Ground Transportation Facilities and Conditions<br />
Roadways<br />
KEY POINTS<br />
• <strong>Terminal</strong> access is via<br />
Cowles Drive<br />
• Access to Cowles drive is<br />
primarily via Fleur Drive<br />
and secondary access is<br />
via Duck Pond Road<br />
• The existing roadways<br />
do not have capacity<br />
constraints, however,<br />
there are a variety of<br />
operational and safety<br />
concerns:<br />
— Two Lane Roads<br />
— Intersections<br />
— Decision Distances<br />
— Two-Way Decision<br />
Points<br />
— Channelization<br />
— Prioritized Access<br />
Route<br />
The roadway network for the terminal complex is shown in Figure 9. The<br />
passenger terminal is accessed via a roadway loop, Cowles Drive, accessed<br />
primarily via Fleur Drive, a major north-south arterial. There are two<br />
entrances , a channelized right turn and an un-signalized left turn off Fleur<br />
Drive. The Airport exit intersection with Fleur Drive is signalized.<br />
Secondary access to Cowles Drive is provided via Duck Pond Road, which<br />
parallels Fleur Drive from McKinley Drive on the north to Army Post Road<br />
on the South. To the South, the road becomes South Frontage road, wraps<br />
around the Runway 31 threshold, and provides access to Economy Lot #4<br />
and the Rental Car QTA. On the north side, the road wraps around the<br />
Runway 23 threshold and provides access to the general aviation complex.<br />
Cowles Drive does not have any capacity constraints. However, several<br />
airport roadway planning, operational, and safety considerations are<br />
discussed below. These issues are also identified in Figure 9.<br />
Maintain two lanes on inbound/outbound roadways – Primary access<br />
roadways should be at least two-lanes wide to avoid a single point of<br />
failure due to a traffic incident or similar event.<br />
Avoid intersections in final vehicular approach and exit – Drivers at<br />
airports are often unfamiliar with the roadways and can be distracted.<br />
Intersections on the Airport’s primary access road become safety hazards<br />
and congestion points. Cowles Drive has two intersections.<br />
Provide appropriate distances between ‘decision points’ – Airports should<br />
be particularly careful to provide appropriate distances between decision<br />
points. Short decision distances become safety hazards and congestion<br />
points. At three locations within the Cowles Drive loop, decision distances<br />
are sub-standard.<br />
Decision points should be limited to two options/routes – Decision points<br />
should be limited to two-way decisions, where drivers only choose<br />
between two options/routes. After the curbsides on Cowles Drive, there is<br />
a four-way decision point between two rental car lots, Economy Lot #3,<br />
and the main exit route.<br />
Create well defined channelization from toll booths and merges – At toll<br />
plazas and merging lanes there should be a well defined channelization.<br />
The existing public parking exit plaza has six lanes simultaneously merging<br />
into a single lane at Cowles Drive.<br />
Prioritize access route – Airport entrances should have prioritized access.<br />
The northbound entrance to the Airport does not have a signal; entering<br />
traffic must continually yield to southbound traffic on the busy Fleur Drive.<br />
Figure 9<br />
Airport Roadway Operational Issues<br />
Des Moines International Airport<br />
18<br />
TERMINAL AREA CONCEPT PLAN TECHNICAL REPORT<br />
Des Moines International Airport
Existing Ground Transportation Facilities and Conditions<br />
Curbsides<br />
KEY POINTS<br />
• The inner curbside is 545<br />
linear feet and is<br />
dedicated to private<br />
vehicles<br />
• The outer curbside is<br />
571 linear feet and is<br />
allocated for use among<br />
commercial vehicles<br />
• Vehicular traffic counts<br />
were collected in April<br />
2013 and serve as the<br />
basis for traffic analysis<br />
in the study<br />
There are two curbsides running parallel to the face of the<br />
terminal building. Their allocation is shown in Figure 10:<br />
Inner Curbside is dedicated to use by private (non-commercial)<br />
vehicles. The length of the inner curbside is 545 linear feet.<br />
The front half of the curbside runs parallel to the ticketing<br />
lobby, and as such, is typically used for drop-offs. The second<br />
half of the inner curbside runs parallel to the baggage claim<br />
hall, and as such, is typically used for pick-ups.<br />
Outer Curbside is used for commercial vehicle drop-off and<br />
pickup. It is used by charter buses, taxi cabs, limousines,<br />
courtesy (hotel off-airport parking) shuttles, and the Airport<br />
parking shuttle. The total length of the outer curbside is 571<br />
linear feet. The outer curbside is accessed to/from the<br />
terminal building via four crosswalks.<br />
Traffic Volumes are shown in Table 5. This data was collected<br />
in April 2013. The Inner and Outer curbsides are analyzed<br />
separately. The peak daily volume was 692 vehicles for the<br />
inner curbside (Sunday) and 684 vehicles for the outer<br />
curbside (Monday).<br />
Hotel Van/<br />
Off Airport Airport<br />
Daily Commercial Daily Private<br />
Day Taxi<br />
Limo<br />
Other<br />
Shuttle<br />
Parking Shuttle Shuttle<br />
Vehicle Total Total<br />
Mon 262 139 16 79 177 11 684 571<br />
Tues 189 168 11 77 171 11 627 489<br />
Wed 186 156 27 90 171 4 634 527<br />
Thu 214 146 13 80 177 10 640 626<br />
Fri 228 154 4 68 172 9 635 626<br />
Sat 135 122 7 70 161 9 504 477<br />
Sun 194 113 14 78 169 8 576 692<br />
TOTAL 1,408 998 92 542 1,198 62 4,300 4,008<br />
Avg. per Day 201 143 13 77 171 9 614 573<br />
Source: Des Moines International Airport, April 2013<br />
Table 5<br />
Vehicle Traffic Counts<br />
Des Moines International Airport<br />
Figure 10<br />
Curbside Allocation<br />
Des Moines International Airport<br />
Source: Des Moines International Airport, 2013<br />
19<br />
TERMINAL AREA CONCEPT PLAN TECHNICAL REPORT<br />
Des Moines International Airport
Ground Transportation Facilities<br />
Rental Cars<br />
KEY POINTS<br />
• Rental car facilities are<br />
divided into three<br />
distinct components:<br />
(A) customer service<br />
area, (B) ready-return<br />
facilities, and (C) the<br />
quick-turnaround (QTA)<br />
facility<br />
• Seven rental car brands<br />
are currently located on-<br />
Airport<br />
• The existing customer<br />
service area is 3,345 sq.<br />
ft. in the passenger<br />
terminal<br />
• There are three parking<br />
lots used for readyreturn<br />
in the terminal<br />
complex, providing 370<br />
standard parking spaces<br />
• The QTA is 4 acres and<br />
includes wash bays, light<br />
maintenance bays, fuel<br />
pumps, and stacking /<br />
storage space<br />
• 700 spaces in Economy<br />
Lot #4 are leased to the<br />
rental car companies to<br />
supplement their<br />
stacking / storage needs<br />
The rental car operation can be divided into three primary components: (A) customer service<br />
area, (B) ready-return spaces, and (C) the quick-turnaround (QTA) facility. While each of the<br />
facilities is evaluated separately, the facilities operate in unison and the demand/capacity on one<br />
facility can greatly impact the demand/capacity of its counterparts.<br />
There are currently seven rental car brands located on-Airport. Hertz, Enterprise, and National-<br />
Alamo control nearly 70% of the market between them. Dollar-Thrifty, Avis, Advantage, and<br />
Budget make up the remaining 30% of the market (ordered from largest market share to lowest).<br />
Customer Service <strong>Area</strong><br />
The rental car customer service area is located in the terminal building, adjacent to the baggage<br />
claim carousels. The three largest brands (by revenue market share) lease 400 square feet suites<br />
while the four smaller brands lease 290 square feet suites. The suites are comprised of a<br />
ticketing counter area and a back office. A queuing area is provided for each suite. The total<br />
area in the terminal building designated to the rental car customer service function is 3,345<br />
square feet.<br />
Ready-Return Facilities<br />
Ready stalls are where vehicles are parked to await pick-up by a customer. Ready stalls are<br />
designed similar to public parking stalls. Return stalls are where customers return their vehicles.<br />
The Airport has three ready-return facilities, which are shown in Figure 11. Rental Lot #1 (104<br />
spaces) is adjacent to the south side of the terminal. Rental Lot #2 (98 spaces) is immediately<br />
south of the South Garage. Level 1 of the South Garage (168 spaces) is also leased to the rental<br />
cars. There are a total of 370 standard parking stalls leased to the rental car companies.<br />
Quick-Turn Around Facility<br />
The QTA is located approximately ½ mile south of the passenger terminal complex. The QTA<br />
contains five car wash bays, seven light maintenance bays, 20 fuel pumps, and approximately<br />
95,000 sq. ft. of stacking and storage space (see Figure 12). Each brand is assigned a light service<br />
bay. The car washes and fuel pumps are common-use facilities. The stacking/storage space is<br />
allocated in accordance with revenue market share. Combined, the QTA complex is<br />
approximately four acres.<br />
The new Economy Lot #4 is adjacent to the QTA. Currently, the rental car companies lease 700 of<br />
the 1,000 spaces in the lot. For storage, the brands stack vehicles nose-to-tail, allowing for the<br />
storage of more than 1,100 vehicles in this area.<br />
Figure 11<br />
Existing Rental Car Ready-Return Facilities<br />
Des Moines International Airport<br />
Figure 12<br />
Existing Rental Car Quick-Turn Around Facility<br />
Des Moines International Airport<br />
20<br />
TERMINAL AREA CONCEPT PLAN TECHNICAL REPORT<br />
Des Moines International Airport
Air Cargo Facilities<br />
Main Cargo <strong>Area</strong> in South Quadrant<br />
The Airport currently operates a split air cargo operation. On<br />
the east quadrant (see Figure 4), and located to the south of<br />
the existing passenger terminal are the original air cargo<br />
facilities including belly cargo. The remaining air cargo<br />
operations are located in the south air cargo area, to the south<br />
of the runway intersection, shown on Figure 13.<br />
Table 6 tabulates facility data, including building number,<br />
descriptions and building square footage for air cargo and other<br />
airport facilities.<br />
Airport<br />
Building<br />
Number<br />
South Cargo <strong>Area</strong><br />
The existing air cargo apron occupies approximately 43 acres<br />
of pavement area. Two major all-cargo carriers, (UPS) and<br />
FedEx, operate out of this facility. UPS currently operates out<br />
of buildings 31 and 32 with their sorting facility in Building 35.<br />
FedEx handles its express freight service and air mail through<br />
an exclusive contract with the United States Postal Service.<br />
Table 6<br />
Existing South Quadrant Facilities<br />
Des Moines International Airport Figure 13<br />
Building Description<br />
Sources: 2011 Airport Layout <strong>Plan</strong>, Foth Infrastructure & Environment.<br />
2007 Master <strong>Plan</strong> report.<br />
Building <strong>Area</strong><br />
(square feet)<br />
28 Consolidated Rental Car Facility 19,700<br />
29 Aircraft Maintenance Building 79,250<br />
30 ALSF Substation Building 1,630<br />
31 South Cargo Building 12,300<br />
32 South Cargo Building 28,000<br />
33 Small Office / Hangar 9,720<br />
34 Multi Tenant Hangar 16,250<br />
35 Cargo Air Sort & Office Building (UPS) 27,350<br />
36 South Executive "T" Hangar 12,150<br />
37 South GA "T" Hangar 21,000<br />
38 South GA Pilot <strong>Plan</strong>ning Building 150<br />
39 South GA "T" Hangar 21,000<br />
40 South GA Corporate Hangar 7,800<br />
43 Airport Sand/Salt Storage Facility 10,430<br />
44 Airport Snow Equipment Storage Building 23,250<br />
45 Fuel Farm Facility<br />
46 Aircraft Maintenance Building 15,900<br />
46A Pole Barn (Temporary) 1,640<br />
46B Pole Barn Sand Storage (Temporary) 7,180<br />
46C Pole Barn (Temporary) 4,600<br />
46D Garage (Temporary) 1,250<br />
47 Field Maintenance Storage Building 17,530<br />
49 Airport South IDF Building 270<br />
50 Ag / Chemical Storage Building 390<br />
51 Airport Carpentry Shop 1,340<br />
52 Storm Water Control Building 65<br />
53 Deicer / Water Metering Building 65<br />
54 UPS Deicer Building 130<br />
East Cargo <strong>Area</strong><br />
South Quadrant Overview<br />
Des Moines International Airport<br />
The east cargo apron area is approximately 8 acres, located<br />
directly south of the existing passenger terminal complex, as<br />
shown on Figure 4. United Airlines currently leases a portion of<br />
Building 5 to handle their belly cargo operation. The Federal<br />
Inspection Facility occupies Building 2. Its primary function is to<br />
perform inspections on cargo merchandises. No international<br />
commercial passenger screening is currently performed.<br />
21<br />
TERMINAL AREA CONCEPT PLAN TECHNICAL REPORT<br />
Des Moines International Airport
General Aviation and Support Facilities<br />
General Aviation Spread Out Over Three Quadrants<br />
General aviation (GA) facilities are spread out across three<br />
different quadrants on the Airport. Figure 14 and Table 7<br />
shows data and facilities located in the north quadrant. Figure<br />
4 shows general aviation facilities located in the east quadrant,<br />
and Figure 13 shows hangar facilities in the south quadrant.<br />
North Quadrant<br />
The biggest GA tenant on the north quadrant, located<br />
northwest of Runway 23, is Elliott Aviation. Elliott operates<br />
several commercial hangars with adjoining office spaces within<br />
the central complex. It occupies approximately nine acres of<br />
ramp area.<br />
Meredith Corporation, Principal Financial, and Mid America Jet<br />
Center also occupy a portion of the general aviation facilities<br />
located east of Elliott Aviation.<br />
To the west of Elliott Aviation is the Federal Aviation<br />
Administration’s (FAA) Airport Traffic Control Tower (ATCT),<br />
accessible from McKinley Avenue. On the north side of<br />
McKinley Avenue is the FAA Airway Facility Sector Office. The<br />
Aircraft Rescue and Fire Fighting (ARFF) facility is located south<br />
of Elliott Aviation.<br />
Table 7<br />
Existing North Quadrant Facilities<br />
Des Moines International Airport<br />
East Quadrant<br />
North of the existing passenger terminal complex are FBOs<br />
Signature Flight Support, and Des Moines Flying Services.<br />
Cowles Drive, the main terminal access roadway, serves as the<br />
public access ways to these tenants.<br />
Figure 14<br />
North Quadrant Overview<br />
Des Moines International Airport<br />
South Quadrant<br />
Located to the west of the UPS sorting facility (Building 35) are<br />
aircraft storage facilities. There are currently two 21,000 square<br />
feet T-hangars (Buildings 37 & 39), one 7,800 square feet<br />
corporate hangar (Building 40), and one 12,150 square feet<br />
executive hangar, served by a surface parking lot, accessible via<br />
South West 28 th Street.<br />
Airport<br />
Building<br />
Number<br />
Building Description<br />
Building<br />
<strong>Area</strong><br />
(square feet)<br />
60 Principal Hangar 19,650<br />
61 Airport North IDF Building 300<br />
62 Meredith Flight Center 22,700<br />
63 Airport Surveillance Radar (FAA Radar Tower) 1,920<br />
64 Jet Center Hangar 22,500<br />
65 Des Moines Schools Aviation Lab 14,400<br />
66 Elliott Flying Service Executive Hangar 32,500<br />
67 Elliott Flying Service FBO Hangars 23,310<br />
69 Elliott Flying Service Hangar 24,200<br />
70 Aircraft Rescue Fire Fighting Facility (ARFF) 15,000<br />
71 Elliott Aviation 37,170<br />
72 FAA Airway Facility Sector 10,200<br />
73 FAA Airport Traffic Control Tower 7,600<br />
Sources: 2011 Airport Layout <strong>Plan</strong>, Foth Infrastructure & Environment .<br />
2007 Master <strong>Plan</strong> report.<br />
22<br />
TERMINAL AREA CONCEPT PLAN TECHNICAL REPORT<br />
Des Moines International Airport
Existing Iowa Air National Guard (IANG) Facilities<br />
The Iowa Air National Guard’s Mission Changed in 2013<br />
KEY POINTS<br />
• Facilities needed to<br />
support the previous<br />
F-16 mission are being<br />
re-examined by the<br />
Airport and Department<br />
of Defense<br />
Airport Building<br />
Number<br />
Table 8<br />
Existing Iowa Air National Guard Facilities<br />
Des Moines International Airport<br />
Building Description<br />
100 Iowa Air National Guard Administration Building<br />
101 IANG Supply<br />
102 IANG Main Gate House<br />
103 IANG Supply<br />
105 IANG Vehicle Transportation<br />
110 IANG Facility<br />
124 IANG Squadron Operations<br />
125 IANG A/C Fuel Systems Maintenance<br />
132 IANG Civil Engineering<br />
160 IANG Propulsion Shop<br />
180 IANG Avionics Element<br />
228 IANG Engine Test Pad<br />
229 IANG Test Cell and Propulsion Storage<br />
231 IANG Disaster Preparedness<br />
240 Unknown<br />
251 IANG LIN<br />
252 IANG LOX<br />
270 IANG POL OPS Facility<br />
272 IANG Vehicle Check Point<br />
274 IANG LOX Maintenance<br />
276 IANG Jet Fuel Pumphouse<br />
277 IANG Jet Fuel Pump #1<br />
278 IANG Jet Fuel Pump #2<br />
302 IANG North Gatehouse<br />
310 IANG Security Police Storage<br />
312 IANG Security Police Storage<br />
313 IANG Security / Storage Corrosion Control<br />
314 IANG AGE Shop<br />
315 IANG A/C Corrosion Control<br />
316 IANG Heating <strong>Plan</strong>t Building<br />
319 IANG Pump House for Fire Suppression<br />
320 IANG Munitions Administration & Trailer Maintenance<br />
322 IANG Munitions Maintenance & Inspection<br />
324 IANG Munitions Maintenance<br />
326 IANG Munitions Seg. Magazine Storage<br />
410 IANG Civil Engineering<br />
430 IANG Base Supply<br />
440 IANG Vehicle Maintenance / AGE<br />
Source: 2011 Airport Layout <strong>Plan</strong>, Foth Infrastructure & Environment .<br />
Iowa Air National Guard<br />
The 132 nd Tactical Fighter Wing of the Iowa Air National Guard<br />
(IANG) currently leases approximately 170 acres of airport<br />
property on the north side of the Airport. Their mission<br />
changed in 2013 from F-16 jets to drone operation.<br />
Figure 15<br />
Iowa Air National Guard (IANG) Overview<br />
Des Moines International Airport<br />
The Airport is currently discussing with the IANG which facilities<br />
they will need moving forward, to support their mission.<br />
Figure 15 below and Table 8 to the left indicates land and<br />
facilities that are currently leased to the IANG.<br />
23<br />
TERMINAL AREA CONCEPT PLAN TECHNICAL REPORT<br />
Des Moines International Airport
AVIATION DEMAND FORECAST<br />
• Forecast Approach<br />
• Forecast Summary<br />
• Economic Basis for Airline Traffic<br />
• Historical Aviation Activity<br />
• Aviation Activity Forecasts
Aviation Demand Forecast<br />
Forecast Approach – Summary<br />
KEY POINTS<br />
• Passenger forecasts<br />
were developed using a<br />
variety of analytical<br />
tools to address key<br />
components of aviation<br />
activity.<br />
• Air cargo forecast were<br />
developed based on<br />
recent trends and key<br />
components of air cargo<br />
activity.<br />
• Developed forecasts are<br />
“unconstrained”, i.e., do<br />
not include specific<br />
assumptions of<br />
impediments to aviation<br />
activity growth.<br />
Forecast Approach<br />
• Passenger forecasts were developed using a variety of analytical tools, including trend analysis,<br />
regression models, and market share analysis, to address the key components of aviation activity (i.e.<br />
mainline and regional affiliate, originating and connecting passengers). In addition, recent trends in<br />
airline services in the Des Moines Metropolitan Statistical <strong>Area</strong> (MSA), particularly for low cost carrier<br />
services, were considered in the preparation of the passenger forecast.<br />
• As shown in Figure 16, the forecast approach incorporated a multi-tiered approach to evaluate<br />
passenger traffic in the Des Moines MSA. It was recognized that no one approach would provide input<br />
on all of the key factors that affect passenger and cargo activity in the Des Moines MSA. For example, an<br />
econometric analysis would provide input on the relationships between historical passengers and<br />
regional economic conditions but little to no input on such factors as (1) the role of individual markets in<br />
airline scheduling and service decisions, (2) recent trends in the airline industry that have affected an<br />
airline’s decisions in route planning and aircraft acquisition, and (3) new service development at the<br />
Airport. Input on these factors is important to the development of reliable forecasts that can serve as<br />
the basis for planning efforts at the Airport.<br />
• The air cargo forecasts were developed based on a review of the recent trends, an evaluation of key<br />
components of air cargo activity (i.e. enplaned and deplaned cargo [ freight and mail] for all-cargo and<br />
passenger airlines).<br />
• The aircraft operations forecast were derived from the forecasts of passenger and cargo activity for the<br />
Airport. Forecasts of aircraft operations were developed by (1) disaggregating the total demand into the<br />
components (i.e. mainline and regional affiliate) and (2) making assumptions about average aircraft size<br />
in terms of seats per departure and average enplaned passenger load factors (percentage of seats<br />
occupied, on average) for future years. In addition, the future aircraft fleet plans of the airlines serving<br />
<strong>DSM</strong> were also considered based on available information.<br />
• The forecasts are “unconstrained” and, therefore, do not include specific assumptions about physical,<br />
regulatory, environmental, or other impediments to aviation activity growth.<br />
Figure 16<br />
Multi-Tiered Forecast Approach<br />
Des Moines International Airport<br />
25<br />
TERMINAL AREA CONCEPT PLAN TECHNICAL REPORT<br />
Des Moines International Airport
Aviation Demand Forecast<br />
Forecast Approach – Air Service Region<br />
KEY POINTS<br />
• Future airline traffic<br />
trends at the Airport<br />
were based on statistics<br />
for the Des Moines<br />
MSA.<br />
• <strong>DSM</strong>’s overall catchment<br />
area is estimated to<br />
include 2.7 million<br />
people, averaging 0.59<br />
passengers trips per<br />
person in 2012.<br />
• As shown on Figure 17, a 50-mile radius centered at the Airport encircles the Des Moines<br />
MSA consisting of Polk, Dallas, Warren, Des Moines and Guthrie counties in Iowa. Because<br />
economic growth and activity within this area stimulate a significant portion of passenger<br />
demand at the Airport, statistics for the Des Moines MSA were used to evaluate certain<br />
long-term and future airline traffic trends at the Airport.<br />
• The secondary area served by the Airport, which includes many of the counties<br />
surrounding the Des Moines MSA, is defined by the location of and driving distance to<br />
other air carrier airports, as well as by the availability, price, and quality of airline service at<br />
those other airports. The overall catchment area for the Airport, as shown by the reddashed<br />
line on Figure 17, is defined by the Omaha International Airport, the northwest<br />
boundary of Highway 71, the Mason City Municipal Airport, Dubuque Regional Airport,<br />
and Kirksville Regional Airport.<br />
• <strong>DSM</strong>’s overall catchment area is estimated to include 2.7 million people (see Table 9). In<br />
2012, a total of 1.6 million passengers were enplaned at the airports in the <strong>DSM</strong>’s overall<br />
catchment area, average 0.59 passengers trips per person in 2012.<br />
Figure 17<br />
Airports Service Region<br />
Des Moines International Airport – September 2013<br />
Table 9<br />
Enplaned Passengers at Commercial Service Airports in <strong>DSM</strong> Catchment <strong>Area</strong><br />
26<br />
TERMINAL AREA CONCEPT PLAN TECHNICAL REPORT<br />
Des Moines International Airport
Aviation Demand Forecast<br />
Economic Basis for Airline Traffic – Historical and Forecast Economic Activity<br />
KEY POINTS<br />
• Economic activity in the<br />
Des Moines MSA is<br />
directly linked to the<br />
production of goods and<br />
services in the world,<br />
State, and nation. Both<br />
airline travel and the<br />
movement of cargo<br />
through the Airport<br />
depend on the economic<br />
linkages between and<br />
among the regional,<br />
national, and<br />
international<br />
economies. The Des<br />
Moines MSA is a major<br />
business and<br />
government center in<br />
Iowa.<br />
Figure 18<br />
Trends in Nonagricultural Employment<br />
Figure 19<br />
Non-agricultural Employment<br />
Figure 20<br />
Monthly Unemployment Trends<br />
Population The population of the Des Moines MSA<br />
increased an average of 1.5% per year between 1990 and<br />
2000 and 1.7% per year between 2000 and 2012, faster than<br />
population growth for the State and nation. Population in<br />
the Des Moines MSA is projected by Woods & Poole to<br />
increase an average of 1.1% per year between 2012 and<br />
2032, faster than growth forecast for the State (an average<br />
increase of 0.4% per year) and the nation (an average<br />
increase of 1.0% per year) during the same period.<br />
Nonagricultural Employment Since 1990, nonagricultural<br />
employment in the Des Moines MSA increased at average<br />
annual growth rates higher than those for the State and<br />
nation, as shown on Figure 18. Nonagricultural employment<br />
in the Des Moines MSA expanded during the 1990s,<br />
increasing an average of 2.2% per year between 1990 and<br />
2000, compared with slower growth between 2000 and<br />
2012 (an average of 0.9% per year). During the most recent<br />
recession, nonagricultural employment in the Des Moines<br />
MSA was less affected than in the State and the nation as a<br />
whole. In 2012, nonagricultural employment in the Des<br />
Moines MSA increased 2.2%, faster than that for the State<br />
(1.5%), and the nation (1.7%). Nonagricultural employment<br />
in the Des Moines MSA and the nation is projected by<br />
Woods & Poole to increase an average of 1.5% per year<br />
between 2012 and 2032, faster than growth forecast for the<br />
State (an average increase of 1.0% per year) and the nation<br />
(an average increase of 1.3% per year) during this period.<br />
Per Capita Personal Income From 2000 to 2011 (the most<br />
recent year for which data are available), per capita personal<br />
income (in 2005 constant dollars) in the Des Moines MSA<br />
increased an average of 0.6% per year, following strong<br />
growth between 1990 and 2000 (an average increase of<br />
1.7% per year), as shown in Table A-2 in the Appendix. In<br />
2011, the Des Moines MSA’s per capita personal income<br />
was 9.3% and 8.2% higher, respectively, than that for the<br />
State and the nation. Per capita personal income in the Des<br />
Moines MSA is projected by Woods & Poole to increase an<br />
average of 1.4% per year between 2011 and 2032.<br />
Nonagricultural Employment by Industry Sector<br />
Figure 19 shows a comparative distribution of<br />
nonagricultural employment by industry sector for the<br />
Des Moines MSA in 2000 and in 2012, and for the State<br />
and the nation in 2012. Employment in services<br />
(53.3%)—including business, education, health, and<br />
other services, such as leisure and hospitality—and<br />
trade (16.7%) accounted for 70.0% of total<br />
nonagricultural employment in the Des Moines MSA in<br />
2012. The government sector accounted for 13.0% of<br />
Des Moines MSA nonagricultural employment in 2012,<br />
reflecting the role of Des Moines as the capital of the<br />
State of Iowa.<br />
Unemployment Rates In addition to the employment<br />
trends cited above, the unemployment rate is also<br />
indicative of the general economic climate. Figure 20<br />
shows comparative annual unemployment rates in the<br />
Des Moines MSA, the State, and the nation as a whole<br />
for 2000 through 2012. Unemployment rates in the Des<br />
Moines MSA and the State have historically remained<br />
lower than national rates. In 2012, the unemployment<br />
rate in the Des Moines MSA and the State was 5.3%<br />
and 5.2%, respectively, lower than that for the nation<br />
(8.1%).<br />
Since the end of the current recession in June 2009,<br />
monthly unemployment rates in the Des Moines MSA,<br />
the State, and the United States have generally<br />
decreased, with month to month variations, as shown<br />
on Figure 3. In July 2013, the Des Moines MSA<br />
unemployment rate was 4.6%, less than that for the<br />
State (4.7%), and lower than the nation (7.7%).<br />
27<br />
TERMINAL AREA CONCEPT PLAN TECHNICAL REPORT<br />
Des Moines International Airport
Aviation Demand Forecast<br />
Economic Basis for Airline Traffic – Industry Clusters and Tourism<br />
KEY POINTS<br />
• The economies of the<br />
Des Moines MSA and<br />
Iowa as a whole are<br />
driven by companies<br />
that export goods and<br />
services nationally and<br />
globally, bringing in new<br />
investment and jobs<br />
that support economic<br />
growth as well as air<br />
service development.<br />
Bioscience<br />
Logistics<br />
Financial Services<br />
Data Centers<br />
Table 10<br />
Greater Des Moines Region<br />
Top 20 Largest Employers in 2013<br />
Industry Clusters<br />
Companies that make up industry clusters, also referred to as the "traded<br />
sector", tend to cluster because they draw competitive advantage from<br />
their proximity to competitors, to a skilled workforce, to specialized<br />
suppliers, and to a shared base of sophisticated knowledge about their<br />
industry.<br />
According to the Greater Des Moines Partnership*, there are four industry<br />
clusters in the Des Moines MSA:<br />
Bioscience. Iowa State University (ISU), located 30 miles north of Des<br />
Moines in Ames, anchors the northern end of the Iowa innovation and<br />
bioeconomy corridor (between Ames and Des Moines). ISU is home to four<br />
major bioscience research centers. In addition to ISU’s research centers,<br />
the National Animal Disease Center located in Ames, Iowa, is the largest<br />
federal animal disease center in the United States. The Center conducts<br />
research to solve animal health and food safety problems faced by<br />
livestock producers and the public.<br />
Logistics. Located at the crossroads of Interstates 80 and 35, Des Moines is<br />
centrally located with easy access to the coasts and borders. Des Moines’<br />
Foreign Trade Zone (#107) is located near Interstate 80 and 35, just a few<br />
miles from the Airport, and provides the facilities for importing, assembling<br />
with other components, repackaging, and exporting without going through<br />
formal customs procedures. The Des Moines MSA is served by Burlington<br />
Northern Santa Fe, Iowa Interstate, Norfolk Southern, and Union Pacific<br />
Railroads and is home to 60 national and regional trucking companies.<br />
Financial Services. According to the Iowa Economic Development<br />
Authority*, the city of Des Moines has the highest concentration of<br />
employment in financial services in the United States. As shown on<br />
Table 10, financial services and insurance companies are among the largest<br />
employers in the Des Moines MSA, including Wells Fargo and Company,<br />
Principal Financial Group, Nationwide/Allied Insurance, Marsh, and Aviva.<br />
Tourism<br />
According to the U.S. Travel Association**, domestic<br />
traveler spending in Iowa totaled $7.6 billion in 2012,<br />
representing an increase of 5.6% from 2011. Polk County,<br />
including the city of Des Moines, led all counties in<br />
domestic traveler expenditures, payroll income and jobs<br />
directly generated by these expenditures in 2012.<br />
Domestic traveler expenditures in Polk County reached<br />
over $1.7 billion in 2012, accounting for 22.8% of the<br />
state total. These expenditures generated $308.9 million<br />
in payroll income and 15,600 jobs for Polk County<br />
residents.<br />
The Iowa Events Center is located in downtown Des<br />
Moines and consists of the Community Choice Credit<br />
Union Convention Center (previously known as the<br />
Veterans Memorial Auditorium), the existing Polk County<br />
Convention Complex, the new Hy‐Vee Hall, and the new<br />
Wells Fargo Arena. In addition, the Iowa State<br />
Fairgrounds, located in eastern Des Moines, hosted more<br />
than 1 million visitors to the annual Iowa State Fair over<br />
an 11‐day period in 2012.<br />
** U.S. Travel Association, “The Economic Impact of Travel on<br />
Iowa Counties, 2012”, A Study Prepared for the Iowa<br />
Economic Development Authority Iowa Tourism Office,<br />
August 2013.<br />
Data Centers. Iowa’s favorable tax environment, low cost of power, and<br />
central geographical location have attracted the data centers for major<br />
corporations such as Google, Facebook, and Microsoft Corporation. In<br />
addition, companies that provide information technology services to<br />
businesses are located in the Des Moines MSA, including EdgeBCC, Vital<br />
support Systems, and Iowa Network Services.<br />
* The Greater Des Moines Partnership is the economic and community<br />
development organization serving the Greater Des Moines metro covering a<br />
eight‐county region (Dallas, Guthrie, Jasper, Madison, Marshall, Polk,<br />
Poweshiek, and Warren).<br />
28<br />
TERMINAL AREA CONCEPT PLAN TECHNICAL REPORT<br />
Des Moines International Airport
Aviation Demand Forecast<br />
Economic Basis for Airline Traffic – Economic Outlook<br />
KEY POINTS<br />
• The economic outlook for<br />
the United States, the<br />
State of Iowa, and the<br />
Des Moines MSA forms a<br />
basis for anticipated<br />
growth in airline traffic at<br />
the Airport.<br />
• Factors expected to<br />
contribute to continued<br />
economic growth in the<br />
Des Moines MSA and<br />
associated increases in<br />
airline travel include<br />
(1) diversity in the<br />
economic base, which<br />
lessens its vulnerability<br />
to weaknesses in<br />
particular industry<br />
sectors, (2) growth in the<br />
Des Moines MSA industry<br />
clusters as described<br />
earlier, (3) generally<br />
lower labor and living<br />
costs compared with<br />
those in other similarly<br />
sized cities in the nation<br />
and other metropolitan<br />
areas in the Midwest,<br />
(4) an educated labor<br />
force able to support the<br />
development of<br />
knowledge‐based and<br />
service industries, and<br />
(5) continued<br />
reinvestment to support<br />
the development of<br />
tourism, conventions,<br />
and other businesses.<br />
Global Economy Globalization of the world economy has<br />
created linkages between national economies that relate not<br />
only to trade but also to airline travel. The Des Moines MSA and<br />
the State have strong linkages to the global economy through a<br />
number of industry sectors such as bioscience, financial services,<br />
and information technology. The economic growth of world<br />
regions, in terms of gross domestic product (GDP), is directly<br />
related to the growth in airline travel. Projections of GDP for the<br />
world regions are shown in Table 11. In emerging economies<br />
such as Brazil, India, and China with strong growth in GDP<br />
combined with a growing middle class, the growth in passenger<br />
traffic has been significant. Continued growth in the economies<br />
of the world regions most closely aligned with the Des Moines<br />
MSA economy and airline service at the Airport are expected to<br />
contribute to continued growth in passenger traffic at the<br />
Airport.<br />
U.S. Economy The U.S. economy continues to recover from the<br />
most recent financial crisis and global recession, although the<br />
pace of the recovery remains slow. The consensus among<br />
economists is that downturns following financial crises tend to be<br />
more prolonged than other downturns. In addition, such<br />
recessions raise the level and duration of unemployment, reduce<br />
the number of hours that employees work, and dampen<br />
investment. Continued high unemployment, lower disposable<br />
incomes, and reduced spending by businesses and consumers,<br />
particularly in the near term, have the potential to dampen<br />
growth in the U.S. economy and passenger traffic nationally and<br />
at the Airport.<br />
The Congressional Budget Office (CBO) expects that U.S.<br />
economic growth, as measured by U.S. GDP in constant dollars,<br />
will increase 1.4% in 2013, reflecting an ongoing improvement in<br />
underlying economic factors and increases in federal taxes and<br />
reductions in federal spending that will limit growth. U.S. GDP is<br />
expected to increase 3.0% in 2014 and an average of 3.6% per<br />
year between 2013 and 2018. The CBO projects that the<br />
unemployment rate will average 8.0% in the 2013, decrease to<br />
7.6% in 2014, and decrease to 5.5% in 2018. The CBO’s<br />
projections are influenced to a large extent by fiscal policy<br />
specified by current law which resulted in tax increases and<br />
spending cuts in January 2013. In an alternative scenario, the<br />
CBO projects stronger economic growth (an estimated increase<br />
of 2.9% in U.S. GDP in 2013) if some or all of the fiscal<br />
restrictions are removed.<br />
Iowa Economy According to the Iowa Labor Market and<br />
Workforce Information Division, “the Iowa economy is<br />
expected to gain traction by the second half of 2013.” It is<br />
expected that:<br />
• Iowa’s industry sectors will increase hiring in 2013 due<br />
to a better housing market and increased construction<br />
activity.<br />
• In the next few years, Iowa construction projects<br />
include $900 million in construction at the University<br />
of Iowa, $580 million in construction spending in Cedar<br />
Rapids, mostly on public projects, and $600 million for<br />
highway construction and repairs by the Iowa<br />
Department of Transportation.<br />
• Employment in Iowa’s financial industry should<br />
continue to exceed national growth, reflecting an<br />
educated workforce and significantly lower labor costs<br />
compared to other financial hubs.<br />
• Employment in financial services, information<br />
technology, healthcare, and construction is expected to<br />
increase faster than the State average through 2020.<br />
Des Moines MSA Economy The economic drivers of the<br />
Des Moines MSA are diverse and include mature,<br />
stable, and emerging industries. According to a June<br />
2013 Moody's Analytics report:<br />
"The outlook for Des Moines is bright, and its<br />
economy will strengthen as financial services<br />
accelerate, helping to drive consumer spending.<br />
Construction is on the verge of an upswing. Farm<br />
incomes will grow, although at a slower pace, and<br />
the public sector will provide little support.<br />
Long‐term prospects are upbeat: A diverse industrial<br />
base, favorable business costs, and a skilled<br />
workforce lay the foundation for above‐average<br />
growth over the long run."<br />
Table 11<br />
Historical and Projected GDP Growth by World Region<br />
29<br />
TERMINAL AREA CONCEPT PLAN TECHNICAL REPORT<br />
Des Moines International Airport
Aviation Demand Forecast<br />
Aviation Activity Forecast – Passenger Airline Traffic<br />
KEY POINTS<br />
• Forecasts of enplaned<br />
passengers were<br />
developed taking into<br />
account analyses of the<br />
economic basis for<br />
airline traffic, analyses<br />
of historical airline<br />
traffic, and an<br />
assessment of the key<br />
factors that may affect<br />
future airline traffic.<br />
• The number of enplaned<br />
passengers is forecast to<br />
increase from 1,038,484<br />
in 2012 to 2,046,000 in<br />
2032, an average<br />
increase of 3.4% per<br />
year.<br />
Assumptions<br />
• In the long term, changes in airline traffic at the Airport<br />
will occur largely as a function of growth in the<br />
population and economy of the Airport service region<br />
and changes in airline service.<br />
• Continued development of airline service at the Airport<br />
will not be constrained by the availability of aviation fuel,<br />
long‐term limitations in airline fleet capacity, limitations<br />
in the capacity of the air traffic control system or the<br />
Airport, or government policies or actions that restrict<br />
growth.<br />
• Considered recent and potential developments in the<br />
national economy and in the air transportation industry<br />
as they have affected or may affect airline traffic at the<br />
Airport.<br />
For 2013 through 2032, it is assumed that:<br />
• The U.S. economy will recover from the recession and<br />
sustained GDP growth will average between 2.0% and<br />
2.5% per year.<br />
• The economy of the Des Moines MSA would increase at a<br />
rate comparable to that of the nation as a whole.<br />
• A generally stable international political environment<br />
and safety and security precautions will ensure airline<br />
traveler confidence in aviation without imposing<br />
unreasonable inconveniences.<br />
• There would be no major disruption of airline service or<br />
air travel behavior as a result of international hostilities<br />
or terrorist actions.<br />
• Airline scheduling efficiencies and airport operational<br />
procedures would permit accommodation of the<br />
forecast demand.<br />
Enplaned Passenger Forecasts<br />
The number of enplaned passengers is forecast to increase<br />
from 1,038,484 in 2012 to 2,046,000 in 2032, an average<br />
increase of 3.4% per year (see Figure 21 and Table 12).<br />
The forecast of enplaned passengers are based on (1) the<br />
regression analysis and independent forecast of the key<br />
variables, (2) an evaluation of low-cost carrier service<br />
expansion at <strong>DSM</strong>, and (3) an assessment of the <strong>DSM</strong><br />
catchment area and the additional passengers that could<br />
be capture through the forecast period.<br />
Figure 21<br />
Historical and Forecast Enplaned Passengers<br />
Des Moines International Airport<br />
Table 12<br />
Historical and Forecast Enplaned Passengers<br />
Des Moines International Airport<br />
• The Airport will continue to be the principal airport<br />
serving the Des Moines MSA, the overall <strong>DSM</strong> catchment<br />
area, and the State of Iowa.<br />
• Passenger traffic growth at the Airport will continue to be<br />
supported by local businesses with a continued demand<br />
for national and global connectivity.<br />
• Competition among the airlines serving the Airport and<br />
the Des Moines MSA will ensure the continued<br />
availability of competitive airfares.<br />
• The price of oil and aviation fuel would remain at<br />
historically high levels but would not return to the prices<br />
experienced in 2008.<br />
30<br />
TERMINAL AREA CONCEPT PLAN TECHNICAL REPORT<br />
Des Moines International Airport
Aviation Demand Forecast<br />
Aviation Activity Forecast – Air Cargo<br />
KEY POINTS<br />
• Regression analysis for<br />
air cargo activity at <strong>DSM</strong><br />
is not meaningful, since<br />
it has been driven more<br />
by the business plans of<br />
all-cargo airlines than<br />
economic activity in the<br />
Des Moines MSA.<br />
• Therefore, it is assumed<br />
that air cargo at the<br />
Airport would increase<br />
at rates comparable to<br />
the growth in the<br />
population of the Des<br />
Moines MSA, an average<br />
increase of 0.8% per<br />
year.<br />
As shown on Figure 22, total air cargo at <strong>DSM</strong> decreased an<br />
average of 4.3% between 1999 and 2012, with growth<br />
occurring between 2004 and 2006 (an average increase of<br />
5.0% per year) and 2010 and 2012 (an average increase of<br />
8.8%).<br />
The decreases in cargo at the Airport since 1999 are<br />
related to:<br />
• The slowdown in the regional economy related to the<br />
economic recessions in 2011 and 2008‐2009.<br />
• A reduction in available belly‐cargo capacity on<br />
passenger airline aircraft as a result of increases in the<br />
use of regional jet aircraft which have less cargo<br />
capacity than larger air carrier aircraft.<br />
• The availability of reduced‐cost belly‐cargo capacity,<br />
particularly on widebody aircraft designed for<br />
containerized cargo, and direct international freighter<br />
service at other gateway airports, such as Chicago<br />
O’Hare, Los Angeles, and Dallas/Fort Worth<br />
international airports.<br />
• An increasing trend among freight forwarders to bypass<br />
airports and truck cargo to gateways that have available<br />
reduced‐cost belly‐cargo capacity.<br />
Figure 22<br />
Historical Trend Analysis – Total Air Cargo<br />
Des Moines International Airport<br />
Table 13<br />
HISTORICAL AND FORECAST AIR CARGO—BASELINE<br />
Des Moines International Airport<br />
The definition of a regression model to represent air<br />
cargo activity at <strong>DSM</strong> is limited by:<br />
• Continued decreases in air cargo since 1999 which do<br />
not relate to traditional economic indicators such as<br />
Des Moines MSA employment or personal income<br />
which have generally increased between 1999 and<br />
2012<br />
• The data series for air cargo does not capture the<br />
entire cargo market including transport by other<br />
modes<br />
As a result of these limitations, a regression analysis was<br />
not meaningful. <strong>DSM</strong> air cargo trends have been driven<br />
more by the business plans of all‐cargo airlines than<br />
economic activity in the Des Moines MSA. The Airport<br />
has served as a second day hub for UPS but, due to less<br />
than expected demand for its second day product, UPS<br />
plans to transition out of its second day product. As a<br />
result, UPS cargo activity at <strong>DSM</strong> is expected to be<br />
limited.<br />
Therefore, it was assumed that air cargo at the Airport<br />
would increase at rates comparable to the growth in the<br />
population of the Des Moines MSA, an average increase<br />
of 0.8% per year, as shown in Table 13.<br />
• The reorganization and consolidation in the cargo<br />
industry in response to the increase in fuel prices in<br />
2008 and the national economic recession.<br />
Note: The forecasts presented in this figure were prepared using the information and<br />
assumptions given in the accompanying text. Inevitably, some of the assumptions<br />
used to develop the forecasts will not be realized and unanticipated events and<br />
circumstances may occur. Therefore, there are likely to be differences between<br />
the forecast and actual results, and those differences may be material.<br />
CAGR = Compound annual growth rate.<br />
Includes air freight and mail.<br />
Sources: Historical: Des Moines International Airport records.<br />
Forecast: LeighFisher, August 2013.<br />
31<br />
TERMINAL AREA CONCEPT PLAN TECHNICAL REPORT<br />
Des Moines International Airport
Aviation Demand Forecast<br />
Aviation Activity Forecast – Aircraft Operations<br />
KEY POINTS<br />
• Forecasts of aircraft<br />
operations for passenger<br />
and cargo airlines,<br />
general aviation, and<br />
military activity are<br />
presented.<br />
• Total aircraft operations<br />
are forecast to increase<br />
an average of 0.9% per<br />
year from 80,036<br />
operations in 2012 to<br />
96,100 operations in<br />
2032.<br />
Assumptions<br />
• Forecasts of passenger aircraft operations were derived<br />
from forecasts of passengers using assumptions of (1)<br />
average aircraft size, measured by seats per aircraft<br />
operation, and (2) average aircraft utilization, measured in<br />
percentage terms (the “load factor”)<br />
• Assumptions regarding expected changes in aircraft size<br />
and assumed aircraft utilization together result in the<br />
calculation of the number of passengers per aircraft<br />
operation. The projection of aircraft operations is then<br />
derived by dividing the number of passengers by the ratio<br />
of passengers per aircraft operation. Table 14 summaries<br />
the data and assumptions for 2011 through 2032.<br />
Aircraft Operations Forecast Table 15 and Figure 23<br />
summarize the forecasts of total aircraft operations at the<br />
Airport, including commercial, general aviation, and military<br />
aircraft operations.<br />
Total aircraft operations are forecast to increase an average of<br />
0.9% per year from 80,036 operations in 2012 to 96,100<br />
operations in 2032.<br />
Commercial aircraft operations, including air carrier and air taxi<br />
operations, are forecast to increase from 44,200 operations in<br />
2012 to 60,700 operations in 2032, reflecting an increase in the<br />
average number of seats per operation. In 2032, commercial<br />
aircraft operations are forecast to account for approximately<br />
63% of total Airport operations.<br />
Table 15<br />
Historical and Forecast Aircraft Operations<br />
Des Moines International Airport<br />
• Commercial aircraft<br />
operations, including air<br />
carrier and air taxi<br />
operations, are forecast<br />
to increase from 44,200<br />
operations in 2012 to<br />
60,700 operations in<br />
2032, reflecting an<br />
increase in the average<br />
number of seats per<br />
operation.<br />
Table 14<br />
Passenger Airline Aircraft Operations Forecast Assumptions<br />
Des Moines International Airport<br />
Figure 23<br />
Historical and Forecast Aircraft Operations<br />
Des Moines International Airport<br />
• In 2032, commercial<br />
aircraft operations are<br />
forecast to account for<br />
approximately 63% of<br />
total Airport operations.<br />
32<br />
TERMINAL AREA CONCEPT PLAN TECHNICAL REPORT<br />
Des Moines International Airport
Aviation Demand Forecast<br />
Aviation Activity Forecast – Based Aircraft and Aircraft Fleet<br />
KEY POINTS<br />
• Forecasts of based<br />
aircraft at the Airport is<br />
forecast to increase an<br />
average of 0.7% per year<br />
between 2012 and 2032,<br />
consistent with the<br />
growth rates forecast for<br />
the nation as a whole.<br />
• Forecasts of the aircraft<br />
fleet were based on a<br />
2013 base year<br />
distribution of<br />
operations by<br />
equipment type.<br />
Forecasts airline fleet<br />
mix for 2017, 2022,<br />
2027, and 2032 are<br />
presented.<br />
Based Aircraft Forecasts<br />
As shown on Table 16, the number of based aircraft at the<br />
Airport is forecast to increase average of 0.7% per year<br />
between 2012 and 2032, consistent with the growth rates<br />
forecast for the nation as a whole. In the FAA 2012 TAF for the<br />
Airport, the number of based aircraft is forecast to remain<br />
unchanged through 2032.<br />
Table 16<br />
Based Aircraft Forecasts<br />
Des Moines International Airport<br />
Based Aircraft Forecasts<br />
The forecasts of the aircraft fleet were based on a 2013<br />
base year distribution of operations by equipment type<br />
(e.g., Airbus 319, Boeing 737‐800).<br />
The 2013 distribution was developed using a combination<br />
of source data, including: published passenger airline<br />
Table 17<br />
Aircraft Fleet Mix<br />
Des Moines International Airport<br />
schedules; <strong>DSM</strong> airport records, and the FAA’s databases<br />
including the Enhanced Traffic Management System<br />
Counts (ETMSC), Operations Network (OPSNET), and Air<br />
Traffic Activity Data System (ATADS). Historical and<br />
projected distributions are presented in Table 17.<br />
33<br />
TERMINAL AREA CONCEPT PLAN TECHNICAL REPORT<br />
Des Moines International Airport
Aviation Demand Forecast<br />
Aviation Activity Forecast – Comparison with the FAA 2012 TAF<br />
KEY POINTS<br />
• The forecasts are<br />
compared for the<br />
components of total<br />
enplaned passengers,<br />
commercial aircraft<br />
operations, and total<br />
aircraft operations.<br />
• Forecast of enplaned<br />
passengers for <strong>DSM</strong> is<br />
higher than the TAF in<br />
2017 and 2022. The<br />
variance between the<br />
<strong>DSM</strong> enplaned<br />
passenger forecast and<br />
the FAA 2012 TAF is<br />
15.2% in 2017 and<br />
26.8% in 2022.<br />
Table 18<br />
FAA TAF Forecast Comparison<br />
Des Moines International Airport (2012 – 2027)<br />
The <strong>DSM</strong> planning forecasts are outside of the allowed<br />
variance* from the FAA 2012 TAF for the following<br />
reasons:<br />
• Economic and business trends in the Des Moines MSA<br />
discussed in Chapter 2, “Economic Basis for Airline<br />
Traffic” as well as recent traffic trends at <strong>DSM</strong> reflecting<br />
the expansion of low cost carrier service suggest that<br />
<strong>DSM</strong> passenger traffic will increase at a rate faster than<br />
forecast in the FAA 2012 TAF for <strong>DSM</strong> (an average of<br />
1.5% per year) and for the airports in the <strong>DSM</strong><br />
catchment area and adjacent region (an average of 2.4%<br />
per year), as shown in Figure 24.<br />
• Historically, <strong>DSM</strong> has accounted for nearly 30% of<br />
passengers enplaned at the regional airports shown in<br />
Figure 7‐1. In the <strong>DSM</strong> planning forecasts, it is assumed<br />
that <strong>DSM</strong> will increase gradually to 32% during the<br />
forecast period. In the FAA 2012 TAF, <strong>DSM</strong> accounts for a<br />
decreasing share of the passengers enplaned at the<br />
regional airports, as shown in Figure 25.<br />
Figure 24<br />
FAA 2012 TAF for <strong>DSM</strong> Catchment <strong>Area</strong> Airports and<br />
Adjacent Airports (1990-2032)<br />
Figure 25<br />
<strong>DSM</strong> Forecast Share of Regional Enplaned<br />
Passengers (1990-2032)<br />
• Forecast of commercial<br />
operations for <strong>DSM</strong> is<br />
lower than the TAF in<br />
2017 and 2022. The<br />
variance between the<br />
<strong>DSM</strong> commercial<br />
operations forecast and<br />
the FAA 2012 TAF is<br />
12.5% in 2017 and<br />
13.3% in 2022.<br />
• Forecast of total aircraft<br />
operations for <strong>DSM</strong> is<br />
lower than the TAF in<br />
2017 and 2022. The<br />
variance between the<br />
<strong>DSM</strong> total aircraft<br />
operations forecast and<br />
the FAA 2012 TAF is<br />
10.7% in 2017 and<br />
11.1% in 2022.<br />
Table 18 presents a comparison of the aviation activity<br />
forecasts prepared for <strong>DSM</strong> and the FAA 2012 TAF for the<br />
Airport. The forecasts are compared for the components of<br />
total enplaned passengers, commercial aircraft operations and<br />
total aircraft operations. The format of Table 18 is based on<br />
the template provided by the FAA for the comparison of<br />
airport planning forecasts and the FAA TAF. As required, the<br />
results are presented for the base year of 2012 and forecast<br />
horizons years which are equal to the base year, plus 1, 5, 10<br />
and 15 years (2013, 2017, 2022, and 2027).<br />
• In recent years, the number of passengers per<br />
commercial operation has increased at <strong>DSM</strong> as airlines<br />
replace 50‐seat regional aircraft with more fuel efficient<br />
larger aircraft. In the <strong>DSM</strong> planning forecasts, it is<br />
assumed that the number of passengers per commercial<br />
operation will increase an average of 1.5% per year,<br />
reflecting upgauging in airline fleets. In the FAA 2012<br />
TAF, the number of passengers per commercial<br />
operation is forecast to decrease an average of 0.7% per<br />
year, as shown in Figure 26.<br />
* As stipulated in the FAA forecast guidance, the planning<br />
forecasts must “differ by less than 10 percent in the 5‐year<br />
forecast period, and 15 percent in the 10‐year forecast<br />
period”.<br />
Figure 26<br />
Historical & Forecast Passengers per Commercial Operation<br />
Des Moines International Airport<br />
34<br />
TERMINAL AREA CONCEPT PLAN TECHNICAL REPORT<br />
Des Moines International Airport
DEMAND/CAPACITY AND FACILITY REQUIREMENTS ANALYSES<br />
• Passenger <strong>Terminal</strong> Requirements<br />
• Ground Transportation Requirements<br />
• Airfield Requirements<br />
• Cargo, General Aviation, and Support Facility Requirements
Passenger <strong>Terminal</strong> Requirements<br />
Methodology and key assumptions<br />
KEY POINTS<br />
• For the development of<br />
terminal facility<br />
requirements, the ACRP<br />
terminal requirements<br />
model was used. The<br />
ACRP model evaluates<br />
facility requirements of<br />
major functional areas<br />
based on performance<br />
metrics.<br />
• Facility requirements for<br />
the following areas of<br />
the terminal were<br />
determined:<br />
— Apron gates<br />
— Ticketing / Check-in<br />
— Security checkpoint<br />
— Outbound baggage<br />
screening<br />
— Outbound baggage<br />
make-up<br />
— Concessions<br />
— Holdrooms<br />
— Baggage claim<br />
— Restrooms<br />
— Secondary and other<br />
areas<br />
<strong>Terminal</strong> requirements are driven by forecast aviation demand:<br />
• Based on projected levels of passenger activities at 2.5, 3.0 and 4.0 million annual passengers (MAP)<br />
which is expected to occur around 2018, 2027, and 2042, respectively<br />
• Peak period demand derived from the forecast are used as a basis for sizing the facility requirements.<br />
Number of passengers during the peak hour is shown in Figure 27. Rolling hourly enplaned<br />
passengers are shown on Figure 28.<br />
Development of terminal requirements are based on airport data and industry design standards:<br />
• The industry-standard Airport Cooperative Research Program (ACRP) terminal requirements model<br />
are used to assess the facility requirements for each PAL.<br />
• The ACRP model looks at the major functional areas of both airside and landside terminal operations<br />
to evaluate the facility requirements based on performance metrics such as targeted passenger wait<br />
time and level of service (LOS). Key assumptions were developed from data provided by the Airport,<br />
as well as data collected at other similar U.S. airports.<br />
Level of Service (LOS) is defined as:<br />
• A qualitative and quantitative measurement of comfort experienced by passengers using the airport<br />
terminal facility. The capacity of each element of a terminal facility can vary depending on the level of<br />
crowding and/or processing time that is considered acceptable. <strong>Terminal</strong> should be designed to<br />
maintain a certain LOS, even during the peak periods of the day, typically chosen as the peak hour of<br />
the average day in the peak month (ADPM). The International Air Transport Association (IATA)<br />
delineates level of service into 6 categories:<br />
1,800<br />
1,600<br />
1,400<br />
1,200<br />
1,000<br />
800<br />
600<br />
400<br />
200<br />
-<br />
Figure 27<br />
Number of Passengers During the Peak Hour<br />
2013 2.5 MAP 3.0 MAP 4.0 MAP<br />
Enplaned passengers Deplaned passengers Total passengers<br />
Figure 28<br />
Rolling Hourly Enplaned Passengers (June 3, 2013)<br />
• MAP stands for Million<br />
Annual Passengers, and<br />
includes enplaning and<br />
deplaning passengers.<br />
• LOS C is typically recommended as a design objective since it denotes good service at a<br />
reasonable investment. Therefore, the facilities for <strong>DSM</strong> are planned for LOS C.<br />
• Some factors that influence LOS for terminal planning are :<br />
– Passenger queuing space<br />
– Target maximum wait time<br />
– Linear frontage (e.g. for baggage claim)<br />
36<br />
TERMINAL AREA CONCEPT PLAN TECHNICAL REPORT<br />
Des Moines International Airport
Required space (sf)<br />
Count (ea)<br />
Passenger <strong>Terminal</strong> Requirements<br />
Summary of findings<br />
KEY POINTS<br />
• Existing facilities for<br />
ticketing, outbound<br />
baggage screening and<br />
make-up, holdrooms,<br />
and restrooms are<br />
inadequate.<br />
• Other terminal facilities,<br />
e.g. apron gates,<br />
security checkpoint, will<br />
be inadequate to meet<br />
forecast demand<br />
between 2.5 MAP and<br />
3.0 MAP.<br />
Most existing terminal facilities will be inadequate to meet forecast<br />
demand between 2.5 MAP and 3.0 MAP (see Figures 29 and 30):<br />
Figure 29<br />
Existing <strong>Terminal</strong> Stress Chart<br />
Figure 30<br />
Existing <strong>Terminal</strong> Stress <strong>Plan</strong><br />
Primary facilities are sized based on the area required for the<br />
functional components, passenger queuing, circulation, and for nonpassengers<br />
(e.g. employees, meeters and greeters, well-wishers)<br />
where applicable.<br />
Secondary facilities (e.g. airline operations, TSA admin/staff support,<br />
ground handling services, facilities support areas) are sized relative<br />
to the primary facilities requirements, and will be included in sizing<br />
the passenger terminal alternatives.<br />
Total space and unit requirements for each of the primary facilities<br />
are summarized on Figures 31 and 32.<br />
45,000<br />
40,000<br />
35,000<br />
30,000<br />
25,000<br />
Figure 31<br />
Total Space Requirements for Primary Facilities<br />
120<br />
100<br />
80<br />
Figure 32<br />
Total Unit Requirements for Primary Facilities<br />
20,000<br />
60<br />
15,000<br />
40<br />
10,000<br />
5,000<br />
20<br />
0<br />
Ticketing Security Outbound<br />
baggage<br />
screening<br />
Outbound<br />
baggage<br />
make-up<br />
Concessions Holdrooms Baggage<br />
claim<br />
Existing Baseline 2.5 MAP 3.0 MAP 4.0 MAP<br />
Restrooms<br />
0<br />
Gates Ticketing positions Security lanes Baggage claim<br />
Existing Baseline 2.5 MAP 3.0 MAP 4.0 MAP<br />
Source: LeighFisher, February 2014. Source: LeighFisher, February 2014.<br />
37<br />
TERMINAL AREA CONCEPT PLAN TECHNICAL REPORT<br />
Des Moines International Airport
Passenger <strong>Terminal</strong> Requirements<br />
Apron gate<br />
KEY POINTS<br />
• Gate requirements are<br />
based on existing gate<br />
utilization and assumes<br />
the pattern will remain<br />
relatively stable<br />
throughout the planning<br />
period. Changes in<br />
passengers per gate<br />
would be due to changes<br />
in fleet seating capacity<br />
and/or passenger load<br />
factors, rather than the<br />
increasing number of<br />
departures per gate.<br />
• Additional gate would<br />
be required by 2.5 MAP.<br />
Three additional gates<br />
would be needed by 3.0<br />
MAP and seven would<br />
be needed by 4.0 MAP.<br />
1.<br />
Activity Forecasts<br />
Annual enplaned passengers<br />
(millions):<br />
• Baseline: 1.1<br />
• 2.5 MAP: 1.25<br />
• 3.0 MAP: 1.5<br />
• 4.0 MAP: 2.0<br />
Annual passenger aircraft<br />
departures (thousands):<br />
• Baseline: 16.9<br />
• 2.5 MAP: 18.5<br />
• 3.0 MAP: 20.9<br />
• 4.0 MAP: 27.6<br />
2.<br />
Assumptions<br />
Target gate utilization:<br />
4.4 daily departures/gate<br />
(based on 2013 ADPM).<br />
Future gate requirements:<br />
Derived based on forecast<br />
annual enplanements and<br />
departures, assuming the<br />
same gate utilization factor<br />
as it is today.<br />
3.<br />
Existing Facilities<br />
Passenger gates:<br />
• 11 NBEG (Narrow-Body<br />
Equivalent Gates)<br />
• All of which are contact<br />
gates with loading<br />
bridges except Gate A5.<br />
4.<br />
Requirements<br />
Passenger gates:<br />
• Baseline: 11<br />
• 2.5 MAP: 12<br />
• 3.0 MAP: 14<br />
• 4.0 MAP: 18<br />
Based on the terminal requirements model results:<br />
• Additional gate would be required by 2.5 MAP, as<br />
shown below.<br />
Table 19<br />
Narrow-Body Equivalent Gates<br />
Source: ACRP <strong>Report</strong> 25, Airport Passenger <strong>Terminal</strong> <strong>Plan</strong>ning<br />
and Design. Volume 1: Guidebook.<br />
Existing Baseline 2.5 MAP 3.0 MAP 4.0 MAP<br />
Apron gate requirements are expressed in terms of the<br />
number of “Narrow-Body Equivalent Gates”:<br />
• Definition of “gate” can vary, this metric is used to<br />
normalize the capacity to that of a typical narrow-body<br />
aircraft gate.<br />
• The amount of space required is based on the maximum<br />
wingspan of aircraft in its respective aircraft group.<br />
• Requirements for different mix of aircraft can be<br />
converted using the factors on Table 19.<br />
38<br />
TERMINAL AREA CONCEPT PLAN TECHNICAL REPORT<br />
Des Moines International Airport
Passenger <strong>Terminal</strong> Requirements<br />
Ticketing / Check-in<br />
KEY POINTS<br />
• Facility requirements for<br />
ticketing / airline checkin<br />
were developed for<br />
the number of staffed<br />
positions and space<br />
required.<br />
• Input data includes an<br />
estimate of how early<br />
the passengers arrive at<br />
the airport before their<br />
scheduled flight time, as<br />
well as the number of<br />
enplaned passengers per<br />
airline during the peak<br />
30-minute period.<br />
• Based on LOS C,<br />
requirements analysis<br />
showed that the existing<br />
queuing space is<br />
insufficient and<br />
additional self-service<br />
kiosks would be needed<br />
by 4.0 MAP.<br />
1.<br />
Activity Forecasts<br />
Average Day Peak Month<br />
peak hour enplaning<br />
passengers (total):<br />
• Baseline: 730<br />
• 2.5 MAP: 853<br />
• 3.0 MAP: 1,022<br />
• 4.0 MAP: 1,396<br />
Average Day Peak Month<br />
peak 30-minute enplaned<br />
passengers (2013):<br />
• American: 67<br />
• Delta: 88<br />
• Frontier: 38<br />
• Allegiant: 80<br />
• United: 114<br />
• US: 47<br />
• Southwest: 53<br />
2.<br />
Assumptions<br />
Check-in preferences (%):<br />
• Kiosks 47<br />
• Counters 30<br />
• Curbside 5<br />
• Offsite 18<br />
• Total 100<br />
Target maximum wait times<br />
for counter positions (min):<br />
8-10<br />
Average processing times<br />
(min/pax):<br />
• Kiosks 2.5<br />
• Counters 3.0<br />
• Curbside 2.0<br />
3.<br />
Existing Facilities<br />
Ticketing positions (ea)<br />
• Kiosks 30<br />
• Counters 54<br />
• Bag drops 25<br />
• Curbside 2<br />
• Total 111<br />
• Includes all available<br />
positions (leased and not<br />
leased).<br />
Ticketing area (sf)<br />
• Counters 1,190<br />
• Queue 1,520<br />
• Curbside 390<br />
• Ticket office 2,530<br />
• Circulation 2,250<br />
• Misc* 4,900<br />
• Total 12,780<br />
*Includes oversize bags,<br />
unused counters and bag<br />
belts<br />
4.<br />
Requirements<br />
Ticketing positions (ea)<br />
• Baseline: 49<br />
• 2.5 MAP: 55<br />
• 3.0 MAP: : 66<br />
• 4.0 MAP: 85<br />
Ticketing area (sf)<br />
• Baseline: 6,650<br />
• 2.5 MAP: 7,700<br />
• 3.0 MAP: 8,970<br />
• 4.0 MAP: 11,700<br />
Based on the terminal requirements model results:<br />
• Insufficient queuing space – deficit of 1,400 square feet–<br />
with the existing layout.<br />
• Additional self-service kiosks would be needed by<br />
4.0 MAP, other ticketing counters (agent, bagdrop,<br />
curbside) will be sufficient throughout the planning<br />
period.<br />
• Detailed requirements for ticketing positions and area<br />
are provided below.<br />
120<br />
100<br />
80<br />
60<br />
40<br />
20<br />
0<br />
14,000<br />
2<br />
25<br />
30<br />
54<br />
Ticketing Positions (ea)<br />
1<br />
12<br />
21<br />
1<br />
13<br />
23<br />
1<br />
16<br />
28<br />
15 18 21<br />
Existing Baseline 2.5 MAP 3.0 MAP 4.0 MAP<br />
Agent Kiosk Bagdrop Curbside<br />
Ticketing <strong>Area</strong> (sf)<br />
1<br />
20<br />
37<br />
27<br />
12,000<br />
10,000<br />
4,898<br />
2,442<br />
8,000<br />
6,000<br />
4,000<br />
2,000<br />
0<br />
2,251<br />
1,311<br />
2,527 1,725<br />
385<br />
70<br />
1,520 2,912<br />
1,553<br />
1,988<br />
70<br />
3,346<br />
1,827<br />
2,363<br />
3,836<br />
4,984<br />
1,194 636 743 878 1,132<br />
70<br />
3,075<br />
Existing Baseline 2.5 MAP 3.0 MAP 4.0 MAP<br />
Counter Queue Curbside<br />
Airline office Circulation Miscellaneous<br />
70<br />
39<br />
TERMINAL AREA CONCEPT PLAN TECHNICAL REPORT<br />
Des Moines International Airport
Passenger <strong>Terminal</strong> Requirements<br />
Security checkpoint<br />
KEY POINTS<br />
• A more conservative<br />
throughput of 170<br />
passengers per hour per<br />
lane was assumed to<br />
plan adequately for<br />
future demand.<br />
• Passengers in the<br />
existing conditions are<br />
processed at one of the<br />
six security screening<br />
checkpoints (SSCPs).<br />
The existing<br />
configuration is<br />
sufficient to guarantee<br />
an acceptable level of<br />
service with maximum<br />
wait time of 20 minutes<br />
until 4.0 MAP, when two<br />
additional lanes would<br />
be required.<br />
1.<br />
Activity Forecasts<br />
Average Day Peak Month<br />
peak 30-minute enplaned<br />
passengers:<br />
• Baseline: 393<br />
• 2.5 MAP: 458<br />
• 3.0 MAP : 549<br />
• 4.0 MAP : 751<br />
• Includes 10% crew/<br />
employees that require<br />
screening.<br />
2.<br />
Assumptions<br />
Target maximum wait times<br />
(minutes): 20<br />
Lane throughput<br />
(pax/lane/hour): 170<br />
Queuing space LOS C<br />
requirement (sf/pax): 12.9<br />
Security lane and spatial<br />
requirement derived using<br />
the peak 30-minute<br />
enplaning passengers based<br />
on queuing model satisfying<br />
the targeted maximum wait<br />
times.<br />
3.<br />
Existing Facilities<br />
Security lanes:<br />
• Regular 4<br />
• Overflow 2<br />
• Total 6<br />
Security space (sf)<br />
• Screening 7,820<br />
• Queue 2,590<br />
• Total 10,410<br />
4.<br />
Requirements<br />
Security lanes:<br />
• Baseline 4*<br />
• 2.5 MAP 5*<br />
• 3.0 MAP 6*<br />
• 4.0 MAP 8*<br />
* Does not include dedicated TSA<br />
Pre-check lane<br />
Security space (sf):<br />
• Baseline 9,380<br />
• 2.5 MAP 11,260<br />
• 3.0 MAP 13,490<br />
• 4.0 MAP 18,250<br />
Based on the terminal requirements model results:<br />
• Existing security queuing space is inadequate by LOS C<br />
standard.<br />
• Two additional checkpoint lanes will be needed by<br />
4.0 MAP.<br />
• Detailed requirements for security lanes and area are<br />
provided below.<br />
9<br />
8<br />
7<br />
6<br />
5<br />
4<br />
3<br />
2<br />
1<br />
0<br />
6<br />
Security Lanes (ea)<br />
4<br />
5<br />
Existing Baseline 2.5 MAP 3.0 MAP 4.0 MAP<br />
6<br />
8<br />
• By 2.5 MAP, it is<br />
estimated that the<br />
security checkpoint<br />
space will become<br />
inadequate.<br />
20,000<br />
18,000<br />
16,000<br />
Security <strong>Area</strong> (sf)<br />
2,240<br />
14,000<br />
12,000<br />
10,000<br />
8,000<br />
6,000<br />
4,000<br />
2,000<br />
2,593<br />
7,817<br />
1,120<br />
2,657<br />
5,600<br />
1,400<br />
2,864<br />
7,000<br />
1,680<br />
3,406<br />
8,400<br />
4,812<br />
11,200<br />
0<br />
Existing Baseline 2.5 MAP 3.0 MAP 4.0 MAP<br />
Screening Queue Allowance<br />
40<br />
TERMINAL AREA CONCEPT PLAN TECHNICAL REPORT<br />
Des Moines International Airport
Passenger <strong>Terminal</strong> Requirements<br />
Outbound baggage screening<br />
KEY POINTS<br />
• Outbound baggage<br />
demand was estimated<br />
based on assumptions of<br />
the number of checked<br />
bags and percentage of<br />
passengers with checked<br />
bags during the peak<br />
hour.<br />
• The peak hour baggage<br />
demand was compared<br />
to the hourly screening<br />
machine throughput to<br />
calculate requirements<br />
for the number of<br />
screening equipment<br />
and space for<br />
equipment and<br />
adequate circulation.<br />
1.<br />
Activity Forecasts<br />
Average Day Peak Month<br />
peak hour bags to process:<br />
• Baseline: 566<br />
• 2.5 MAP: 661<br />
• 3.0 MAP: 792<br />
• 4.0 MAP: 1,082<br />
• 62% of passengers has<br />
checked bags, each with<br />
an average of 1.3 bags.<br />
2.<br />
Assumptions<br />
Screening alarm rates (%):<br />
• Level 1 EDS* 97<br />
• Level 2 OSR 25<br />
• Level 3 ETD 20<br />
* Excludes 3% oversize bags<br />
requiring ETD inspections.<br />
Screening processing rates<br />
(bags/hour):<br />
• Level 1 EDS 250<br />
• Level 2 OSR 120<br />
• Level 3 ETD 24<br />
3.<br />
Existing Facilities<br />
Screening space (sf)<br />
• Sorting matrices &<br />
conveyors 2,280<br />
• Baggage screening<br />
equipment 3,030<br />
• Circulation 900<br />
• Total 6,210<br />
Screening equipment (ea)<br />
• Level 1 EDS 3<br />
• Level 2 OSR 3<br />
• Level 3 ETD 10<br />
• Total 16<br />
4.<br />
Requirements<br />
Screening space (sf)<br />
• Baseline 6,030<br />
• 2.5 MAP 7,830<br />
• 3.0 MAP 7,830<br />
• 4.0 MAP 9,950<br />
Screening equipment (ea)<br />
• Baseline 7<br />
• 2.5 MAP 8<br />
• 3.0 MAP 8<br />
• 4.0 MAP 11<br />
Based on the terminal requirements model results:<br />
• Additional Level 1 EDS equipment will be required by 2.5<br />
MAP. Level 2 OSR and Level 3 ETD equipment will be<br />
adequate through the planning period.<br />
• Outbound baggage screening space will be inadequate<br />
by 2.5 MAP.<br />
• Detailed requirements for screening equipment and area<br />
are provided below.<br />
12,000<br />
10,000<br />
8,000<br />
6,000<br />
4,000<br />
2,000<br />
2,275<br />
900<br />
Baggage Screening <strong>Area</strong> (sf)<br />
2,680<br />
670<br />
3,030 2,680<br />
3,480 3,480<br />
870 870<br />
3,480 3,480<br />
4,420<br />
1,105<br />
4,420<br />
• Based on the analysis,<br />
additional screening<br />
equipment (Level 1<br />
EDS), as well as<br />
additional screening<br />
space of approximately<br />
400 sf, would be needed<br />
by 2.5 MAP.<br />
0<br />
18<br />
16<br />
14<br />
12<br />
10<br />
8<br />
6<br />
4<br />
2<br />
0<br />
Existing Baseline 2.5 MAP 3.0 MAP 4.0 MAP<br />
10<br />
3<br />
Baggage Screening Equipment<br />
2<br />
2<br />
3 3<br />
Baggage screening equipment<br />
Circulation<br />
Conveyors and sorting matrices<br />
2 2<br />
2 2<br />
4 4<br />
Existing Baseline 2.5 MAP 3.0 MAP 4.0 MAP<br />
Level 1 EDS Level 2 OSR Level 3 ETD<br />
3<br />
3<br />
5<br />
41<br />
TERMINAL AREA CONCEPT PLAN TECHNICAL REPORT<br />
Des Moines International Airport
Passenger <strong>Terminal</strong> Requirements<br />
Outbound baggage make-up<br />
KEY POINTS<br />
• Outbound baggage<br />
makeup requirements<br />
were based on the<br />
number of departing<br />
flights in the peak twohour<br />
staging period.<br />
Outbound baggage<br />
makeup requirements<br />
were estimated by<br />
baggage make-up device<br />
(i.e. carts including<br />
tugs).<br />
• Based on the analysis,<br />
the baggage make-up<br />
area is currently<br />
inadequate – an<br />
additional 2,900 sf<br />
would be needed to<br />
provide sufficient space<br />
to satisfy 3.0 MAP.<br />
1.<br />
Activity Forecasts<br />
Annual passenger aircraft<br />
departures (thousands):<br />
• Baseline: 16.9<br />
• 2.5 MAP: 18.5<br />
• 3.0 MAP: 20.9<br />
• 4.0 MAP: 27.6<br />
2.<br />
Assumptions<br />
Average number of carts per<br />
departure: 2.5 (2 for RJ, 3 for<br />
NB)<br />
Average number of<br />
departures within two-hour<br />
staging period: 1.1<br />
<strong>Area</strong> per cart (sf): 300<br />
Outbound baggage makeup<br />
requirement derived based<br />
on the total space required by<br />
the number of baggage trains<br />
at each gate within a twohour<br />
staging period.<br />
3.<br />
Existing Facilities<br />
Make-up space (sf)<br />
• Make-up 6,110<br />
• Circulation 4,640<br />
• Total 10,750<br />
4.<br />
Requirements<br />
Make-up space (sf):<br />
• Baseline 10,800<br />
• 2.5 MAP 11,760<br />
• 3.0 MAP 13,800<br />
• 4.0 MAP 17,640<br />
Based on the terminal requirements model results:<br />
• Baggage make-up area is currently inadequate.<br />
• Detailed requirements for screening equipment and area<br />
are provided below.<br />
20,000<br />
18,000<br />
16,000<br />
14,000<br />
12,000<br />
10,000<br />
8,000<br />
6,000<br />
4,000<br />
2,000<br />
0<br />
4,640<br />
6,110<br />
Baggage Make-up <strong>Area</strong> (sf)<br />
1,800<br />
1,960<br />
9,000 9,800<br />
2,300<br />
11,500<br />
2,940<br />
14,700<br />
Existing Baseline 2.5 MAP 3.0 MAP 4.0 MAP<br />
Baggage make-up area<br />
Baggage train circulation allowance<br />
42<br />
TERMINAL AREA CONCEPT PLAN TECHNICAL REPORT<br />
Des Moines International Airport
Passenger <strong>Terminal</strong> Requirements<br />
Concessions<br />
KEY POINTS<br />
• Facility requirements for<br />
the concessions include<br />
the total space for<br />
concession services<br />
only; back-of-house<br />
space that is necessary<br />
to support them, such as<br />
storage areas, kitchens,<br />
employee lockers,<br />
loading docks, and<br />
administrative offices<br />
are included in the<br />
secondary facilities<br />
evaluation.<br />
• It is assumed that 75%<br />
of the concessions<br />
would be post-security,<br />
where passengers would<br />
be more relaxed and<br />
more inclined to use the<br />
services.<br />
1.<br />
Activity Forecasts<br />
Annual enplaned passengers<br />
(millions):<br />
• Baseline: 1.1<br />
• 2.5 MAP: 1.25<br />
• 3.0 MAP: 1.5<br />
• 4.0 MAP: 2.0<br />
2.<br />
Assumptions<br />
<strong>Plan</strong>ning factors<br />
(sf per 1,000 pax):<br />
• F&B 8.0<br />
• Retail 4.0<br />
• Services 0.5<br />
• Total 12.5<br />
Split (%):<br />
• Pre-security 25<br />
• Post-security 75<br />
• Total 100<br />
Concessions space<br />
requirements derived based<br />
on the planning factors<br />
multiplied by the forecast<br />
annual enplaned passengers.<br />
3.<br />
Existing Facilities<br />
Concession space (sf)<br />
• Pre-security 8,420<br />
• Post-security 9,400<br />
• Support 4,970<br />
• Total 22,790<br />
Concession space breakdown<br />
(sf)<br />
• F&B 12,820<br />
• Retail 5,000<br />
• Services -<br />
• Support 4,970<br />
• Total 22,790<br />
4.<br />
Requirements<br />
Concession space (sf):<br />
• Baseline 17,279<br />
• 2.5 MAP: 19,630<br />
• 3.0 MAP 23,550<br />
• 4.0 MAP 31,400<br />
Based on the terminal requirements model results:<br />
• More of the existing concessions area should be<br />
allocated to post-security for revenue maximization.<br />
• Detailed requirements for concessions area by function<br />
and location are provided below.<br />
30,000<br />
25,000<br />
20,000<br />
15,000<br />
10,000<br />
5,000<br />
0<br />
9,400<br />
8,420<br />
Concessions <strong>Area</strong> (sf) - Location<br />
Pre-security<br />
Post-security<br />
10,313<br />
11,719<br />
14,063<br />
3,438 3,906 4,688<br />
18,750<br />
6,250<br />
Existing Baseline 2.5 MAP 3.0 MAP 4.0 MAP<br />
Note: Excludes concession support space.<br />
• Based on industry<br />
planning guidelines,<br />
more of the existing<br />
concessions should be<br />
allocated post-security.<br />
Additional concession<br />
space would be required<br />
by 3.0 MAP.<br />
18,000<br />
16,000<br />
14,000<br />
12,000<br />
10,000<br />
8,000<br />
6,000<br />
4,000<br />
2,000<br />
-<br />
Concessions <strong>Area</strong> (sf) - Function<br />
16,000<br />
12,820<br />
12,000<br />
10,000<br />
8,800<br />
8,000<br />
5,000 4,400 5,000<br />
6,000<br />
- 550 625 750 1,000<br />
Existing Baseline 2.5 MAP 3.0 MAP 4.0 MAP<br />
Note: Excludes concession support space.<br />
43<br />
TERMINAL AREA CONCEPT PLAN TECHNICAL REPORT<br />
Des Moines International Airport
Passenger <strong>Terminal</strong> Requirements<br />
Passenger Holdrooms<br />
KEY POINTS<br />
• Holdroom requirements<br />
include seating and<br />
standing areas for<br />
passengers, an airline<br />
agent check-in podium,<br />
space for boarding<br />
queue, and space for<br />
circulation and airport<br />
amenities.<br />
• Holdroom sizing is based<br />
on the average seating<br />
capacity of the typical<br />
aircraft expected to use<br />
the gate. Percentage of<br />
passengers to be seated<br />
or standing, as well as<br />
average area per<br />
passenger are based on<br />
Level of Service C.<br />
1.<br />
Activity Forecasts<br />
Annual enplaned passengers<br />
(millions):<br />
• Baseline: 1.1<br />
• 2.5 MAP: 1.25<br />
• 3.0 MAP: 1.5<br />
• 4.0 MAP: 2.0<br />
2.<br />
Assumptions<br />
Average number of seats on<br />
design aircraft: 89<br />
Passengers split (%):<br />
• Standing 20<br />
• Seated 80<br />
• Total 100<br />
Passengers space<br />
requirement for Level of<br />
Service C (sf/pax):<br />
• Standing 10<br />
• Seated 15<br />
3.<br />
Existing Facilities<br />
Holdrooms space (sf)<br />
• Holdrooms 20,170<br />
• Circulation 3,920<br />
• Total* 24,090<br />
*Includes holdroom space<br />
at Gate A5, which is<br />
currently not utilized.<br />
4.<br />
Requirements<br />
Holdrooms space (sf):<br />
• Baseline 25,245<br />
• 2.5 MAP 27,540<br />
• 3.0 MAP 32,130<br />
• 4.0 MAP 41,310<br />
• Includes 5% allowance<br />
for amenities, 35% for<br />
circulation.<br />
Based on the terminal requirements model results:<br />
• Existing holdroom space is insufficient unless the<br />
holdroom at Gate A5 (3,600 square feet ) is utilized to<br />
meet baseline demand.<br />
• Concessions planning will have an impact on holdroom<br />
size requirements.<br />
• Detailed requirements for holdroom area and circulation<br />
are provided below.<br />
45,000<br />
40,000<br />
35,000<br />
30,000<br />
25,000<br />
20,000<br />
15,000<br />
10,000<br />
5,000<br />
3,600<br />
3,920<br />
16,566<br />
Holdrooms <strong>Area</strong> (sf)<br />
6,545<br />
7,140<br />
18,700 20,400<br />
8,330<br />
23,800<br />
10,710<br />
30,600<br />
• Based on the analysis,<br />
existing holdroom<br />
space is insufficient to<br />
accommodate baseline<br />
demand.<br />
0<br />
Existing Baseline 2.5 MAP 3.0 MAP 4.0 MAP<br />
Holdroom area Holdroom circulation Misc<br />
44<br />
TERMINAL AREA CONCEPT PLAN TECHNICAL REPORT<br />
Des Moines International Airport
Passenger <strong>Terminal</strong> Requirements<br />
Baggage claim<br />
KEY POINTS<br />
• Facility requirements for<br />
baggage claim<br />
considered both the<br />
passenger flow and the<br />
baggage flow.<br />
• To provide level of<br />
service C, several things<br />
were considered: the<br />
exposed length of the<br />
device (i.e. claim<br />
frontage), off-load space<br />
(to allow baggage carts<br />
to be pulled adjacent<br />
and handlers to load<br />
bags onto the claim<br />
device), total claim unit<br />
length (i.e. carousel<br />
frontage), and baggage<br />
hall space.<br />
1.<br />
Activity Forecasts<br />
Average Day Peak Month<br />
peak hour bags to process:<br />
• Baseline: 566<br />
• 2.5 MAP: 661<br />
• 3.0 MAP: 792<br />
• 4.0 MAP: 1,082<br />
• 62% of passengers has<br />
checked bags, each with<br />
an average of 1.3 bags.<br />
2.<br />
Assumptions<br />
Claim frontage per person at<br />
Level of Service C (feet): 1.5<br />
Carousel unit<br />
frontage (feet): 150<br />
Carousel module (sf): 4,400<br />
Includes 20% of space for<br />
baggage offices, 15% for<br />
meeter/greeter lobby, and<br />
25% for circulation.<br />
3.<br />
Existing Facilities<br />
Baggage claims (ea)<br />
• Units 2<br />
Existing baggage claims are<br />
flat plate units; for future<br />
requirements, carousel type<br />
units are recommended.<br />
Baggage claim space (sf)<br />
• Claim area 7,440<br />
• Baggage offices 810<br />
• Meeter/greeter 680<br />
• Circulation 7,130<br />
• Offload 4,060<br />
• Total 20,120<br />
4.<br />
Requirements<br />
Baggage claims (ea)<br />
• Baseline 2<br />
• 2.5 MAP 2<br />
• 3.0 MAP 2<br />
• 4.0 MAP 3<br />
Baggage claim space (sf)<br />
• Baseline 17,760<br />
• 2.5 MAP 20,050<br />
• 3.0 MAP 20,050<br />
• 4.0 MAP 30,080<br />
Based on the terminal requirements analysis:<br />
• Bag claim area is currently inadequate for the baggage<br />
offices, meeter/greeter lobby, and offload area. Future<br />
space requirements are based on carousel type bag<br />
claims.<br />
• Detailed requirements for various baggage claim areas<br />
are provided below.<br />
35,000<br />
30,000<br />
25,000<br />
20,000<br />
15,000<br />
10,000<br />
5,000<br />
4,060<br />
5,200<br />
7,130<br />
2,511<br />
680<br />
805<br />
1,116<br />
1,488<br />
Baggage Claim <strong>Area</strong> (sf)<br />
5,200 5,200<br />
2,970 2,970<br />
1,320<br />
1,760<br />
1,320<br />
1,760<br />
7,440 7,440 8,800 8,800<br />
7,800<br />
4,455<br />
1,980<br />
2,640<br />
13,200<br />
• Based on the analysis,<br />
the baggage claim area<br />
is currently inadequate<br />
particularly in the<br />
following areas:<br />
— Baggage offices<br />
0<br />
Existing Baseline 2.5 MAP 3.0 MAP 4.0 MAP<br />
Claim area (carousels)<br />
Meeter/greeter lobby<br />
Inbound baggage offload area<br />
Baggage service offices<br />
Circulation<br />
— Meeter/greeter lobby<br />
— Off-load<br />
45<br />
TERMINAL AREA CONCEPT PLAN TECHNICAL REPORT<br />
Des Moines International Airport
Passenger <strong>Terminal</strong> Requirements<br />
Restrooms, Secondary and Other <strong>Area</strong>s<br />
KEY POINTS<br />
• Restroom requirements<br />
are estimated separately<br />
for pre-security<br />
(including check-in<br />
lobby and arrivals lobby)<br />
and post-security (i.e.<br />
boarding area), based on<br />
the peak 30-minute<br />
arriving and departing<br />
passengers demand, as<br />
well as the percentage<br />
of meeter/greeter and<br />
well-wishers that will be<br />
using the facilities.<br />
• Based on the analysis,<br />
the existing space for<br />
restrooms in postsecurity<br />
is currently<br />
inadequate.<br />
• Secondary facilities<br />
include airline support,<br />
airport support, and<br />
facilities support and<br />
services.<br />
1.<br />
Activity Forecasts<br />
Average Day Peak Month<br />
peak 30-minute enplaned<br />
passengers*:<br />
• Baseline: 231<br />
• 2.5 MAP: 270<br />
• 3.0 MAP: 324<br />
• 4.0 MAP: 442<br />
*Excludes connecting passengers<br />
Average Day Peak Month<br />
peak 20-minute deplaned<br />
passengers:<br />
• Baseline: 284<br />
• 2.5 MAP: 331<br />
• 3.0 MAP: 397<br />
• 4.0 MAP: 543<br />
2.<br />
Assumptions<br />
Meeter/greeter<br />
(per deplaned pax): 0.2<br />
Well-wishers<br />
(per enplaned pax): 0.2<br />
Number of fixtures<br />
(per 100 pax): 1<br />
Restrooms area (sf):<br />
• Men/Women 70*<br />
• Family 100<br />
*area per fixture<br />
Restrooms split (%):<br />
• Women 60<br />
• Men 40<br />
Restrooms space split (%):<br />
• Pre-security 30<br />
• Post-security 70<br />
3.<br />
Existing Facilities<br />
Restrooms space (sf)<br />
• Pre-security 2,120<br />
• Post-security 3,240<br />
• Total 5,360<br />
4.<br />
Requirements<br />
Restrooms space (sf):<br />
• Baseline 6,700<br />
• 2.5 MAP 7,590<br />
• 3.0 MAP 8,970<br />
• 4.0 MAP 12,140<br />
Based on the terminal requirements model results:<br />
• Existing terminal provides adequate pre-security<br />
restrooms, but can provide more space post-security to<br />
meet passenger needs.<br />
• Detailed requirements for restrooms are provided below.<br />
14,000<br />
12,000<br />
10,000<br />
8,000<br />
6,000<br />
4,000<br />
2,000<br />
7,000<br />
6,000<br />
0<br />
3,238<br />
Restrooms <strong>Area</strong> (sf) - Pre/Post Security<br />
4,520<br />
5,180<br />
6,050<br />
2,120 2,180 2,410 2,920<br />
8,350<br />
3,790<br />
Existing Baseline 2.5 MAP 3.0 MAP 4.0 MAP<br />
Pre-security<br />
Post-security<br />
Restrooms <strong>Area</strong> (sf) - Mens/Womens/Family<br />
• The space allowance for<br />
secondary areas are<br />
calculated as a<br />
percentage of total<br />
major departures<br />
and/or arrivals<br />
functional areas.<br />
Secondary and Other <strong>Area</strong>s<br />
Requirements for secondary and other areas are sized based<br />
on existing facilities, relative to the space requirements for<br />
the primary area for each passenger demand level.<br />
Secondary facilities include:<br />
– Airline support (e.g. airline operations)<br />
– Airport support (e.g. Transportation Security Administration<br />
and staff support, ground handling services, operations and<br />
maintenance)<br />
– Facilities support and services (e.g. loading dock,<br />
trash/recycling)<br />
Additional areas include:<br />
– Building structure which includes foundations, columns,<br />
cores, walls, internal partitions, support structural<br />
framework, etc.<br />
– Building mechanical systems which include mechanical<br />
system/electric rooms, plumbing spaces, ducts for<br />
heating/ventilation/air conditioning, etc.<br />
5,000<br />
4,000<br />
3,000<br />
2,000<br />
1,000<br />
0<br />
6,650<br />
4,900<br />
4,130<br />
4,480<br />
3,570<br />
3,290<br />
2,450 2,730<br />
994 994133 400 400 400 500<br />
Existing Baseline 2.5 MAP 3.0 MAP 4.0 MAP<br />
46<br />
TERMINAL AREA CONCEPT PLAN TECHNICAL REPORT<br />
Des Moines International Airport
Passenger <strong>Terminal</strong> Requirements<br />
<strong>Terminal</strong> Requirements Summary<br />
<strong>Terminal</strong> requirements are summarized in the table below:<br />
47<br />
TERMINAL AREA CONCEPT PLAN TECHNICAL REPORT<br />
Des Moines International Airport
Peak Occupancy (stalls)<br />
Peak Occupancy (stalls)<br />
Spaces<br />
Spaces<br />
Ground Transportation Requirements<br />
Parking<br />
KEY POINTS<br />
• Approximately 4,300<br />
spaces are available for<br />
public parking<br />
• Today, only<br />
approximately 3,425<br />
public spaces are<br />
occupied on a typical<br />
busy day<br />
• By 3.0 MAP, 5,100 public<br />
spaces are estimated to<br />
be required, translating<br />
to approximately 5 acres<br />
of additional parking<br />
• By 4.0 MAP, 6,800<br />
spaces are estimated to<br />
be required, translating<br />
to approximately 16<br />
acres of additional<br />
parking<br />
1. Existing Facilities<br />
Public Parking<br />
Parking Spaces<br />
• Short-term 341<br />
• Long-term 1,732<br />
• Economy 1,885<br />
• Economy 4* 300<br />
• Total 4,258<br />
* Economy Lot #4 currently<br />
has 1,000 parking spaces.<br />
Approximately 700 of those<br />
spaces have been leased to<br />
the rental car companies<br />
2. Methodology and Assumptions<br />
Current Demand Determination<br />
• ‘Typical busy day’ in past 12 months is used to identify existing design-day<br />
• All public parking facilities are evaluated combined, since distribution<br />
between parking products is determined by policy decisions and price points<br />
Key Assumptions<br />
• Demand will grow at same rate as passenger traffic<br />
• 10% ‘circulation’ factor is added to demand<br />
4,000<br />
3,500<br />
3,000<br />
2,500<br />
2,000<br />
1,500<br />
3,424 occupied spaces<br />
0 100 200 300<br />
Day Ranks<br />
3. Requirements<br />
Public Parking stalls required:<br />
• 2.5 MAP 4,200<br />
• 3.0 MAP 5,100<br />
• 4.0 MAP 6,800<br />
Additional Spaces required:<br />
• 2.5 MAP 0<br />
• 3.0 MAP 850<br />
• 4.0 MAP 2,550<br />
Additional <strong>Area</strong> required:<br />
• 2.5 MAP 0<br />
• 3.0 MAP 5.3 acres<br />
• 4.0 MAP 15.8 acres<br />
As shown in Figure 33, existing<br />
public parking spaces are<br />
inadequate by 3.0 MAP.<br />
7,000<br />
6,000<br />
5,000<br />
4,000<br />
3,000<br />
2,000<br />
1,000<br />
Public Parking<br />
3,770 4,220<br />
5,090<br />
6,760<br />
0<br />
Baseline 2.5 MAP 3.0 MAP 4.0 MAP<br />
(2013)<br />
Requirements (spaces) Existing (4,258 spaces)<br />
400<br />
300<br />
200<br />
100<br />
0<br />
Employee Parking<br />
270 280 300<br />
340<br />
Baseline 2.5 MAP 3.0 MAP 4.0 MAP<br />
(2013)<br />
Requirements (spaces)<br />
Existing (273 spaces)<br />
• 273 spaces are available<br />
for employee parking<br />
• The employee parking<br />
lot is currently nearing<br />
capacity and will slightly<br />
exceed capacity 2.5 MAP<br />
Employee Parking<br />
Parking Spaces<br />
• Total 273<br />
Current Demand Determination<br />
• ‘Typical busy day’ in past 12 months is used to identify existing design-day<br />
Key Assumptions<br />
• Demand will grow at same rate as aircraft operations<br />
• 5% ‘circulation’ factor is added to demand<br />
300<br />
250<br />
200<br />
150<br />
100<br />
50<br />
0<br />
257occupied spaces<br />
0 100 200 300<br />
Day Ranks<br />
Parking stalls required:<br />
• 2.5 MAP 280<br />
• 3.0 MAP 300<br />
• 4.0 MAP 340<br />
Additional Spaces required:<br />
• 2.5 MAP 10<br />
• 3.0 MAP 30<br />
• 4.0 MAP 70<br />
Additional <strong>Area</strong> required:<br />
• 2.5 MAP 0 acres<br />
• 3.0 MAP 0.2 acres<br />
• 4.0 MAP 0.4 acres<br />
As shown in Figure 33, existing<br />
employee parking spaces<br />
are marginal at 2.5 MAP and<br />
will become insufficient by<br />
3.0 MAP.<br />
Figure 33<br />
Parking Stress Chart<br />
48<br />
TERMINAL AREA CONCEPT PLAN TECHNICAL REPORT<br />
Des Moines International Airport
Feet<br />
Feet<br />
Feet<br />
Ground Transportation Requirements<br />
Roads and Curbsides<br />
KEY POINTS<br />
• Under the existing<br />
enforcement conditions,<br />
the inner curbside<br />
(private vehicles) is<br />
approaching a capacity<br />
constraint<br />
• If “active loading /<br />
unloading only” were<br />
enforced on the inner<br />
curbside, there would<br />
be enough passenger<br />
vehicle curbside<br />
capacity through the<br />
planning period<br />
• The outer curbside is<br />
currently at capacity, but<br />
is expected to operate at<br />
a borderline acceptable<br />
level through 3.0 MAP<br />
• Existing entrance and<br />
exit roadways have<br />
operational constraints<br />
but not capacity<br />
constraints<br />
• Roadway capacity<br />
constraints are not<br />
expected to occur in the<br />
planning period<br />
The roadway and curbside facility requirements to accommodate<br />
demand throughout the planning period are summarized in this<br />
section. Requirements are based on industry best practices related<br />
to airport roadway planning.<br />
Curbsides<br />
Traffic counts from April 2013 were used to define peak day<br />
volume. An analysis of the schedule revealed that approximately<br />
8% of departing seats occur during the peak hour, which was<br />
increased to 10% for a conservative estimate. Once the peak hour<br />
volumes for the peak day in April was determined, the volumes<br />
were adjusted for the peak month. Using historical data, June was<br />
identified as the busiest month, with approximately 23% higher<br />
traffic volumes than April. The resulting traffic volumes are shown<br />
below. Traffic was grown in direct proportion to forecasted growth<br />
in airline passenger traffic. Figure 34 shows insufficiencies in the<br />
existing curbsides by 2.5 and 3.0 MAP levels.<br />
1. Existing Facilities<br />
Curbside Length (linear feet)<br />
• Inner 545<br />
• Outer 571<br />
Traffic<br />
PM Peak Hour (13:30-14:30)<br />
April 2013 Traffic Counts<br />
adjusted for peak month and<br />
peak hour<br />
Vehicle Type<br />
Vehicles<br />
Taxi 32<br />
Hotel Shuttle 21<br />
Limo 3<br />
Off-Airport Parking 11<br />
Airport Parking Bus 14<br />
Private Vehicles<br />
Arrivals 52<br />
Departures 33<br />
Total 167<br />
2. Activity Forecasts 3. Assumptions 4. Requirements<br />
Grown in direct proportion to<br />
forecasted growth in airline<br />
passenger traffic<br />
Peak Hour Traffic Volumes<br />
Vehicle Type<br />
2.5 MAP 4.0 MAP<br />
Taxi 39 62<br />
Hotel Shuttle 25 40<br />
Limo 4 6<br />
Off A/P Parking 13 21<br />
A/P Parking 14 14<br />
Private Vehicles<br />
Arrivals 63 100<br />
Departures 40 64<br />
Total 198 308<br />
The traffic volumes were combined with the assumed dwell<br />
times and adjusted by the Poisson distribution to assure that<br />
enough spaces were available 95% of the time (a level of<br />
service C standard). The resulting curbside requirements are<br />
shown in the graphs below.<br />
Roadways<br />
The roadways have several operational issues, but do provide<br />
sufficient capacity . With the traffic volumes shown in the<br />
curbside analysis below, a single-lane entrance and exit<br />
roadway would meet capacity requirements. However, it is an<br />
industry standard to provide two-lane entrance and exit<br />
roadways to avoid a situation in which an accident or similar<br />
event could prevent access to the terminal.<br />
Length of curbside required is dependent<br />
on dwell time. Two scenarios were<br />
evaluated: (a) dwell times with current<br />
enforcement and (b) dwell times<br />
enforced for active loading/unloading<br />
Dwell Time Assumptions (min.)<br />
Vehicle Type<br />
Current<br />
Enforcement<br />
Active<br />
loading /<br />
Unloading<br />
Taxi 2.7 2.7<br />
Hotel Shuttle 3.5 3.5<br />
Limo 10 10<br />
Off A/P Parking 3.5 3.5<br />
A/P Parking 4 4<br />
Private Vehicles<br />
Arrivals 8.7 3.5<br />
Departures 3.0 2.5<br />
Inner Curbside<br />
800<br />
600<br />
400<br />
200<br />
0<br />
200<br />
Outer Curbside<br />
Current Enforcement<br />
230<br />
270<br />
300 340 390<br />
800<br />
600<br />
400<br />
200<br />
0<br />
4.0 MAP<br />
3.0 MAP<br />
2.5 MAP<br />
Existing<br />
320<br />
500<br />
Baseline 2.5 MAP 3.0 MAP 4.0 MAP<br />
(2013)<br />
340 340 340<br />
240 270 270<br />
Legend – Level of service during peak periods<br />
Unacceptable<br />
800<br />
600<br />
400<br />
200<br />
0<br />
Pick-up Requirements<br />
Total Available Curbside (545 ft.)<br />
340<br />
390<br />
Baseline 2.5 MAP 3.0 MAP 4.0 MAP<br />
(2013)<br />
Figure 34<br />
Existing Curbsides Stress Chart<br />
Inner<br />
Marginal<br />
Stricter Enforcement<br />
180 200<br />
Outer<br />
Acceptable<br />
230<br />
270<br />
180 180 200 230<br />
Baseline 2.5 MAP 3.0 MAP 4.0 MAP<br />
(2013)<br />
Drop-off Requirements<br />
Arrivals Curbside (285 ft.)<br />
Taxi, Charter, and<br />
Airport Requirements<br />
Courtesy and Limo<br />
Requirements<br />
Total Available<br />
Curbside (571 ft.)<br />
Courtesy and Limo<br />
(232 ft.)<br />
49<br />
TERMINAL AREA CONCEPT PLAN TECHNICAL REPORT<br />
Des Moines International Airport
Spaces<br />
Acres<br />
Ground Transportation Requirements<br />
Rental Car Facilities and Hold Lot<br />
KEY POINTS<br />
1. Existing Facilities<br />
2. Methodology and Assumptions<br />
3. Requirements<br />
600<br />
Ready-Return Spaces<br />
• The rental car customer<br />
service facilities (Rental<br />
Car Counters and Ready-<br />
Return Spaces) will<br />
experience capacity<br />
constraints by 3.0 MAP<br />
• The existing QTA<br />
combined with the<br />
leased space in Economy<br />
Lot #4 is expected to<br />
provide enough space<br />
until 4.0 MAP<br />
• The construction of a<br />
Hold Lot is dependent<br />
on local policy decisions,<br />
but if built should<br />
accommodate 15 taxis, 5<br />
limos, and 3 buses to<br />
accommodate 2.5 MAP<br />
demands<br />
Rental Car Facilities<br />
Customer Facilities:<br />
• Customer Service <strong>Area</strong><br />
3,345 sq. ft.<br />
• Ready-Return Spaces<br />
370 spaces<br />
Quick Turn Around (QTA):<br />
• Wash and Fuel Facility<br />
4.3 acres<br />
• Storage (Economy Lot #4)<br />
700 spaces (4.3 acres)<br />
Hold Lot<br />
• Hold areas are divided into<br />
two primary areas: taxi<br />
queue and limo hold area<br />
• Current hold areas have<br />
room for eight taxicabs<br />
and three limos<br />
Rental Car Facilities Model<br />
• Created in conjunction with rental car industry leading architects<br />
• Model is based off inputs from a variety of Airports<br />
• Fundamentally based off rental car fleet size. To estimate the<br />
fleet size, a benchmarking ratio of 2,000 vehicles per MEP was<br />
created.<br />
• Growth for ready/return and QTA facilities increases in direct<br />
proportion to forecasted growth in O&D commercial passenger<br />
traffic. While the rental car industry is relatively volatile with a<br />
long history of new entrants and merges, the total market<br />
demand for vehicles will likely be unaffected by the changes.<br />
• Estimates individual facility needs for customer service facilities<br />
(queue space, counters, administration space, etc.) , ready/return<br />
spaces, and QTA (wash, fuel, maintenance, and storage)<br />
• For rental car operations with less than 4,000 vehicles and more<br />
than 4 companies, there is a reduction in operational efficiencies,<br />
resulting in increased requirements relative to benchmarks<br />
Potential Solutions<br />
• Policy regarding a hold lot is determined by local staff and politics<br />
• Current solution, the taxi ‘hold lot’ is a queue along the inbound<br />
roadway, typically occurring in a third lane on the right<br />
• Alternative 1: a paved parking lot with simple restroom facilities<br />
• Alternative 2: combine the hold lot with a gas station / convenience<br />
store along the primary route for rental cars (see example below)<br />
Customer Service <strong>Area</strong> (CSA)<br />
• 2.5 MAP 2,900 s.f.<br />
• 3.0 MAP 3,500 s.f.<br />
• 4.0 MAP 4,100 s.f.<br />
(add approximately 1,000 s.f.<br />
for a separate customer service<br />
bldg.)<br />
Ready-Return (R/R) Spaces:<br />
• 2.5 MAP 350<br />
• 3.0 MAP 420<br />
• 4.0 MAP 570<br />
QTA:<br />
• 2.5 MAP 5.5 acres<br />
• 3.0 MAP 6.5 acres<br />
• 4.0 MAP 8.8 acres<br />
As shown on Figure 35, CSA<br />
and R/R will be inadequate by<br />
3.0 MAP.<br />
The size of commercial vehicle<br />
hold lots are often determined by<br />
policy (how long taxis have to<br />
wait, what is the quality of the<br />
facilities, etc.)<br />
Taxis (estimated 2-3 hour wait)<br />
• 2.5 MAP 15<br />
• 4.0 MAP 25<br />
400<br />
200<br />
0<br />
10<br />
8<br />
6<br />
4<br />
2<br />
0<br />
310 350<br />
420<br />
570<br />
Baseline 2.5 MAP 3.0 MAP 4.0 MAP<br />
(2013)<br />
Requirement (spaces) Existing (370 spaces)<br />
Quick-Turnaround<br />
4.9 5.5<br />
6.5<br />
8.8<br />
Baseline 2.5 MAP 3.0 MAP 4.0 MAP<br />
(2013)<br />
Requirement (acres) Existing (8.6 acres)<br />
Figure 35<br />
Rental Car Facilities and Hold Lot Stress Chart<br />
• Current hold area requires<br />
taxis to cross three lanes of<br />
traffic<br />
Taxi Hold Lot<br />
Limos and<br />
Busses<br />
Limos:<br />
• 2.5 MAP 5<br />
• 4.0 MAP 10<br />
• During peak hours, taxicabs<br />
are frequently re-circulating<br />
on the airport roadways<br />
waiting for space in the taxi<br />
queue<br />
Convenience<br />
Store<br />
Fuel<br />
Pumps<br />
Potential<br />
Cell lot<br />
Charter buses:<br />
• 2.5 MAP 3<br />
• 4.0 MAP 5<br />
Existing hold log is alreading<br />
insufficient to meet current<br />
demand, as illustrated on<br />
Figure 35.<br />
50<br />
TERMINAL AREA CONCEPT PLAN TECHNICAL REPORT<br />
Des Moines International Airport
Airfield requirements<br />
Runway length requirements<br />
KEY POINTS<br />
• Runway length<br />
requirements were<br />
evaluated for the<br />
selected aircraft types:<br />
— MD-83<br />
— Airbus 300-600<br />
— Airbus 330-300<br />
— Boeing 747-400<br />
— Boeing 767-300 Freighter<br />
• Existing runway length<br />
of 9,000 feet is sufficient<br />
to support all selected<br />
aircraft up to 80% of<br />
their useful load, and all<br />
of the selected aircraft<br />
for the selected<br />
destinations.<br />
Methodology:<br />
• Evaluation of runway length requirements involved:<br />
– Assessment of aircraft manufacturer’s published<br />
takeoff and landing criteria, as reported in<br />
aircraft planning manuals<br />
– A more detailed evaluation of the aircraft takeoff<br />
performance capabilities, as measured by<br />
takeoff weights and payloads.<br />
Assumptions:<br />
• The aircraft types considered were from the forecast<br />
prepared for the master plan, as well as the<br />
published flight schedules for commercial<br />
passenger, air taxi, and cargo operations based on<br />
FAA Traffic Flow Management System Counts<br />
(TFMSC) data, for the period CY 2005 to CY 2012.<br />
• The analysis of takeoff and landing runway length<br />
requirements incorporated the following<br />
assumptions:<br />
– Ambient temperatures of 86 F, reflecting the<br />
mean maximum temperature of the hottest<br />
month.<br />
– Existing airport elevation of 958 feet.<br />
– Zero wind, unless otherwise noted.<br />
Findings:<br />
• Figure 36 presents the results of the takeoff<br />
runway length evaluation. The existing runway<br />
length is sufficient to support all selected aircraft<br />
up to approximately 80% of their useful load.<br />
Aircraft do not typically operate at 100% of their<br />
useful load for practical reasons: (1) the aircraft<br />
may not be accommodating a full passenger load<br />
and (2) the aircraft may not be traveling<br />
sufficient distance to require a full load of fuel.<br />
• Figure 37 presents the results of the takeoff<br />
runway length requirements for selected<br />
destinations. The existing runway length of<br />
9,000 feet can accommodate all of the selected<br />
aircraft for the selected destinations.<br />
• Table 20 presents the results of landing runway<br />
length evaluation. Landing runway length<br />
requirements are shown for both dry and wet<br />
conditions. The existing runway lengths are<br />
sufficient to accommodate the aircraft fleet mix.<br />
Useful Load Takeoff length requirements were evaluated based on the<br />
aircraft’s “useful load” (as shown on Figure 38). Useful load is defined as<br />
the maximum takeoff weight minus the aircraft empty weight. An<br />
aircraft’s useful load can be used to transport either fuel or payload (i.e.,<br />
passengers, baggage, and cargo), and within certain limits, useful load<br />
can be allocated between fuel and passengers/cargo.<br />
Figure 38<br />
Figure 36<br />
Figure 37<br />
Table 20<br />
RUNWAY LANDING LENGTH SUMMARY<br />
Landing length requirement<br />
(ft)<br />
Aircraft<br />
Dry<br />
Wet<br />
B767-300 Freighter 6,270 7,180<br />
B747-400 6,490 7,190<br />
A330-300 5,640 n.a.<br />
A300B4-600 6,140 n.a.<br />
MD-83 5,300 6,140<br />
(1) Requirements based on standard day temperature (15ºC), zero wind, zero<br />
runway slope, no reverse thrust, and airport elevation of 985 and maximum<br />
design landing weight, unless otherwise stated.<br />
Sources: Aircraft Characteristics for Airport <strong>Plan</strong>ning, published by the Boeing<br />
Company and Airbus Industrie.<br />
51<br />
TERMINAL AREA CONCEPT PLAN TECHNICAL REPORT<br />
Des Moines International Airport
Airfield requirements<br />
Airfield capacity and delay<br />
KEY POINTS<br />
• Airfield capacity is<br />
evaluated based on the<br />
Annual Service Volume<br />
(ASV) and average<br />
aircraft delay methods<br />
from the current FAA’s<br />
Advisory Circular<br />
150/5060-5, Airport<br />
Capacity and Delay.<br />
• Based on the analysis,<br />
the existing airfield can<br />
accommodate forecast<br />
aviation demand<br />
throughout the entire<br />
planning period of the<br />
master plan, with<br />
average aircraft delay of<br />
less than 1 minute per<br />
operation.<br />
Methodology:<br />
• Annual Service Volume (ASV) is an estimate of how<br />
many aircraft operations an airport can accommodate<br />
in a year, and is calculated using the methods<br />
specified in the current FAA’s Advisory Circular<br />
150/5060-5, Airport Capacity and Delay (the AC). It is<br />
defined as the point at which further increases in<br />
demand will result in disproportionate increase in<br />
average aircraft delay.<br />
ASV = Cw x D x H<br />
Cw is the weighted average hourly capacity of the<br />
airfield.<br />
D is the ratio of annual to ADPM demand.<br />
H is the ratio of ADPM demand to peak-hour<br />
demand.<br />
• Average aircraft delays is estimated based on the ASV<br />
methodology described in the AC. This methodology<br />
is based on the relationship between the ratio of<br />
annual demand to ASV and average annual aircraft<br />
delay, as shown on Figure 41.<br />
Assumptions:<br />
• Annual capacity was based on the hourly capacities<br />
and runway use percentages from the previous<br />
master plan, as shown on Table 21.<br />
• Demand factors (i.e., D and H) were calculated based<br />
on the aviation forecast prepared for the master plan.<br />
Findings:<br />
• As shown on Figure 39, the existing airfield can<br />
accommodate an 148,700 operations a year, which<br />
exceeded the forecast aviation demand throughout<br />
the entire planning period.<br />
• As shown on Figure 40, average aircraft delay is<br />
estimated to be less than 1 minute per operation<br />
throughout the entire planning period.<br />
Figure 41<br />
Aircraft Delay Curve<br />
FAA AC 150/5060-5, Airport Capacity and Delay<br />
Table 21<br />
Runway Use Percentages and Hourly Capacities<br />
Figure 39<br />
Figure 40<br />
ASV = 148,700<br />
Source: Des Moines International Airport, Master <strong>Plan</strong> 2007<br />
52<br />
TERMINAL AREA CONCEPT PLAN TECHNICAL REPORT<br />
Des Moines International Airport
Air Cargo Facility Requirements<br />
All-Cargo<br />
KEY POINTS<br />
• Approximately 50 acres<br />
are currently reserved<br />
for air cargo operations<br />
at the Airport, mostly in<br />
the south quadrant of<br />
the site.<br />
• The facilities are not<br />
fully utilized and can be<br />
downsized.<br />
• By the end of the<br />
planning period, 12<br />
acres should be reserved<br />
for air cargo activity.<br />
The air cargo facility requirements to accommodate demand<br />
throughout the planning period are summarized in this section.<br />
Requirements were based on industry best practices related to<br />
cargo facility planning. The following functional areas were<br />
examined:<br />
• Processing and Warehouse Space. Processing and warehouse<br />
space consists of enclosed areas used to store and sort air<br />
cargo, as well as to provide office and other space to facilitate<br />
air cargo operations. Warehouse facility requirements and<br />
use, typically expressed in pounds or tons of cargo per square<br />
foot of warehouse space, vary significantly by airport,<br />
depending on the mix of cargo operators. Airports with<br />
higher concentrations of integrated carrier activity have much<br />
greater facility use ratios.<br />
1.<br />
Existing Facilities<br />
All-cargo apron (s.y.)<br />
• South 177,000<br />
• East 27,000<br />
• Total 204,000<br />
Warehouses (s.f.)<br />
• Bldg 31 12,300<br />
• Bldg 32 28,000<br />
• Bldg 35 27,350<br />
• Total 67,650<br />
• Approx. 68% of total square<br />
footage is leased<br />
Total land area (approx.): 50<br />
acres<br />
Existing warehouse utilization<br />
(based on leased space only): 1.5<br />
ton/s.f.<br />
2.<br />
Activity Forecasts<br />
All-cargo airline air cargo<br />
(millions of pounds)<br />
• 2012: 147.8<br />
• 4.0 MAP: 172.7<br />
• Compound annual growth<br />
rate (CAGR): 0.8%<br />
Annual cargo aircraft<br />
operations<br />
• 2012: 5,456<br />
• 4.0 MAP: 5,427<br />
• CAGR: 0.0%<br />
Airports that accommodate more heavy freight, including<br />
international cargo, must accommodate longer dwell times and,<br />
therefore, have lower ratios of cargo tonnage per square foot of<br />
cargo warehouse space. For planning purposes, the generally<br />
accepted cargo facility use ratio is between 0.5 ton, for a low<br />
automation, mostly manual, facility, and 1.6 tons annually per<br />
square foot of warehouse space for a highly automated cargo<br />
facility. In 2012, the Airport achieved a warehouse utilization of<br />
1.5 tons of cargo per square foot. It was assumed that this rate<br />
would be maintained throughout the planning period, resulting<br />
in a total of 54,000 square feet of warehouse being required by<br />
4.0 MAP to handle forecasted cargo volumes.<br />
3.<br />
Assumptions<br />
Target warehouse utilization:<br />
1.5 ton/s.f.<br />
0.5 ton/s.f. = Low automation<br />
facility<br />
0.9 ton/s.f. = Automated facility<br />
1.6 ton/s.f. = Highly automated<br />
facility<br />
Number of warehouse levels:<br />
1.0<br />
Target land requirement ratio:<br />
3.3<br />
Overall land area (warehouse<br />
building and landside facilities)<br />
derived using a ratio relative to<br />
cargo warehouse space<br />
4.<br />
4.0 MAP<br />
Requirements<br />
All-cargo aircraft stands (sized<br />
for ADPM)<br />
• ADG II 1<br />
• ADG IV 7<br />
• Total 8<br />
Warehouse and land<br />
requirements (s.f.)<br />
• Warehouse 53,700<br />
• Ramp 334,600<br />
• Landside 123,500<br />
Total land area (approx.): 12<br />
acres<br />
South cargo area is adequate<br />
throughout planning period<br />
• Ramp <strong>Area</strong>. The ramp area includes paved airside<br />
areas used for aircraft parking while air cargo is<br />
loaded and unloaded. For larger air cargo<br />
complexes, ramp area may include a maneuvering<br />
area for aircraft to access parking positions, as<br />
well as storage areas for ground support<br />
equipment (GSE) used to load air cargo onto<br />
aircraft, unload air cargo from aircraft, or service<br />
aircraft. The aircraft parking requirements were<br />
calculated based on future ADPM demand. Based<br />
on the forecasts, it was determined that<br />
approximately 8 aircraft will have to be<br />
accommodated during the ADPM by 4.0 MAP,<br />
distributed as follows: one ADG II, and seven<br />
ADG IV aircraft. This corresponds to a 335,000<br />
square foot apron area.<br />
• Landside <strong>Area</strong>s. Air cargo landside areas include<br />
areas that provide for vehicle access and<br />
circulation from the Airport’s primary roadway<br />
network, parking for employees and visitors, and<br />
parking for the trucks delivering air cargo to<br />
processing and warehousing facilities and for<br />
taking delivery of air cargo from these facilities.<br />
An allowance was included for landscaping and<br />
other improvements in the calculation of total<br />
required landside areas. Overall land area, which<br />
includes the warehouse building footprint and the<br />
associated landside facilities, is derived using a<br />
ratio relative to the gross floor area of cargo<br />
warehouse space. The traditional cargo industry<br />
gross floor area to land requirement ratio is 1:3.3.<br />
By 4.0 MAP, 124,000 square feet should be<br />
reserved for landside facilities associated with allcargo<br />
operations.<br />
53<br />
TERMINAL AREA CONCEPT PLAN TECHNICAL REPORT<br />
Des Moines International Airport
Air Cargo Facility Requirements<br />
Belly Cargo<br />
KEY POINTS<br />
• Building 5 will be<br />
sufficient to handle belly<br />
cargo throughout the<br />
planning period.<br />
• Current belly cargo<br />
facility utilization is low<br />
and could be increased<br />
to optimize future space<br />
usage.<br />
1.<br />
Existing Facilities<br />
Warehouse (s.f.) 7,150<br />
Ramp (s.f.) 17,700<br />
Landside (s.f.) 16,300<br />
1/3 of Building 5 is used for<br />
belly cargo (Bays 2 and 3)<br />
Total land area:
General Aviation Facility Requirements<br />
General Aviation Apron and Aircraft Storage Facilities<br />
KEY POINTS<br />
• Approximately 15,300<br />
square yards of itinerant<br />
general aviation apron<br />
are projected to be<br />
required to<br />
accommodate demand<br />
by the end of the<br />
planning period.<br />
• Approximately 6,900<br />
square yards of based<br />
general aviation aircraft<br />
parking apron is<br />
projected to be required<br />
to accommodate<br />
demand by 4.0 MAP.<br />
• By 4.0 MAP, 368,200<br />
square feet of<br />
conventional hangar<br />
space is projected to be<br />
required. In addition, a<br />
total of 60,000 square<br />
feet of T-hangar space<br />
will be required.<br />
General aviation facility requirements to accommodate<br />
demand through the planning period are summarized in<br />
this section. Overall GA facility requirements were<br />
derived based on a review of existing facilities, GA<br />
demand trends, activity forecasts, and discussions with<br />
key stakeholders.<br />
Aviation Forecast<br />
• Total general aviation operations at the Airport are<br />
forecast to remain relatively constant throughout the<br />
planning period, declining slightly from 31,962<br />
operations in 2012 to 31,600 operations in 2032.<br />
Itinerant general aviation operations are forecast to<br />
increase an average of 0.1 percent per year from<br />
2012 to 2032, while local GA operations are forecast<br />
to decrease 0.6 percent per year over the same time<br />
period. Itinerant operations accounted for 80.5<br />
percent of total GA operations at the Airport in 2012.<br />
This trend is expected to continue and itinerant<br />
operations are forecast to account for the majority of<br />
GA traffic at the Airport throughout the planning<br />
period.<br />
• Total based aircraft at the Airport are forecast to<br />
increase an average of 0.7 percent per year,<br />
increasing from 108 aircraft in 2012 to 124 by 2032<br />
(4.0 MAP). The based aircraft fleet will evolve toward<br />
more business/corporate jets, while the number of<br />
piston and multi-engine turboprop aircraft based at<br />
the Airport will decrease.<br />
Aircraft Parking Apron<br />
• Aircraft parking aprons provide space for itinerant<br />
and based general aviation, allowing passengers to<br />
access FBO facilities, fueling, and ground<br />
transportation and allowing service trucks and FBO<br />
personnel access to the aircraft. Itinerant and based<br />
aircraft apron requirements were calculated using<br />
the following methodology and assumptions:<br />
– In accordance with FAA guidance, itinerant aircraft apron<br />
requirements were determined assuming 360 square yards<br />
of apron for 50 percent of the itinerant aircraft using the<br />
Airport on the busy day of the peak month. The “busy day”<br />
is defined as 110 percent of the activity on the ADPM.<br />
Approximately 15,300 square yards of itinerant general<br />
aviation apron are projected to be required to<br />
accommodate demand by the end of the planning period.<br />
– Based aircraft parking apron requirements were<br />
determined assuming that 30 percent of based single and<br />
multi-engine aircraft will use ramp parking throughout the<br />
planning period. In accordance with FAA guidance, it was<br />
assumed that 300 square yards of apron space will be<br />
required per based aircraft tiedown position. It was<br />
assumed that no based jet aircraft will use tiedown space.<br />
Approximately 6,900 square yards of based general<br />
aviation aircraft parking apron is projected to be required<br />
to accommodate demand by 4.0 MAP.<br />
4.0 MAP<br />
3.0 MAP<br />
2.5 MAP<br />
Existing<br />
Tie<br />
Downs<br />
Figure 43<br />
Existing General Aviation Stress Chart<br />
Conv.<br />
Hangars<br />
T-<br />
Hangars<br />
Aircraft Storage Facilities<br />
• The Airport currently provides a total of 240,000 square<br />
feet of conventional hangar space and 54,000 square feet<br />
of T-hangar space.<br />
• Aircraft storage facility requirements are based on the<br />
forecast number and fleet mix of based aircraft. Aircraft<br />
storage facility requirements were based on the following<br />
planning assumptions and guidelines:<br />
– Throughout the planning period, the owners/operators<br />
of approximately 70 percent of single- and multi-engine<br />
aircraft will desire hangar space. Of these, 90 percent<br />
will be accommodated in T-hangars and 10 percent will<br />
be accommodated in conventional hangars. All<br />
corporate jet aircraft will occupy conventional hangar<br />
space.<br />
– Storage requirements in conventional hangars were<br />
calculated using the following assumptions: 2,750<br />
square feet per multi-engine aircraft, 1,400 square feet<br />
per single engine aircraft, and 1,000 square feet per<br />
helicopter. An average of 8,000 square feet of hangar<br />
per jet aircraft was used. While this allowance is higher<br />
than FAA guidelines, it reflects the current operating<br />
conditions at the Airport, with a high proportion of large<br />
business jets.<br />
– Each T-hangar consists of 1,200 square feet.<br />
• By 4.0 MAP, 368,200 square feet of conventional hangar<br />
space is projected to be required. In addition, a total of<br />
60,000 square feet of T-hangar space will be required.<br />
• Shown on Figure 43 is a stress chart showing deficiencies<br />
in existing aviation facilities to meet forecast demand.<br />
Legend – Level of service during peak periods<br />
Unacceptable<br />
Marginal<br />
Acceptable<br />
55<br />
TERMINAL AREA CONCEPT PLAN TECHNICAL REPORT<br />
Des Moines International Airport
Storage Requirements (gallons)<br />
Airline Support Facility Requirements<br />
Fuel Storage Requirements<br />
KEY POINTS<br />
• Airline support facilities<br />
include:<br />
— Fuel storage<br />
— Ground support<br />
equipment maintenance<br />
and storage<br />
— Deicing facilities<br />
— Aircraft maintenance<br />
— Flight kitchen<br />
• Fuel storage capacity<br />
should be increased by<br />
160,000 gallons to a<br />
total of 600,000 gallons<br />
to maintain 7 days of<br />
reserve by 4.0 MAP.<br />
1.<br />
Existing Facilities<br />
Fuel Storage<br />
• Jet fuel used by the passenger and all-cargo airlines is currently<br />
stored in two above ground storage tanks located on the south<br />
side of the Airport, with a total gross storage capacity of 440,000<br />
gallons of jet fuel. Requirements for fuel storage facilities were<br />
focused on the Airport’s main fuel farm. It was assumed that any<br />
expansion plan for the general aviation fuel farms would be the<br />
result of a business decision by the FBOs to construct additional<br />
storage capacity.<br />
• Requirements were based on an analysis of historical fuel<br />
flowage and aircraft operations data for the Airport in 2012.<br />
• Fuel storage requirements are expressed in terms of gross tank<br />
storage volume as well as land area required so that the Airport<br />
can (1) prepare to accommodate future demand for storage<br />
capacity without interfering with the business decisions of the<br />
passenger and all-cargo airlines; and (2) ensure that no other<br />
facilities encroach on the area required for future fuel storage<br />
facility development.<br />
• The 440,000-gallons of jet fuel storage capacity, situated on<br />
approximately 1.7 acres of land, provided a 7-day reserve supply<br />
of jet fuel in 2012. By 4.0 MAP, storage requirements would<br />
range from approximately 260,000 gallons for a 3-day reserve to<br />
860,000 gallons for a 10-day reserve, occupying land areas<br />
ranging from 1.0 acre to 3.2 acres, as illustrated on Figures 44<br />
and Table 22.<br />
• The number of days’ supply of fuel stored onsite in reserve is a<br />
business decision to be made by the airlines serving the Airport.<br />
In addition, the number and configuration of the tanks to be<br />
provided are ultimately determined by the airlines based on<br />
operating considerations, such as the tank filling and fuel settling<br />
process, as well as the reserve supply desired.<br />
900,000<br />
800,000<br />
700,000<br />
600,000<br />
500,000<br />
400,000<br />
300,000<br />
200,000<br />
100,000<br />
Figure 44<br />
Fuel Storage Requirements<br />
2.5 MAP 4.0 MAP<br />
3.0 MAP<br />
0<br />
2015 2020<br />
Year<br />
2025 2030<br />
3-day supply 5-day supply 7-day supply 10-day supply<br />
Table 22<br />
Fuel Storage Land <strong>Area</strong> Requirements<br />
3-day reserve supply<br />
Fuel storage (gallons)<br />
Land area (acres)<br />
5-day reserve supply<br />
Fuel storage (gallons)<br />
Land area (acres)<br />
7-day reserve supply<br />
Fuel storage (gallons)<br />
Land area (acres)<br />
10-day reserve supply<br />
Fuel storage (gallons)<br />
Land area (acres)<br />
Requirements<br />
4.0 MAP<br />
Existing capacity - 440,000 gallons<br />
256,800<br />
1.0<br />
428,000<br />
1.6<br />
599,200<br />
2.3<br />
856,000<br />
3.2<br />
56<br />
TERMINAL AREA CONCEPT PLAN TECHNICAL REPORT<br />
Des Moines International Airport
Airline Support Facility Requirements<br />
KEY POINTS<br />
• Additional GSE storage<br />
will be required to<br />
support the expansion<br />
of the passenger<br />
terminal building.<br />
• It is recommended that<br />
a GSE maintenance<br />
facility be built to<br />
minimize maintenance<br />
activities occurring on<br />
the apron.<br />
• A new consolidated<br />
deicing facility will be<br />
required to handle<br />
future traffic levels.<br />
• No additional airline<br />
support facilities are<br />
required to handle<br />
projected traffic<br />
throughout planning<br />
period.<br />
1.<br />
Existing Facilities<br />
Ground Support Equipment Maintenance and Storage<br />
1.1 acre will be required for on-stand and on-apron<br />
storage of GSE equipment. Additionally, an acre parcel<br />
should be reserved for a GSE maintenance facility.<br />
Deicing facility<br />
A new deicing facility will be required to handle future<br />
activity levels. A 1.6-acre composite deicing pad can<br />
accommodate two narrowbody aircraft simultaneously<br />
or one widebody aircraft. Additional taxiway<br />
connectors would be required to link the new pad to<br />
the existing airfield system.<br />
Aircraft Maintenance<br />
Requirements for facilities that are leased by the<br />
airlines or directly support airline operations are<br />
typically established based on airline business<br />
decisions. The need for aircraft maintenance facilities<br />
is not necessarily related to the number of aircraft<br />
operations at a given airport and it is, therefore,<br />
difficult to forecast demand for such facilities.<br />
Hangar #29 is too small and needs to be expanded or<br />
relocated to larger site.<br />
Flight Kitchen<br />
No flight kitchen currently operates at the Airport.<br />
When required, in-flight meals are either prepared<br />
offsite and are trucked to the Airport or loaded at the<br />
hub for a round trip. As an industry trend, the need for<br />
flight kitchens has diminished over the past decade as<br />
the result of airline cutbacks on complimentary<br />
onboard meal service. Even with the slight increase in<br />
the availability of buy-on-board meal service, the<br />
packaging and distribution of these on-board meal<br />
types are more efficient than that for the hot meals<br />
that were common in the past. Therefore, as a result<br />
of this trend, it is expected that future activity at the<br />
Airport will not be sufficient to sustain operation of a<br />
flight kitchen and no on-Airport flight kitchen is<br />
recommended throughout the planning period.<br />
1.<br />
Existing Facilities<br />
On-stand storage is provided in<br />
between gates on the terminal<br />
apron.<br />
1.<br />
Existing Facilities<br />
UA leases a garage a garage space space to<br />
perform<br />
to perform<br />
maintenance<br />
maintenance<br />
on<br />
equipment.<br />
on equipment.<br />
All other airlines perform the<br />
maintenance All other airlines on the apron. perfo<br />
Ground Support Equipment Storage Requirements<br />
2.<br />
Methodology and Assumptions<br />
On-stand equipment areas for equipment that must be readily<br />
accessible when an aircraft pulls onto a stand, calculated by:<br />
1 - Estimating the number of GSE pieces required to support<br />
airline operations at the future gates<br />
2- Converting the number of pieces into a required square<br />
footage<br />
3- Adding a 30% allowance for circulation<br />
On-apron equipment areas for backup GSE used for routine<br />
aircraft handling as well as less-frequently used maintenance<br />
equipment, calculated by:<br />
1- Assuming that GSE in mid-term hold equal 35% of staged GSE<br />
2- Converting the number of pieces into a required square<br />
footage<br />
3- Adding a 20% allowance for circulation<br />
Ground Support Equipment Maintenance Facility Requirements<br />
2.<br />
Assumptions<br />
• Percentage of GSE vehicles in workshop 8%<br />
• Workshop area per vehicle (s.f.) 500<br />
• Gross land area multiplier 4<br />
3.<br />
PAL2.0 Requirements<br />
Equipment parking areas<br />
(square feet):<br />
• On-stand 37,200<br />
• On-apron 12,000<br />
• Total 49,200<br />
Or 1.1 acre<br />
3.<br />
PAL2.0 Requirements<br />
Workshop requirement:<br />
10,000 square feet<br />
Total land area (approx.): 0.9<br />
acre<br />
57<br />
TERMINAL AREA CONCEPT PLAN TECHNICAL REPORT<br />
Des Moines International Airport
Airport Support Facility Requirements<br />
General Aviation Apron and Aircraft Storage Facilities<br />
KEY POINTS<br />
• Airport support facilities<br />
include:<br />
— Aircraft rescue and fire<br />
fighting<br />
— Airport maintenance<br />
— Airport administration<br />
— FAA facilities<br />
• Maintenance facilities<br />
need to be expanded<br />
and consolidated.<br />
• Other airport support<br />
facilities will be<br />
adequate through the<br />
planning period<br />
Aircraft Rescue and Fire Fighting<br />
The ARFF facility will be adequate throughout the planning period:<br />
1.<br />
Existing Facilities<br />
• The facility is currently classified as Index C<br />
• No index increase is expected based on the forecast future fleet mix<br />
• No additional ARFF equipment will be required throughout the planning<br />
period<br />
• The existing facility meets FAR-mandated response time requirements thanks<br />
to its location immediately north of the intersection of Runways 13-31 and 5-<br />
23. Unless significant airfield expansion is recommended, this location will be<br />
adequate throughout the planning period.<br />
Airport Maintenance Facility<br />
Building and airfield maintenance facility needs do not necessarily increase<br />
proportionally with activity, but are more a function of the overall pavement,<br />
grassy areas, and terminal square footage requiring maintenance as well as<br />
climatic conditions (for snow/ice removal). At <strong>DSM</strong>, maintenance facilities will<br />
need to be consolidated as well as expanded to handle the improvement<br />
projects that will be recommended as part of the <strong>Terminal</strong> <strong>Area</strong> <strong>Concept</strong> <strong>Plan</strong>.<br />
Maintenance areas located inside the terminal building are addressed in the<br />
terminal requirements analysis.<br />
Airport Administration<br />
Administration space is currently sized adequately and an increase in the<br />
number of administrative staff at the Airport is not anticipated. Therefore the<br />
current administration space is adequate throughout the planning period.<br />
FAA Facilities<br />
The FAA has not indicated that the ATCT is undersized or in need of<br />
rehabilitation at this time.<br />
During the alternatives evaluation phase, additional analyses will be required<br />
to determine if the development recommendations impact the line-of-sight<br />
between the ATCT and all movement areas on the airfield.<br />
58<br />
TERMINAL AREA CONCEPT PLAN TECHNICAL REPORT<br />
Des Moines International Airport
CONCEPT ALTERNATIVES ANALYSIS<br />
• Land Use Alternatives<br />
• <strong>Terminal</strong> Alternatives
Land Use Alternatives<br />
Alternatives analysis and evaluation<br />
KEY POINTS<br />
• The initial step in the<br />
alternatives screening<br />
process was to look at<br />
the needs of each<br />
functional component<br />
and develop layouts<br />
showing how these<br />
“chunks” of land could<br />
be organized<br />
• Land Use Alternatives 1<br />
and 3 were selected as<br />
the top two<br />
This section of the technical report documents the<br />
alternatives analysis portion of the <strong>Terminal</strong> <strong>Area</strong> <strong>Concept</strong><br />
<strong>Plan</strong> study. This plan element was accomplished in two<br />
rounds – first a high level screening of on-airport land uses<br />
and then development of terminal facility alternatives on<br />
the short-listed land use alternatives.<br />
To develop the land use alternatives, the size of the area<br />
needed to support long term facilities/operations for each<br />
of the Airports functional areas was determined. These<br />
areas were placed in various configurations around the<br />
airport based on size, relationship to airfield as well as to<br />
other uses, and particular geometric needs. For example,<br />
general aviation facilities are located in three different<br />
quadrants and there was a stated desire to consolidate<br />
that function into a single quadrant for reasons of<br />
efficiency. Also, consideration was given to the fact that<br />
certain facilities (such as the IANG) reflected sizable<br />
investments in infrastructure and the planning team was<br />
careful with suggestions on which facilities should be<br />
relocated.<br />
The process of screening the alternatives is graphically<br />
shown in Figure 45. The primary tool used in the screening<br />
process was a list of pros and cons of each alternative.<br />
These were presented to the Advisory Committee, who<br />
deliberated and determined the short list.<br />
Land Use Alternatives<br />
Figures 46 through 49 on the following pages present<br />
graphically each of the four land use alternatives prepared<br />
for this study. The figures also include a listing of the pros<br />
and cons associated with each alternative.<br />
Shortlisted Land Use Alternatives<br />
Alternatives 1 and 3 were shortlisted for further analysis.<br />
Key reasons the Advisory Committee chose these land use<br />
alternatives include:<br />
• Alternative 1 – This land use alternative was chosen<br />
because of the existing investment in terminal support<br />
infrastructure and the desire to explore if it was feasible<br />
for building a new terminal building in this area.<br />
• Alternative 3 – This land use alternative shows<br />
development of a new terminal complex in the south air<br />
cargo area. The extensive amount of heavy-duty apron<br />
was viewed as an asset that could be readily adapted to<br />
commercial passenger aircraft parking.<br />
Figure 45<br />
Flow Chart of Land Use Alternatives Screening Process<br />
Des Moines International Airport<br />
60<br />
TERMINAL AREA CONCEPT PLAN TECHNICAL REPORT<br />
Des Moines International Airport
Land Use Alternatives<br />
Long list land use alternatives – Alternative 1<br />
Figure 46<br />
Land Use Alternative 1<br />
Des Moines International Airport<br />
shortlisted<br />
Pros<br />
• 20 year demands can be accommodated with this configuration.<br />
• Reconfiguration of IANG leasehold areas provide operational flexibility<br />
and other opportunities to Airport<br />
• Maintains each major functional component largely within its current<br />
proximity, preserving infrastructure investments<br />
• Least amount of disruption for non-terminal functions<br />
• T-hangars can continue to be developed in their current area through a<br />
logical expansion pattern<br />
Cons<br />
• Large Signature FBO complex in existing terminal area must be relocated<br />
to north GA/Corporate land use area<br />
• Construction phasing of a terminal on the current site can add<br />
complexities and costs, as compared to a new building on a greenfield<br />
site<br />
• Excess air cargo facilities (including aircraft parking apron) will continue<br />
to be underutilized<br />
• Corporate GA will be fully consolidated, providing efficiencies and deconflicting<br />
the terminal area<br />
• <strong>Terminal</strong> expansion can be phased as budget allows<br />
61<br />
TERMINAL AREA CONCEPT PLAN TECHNICAL REPORT<br />
Des Moines International Airport
Land Use Alternatives<br />
Long list land use alternatives – Alternative 2<br />
Figure 47<br />
Land Use Alternative 2<br />
Des Moines International Airport<br />
Pros<br />
• 20-year demands can be accommodated with this configuration<br />
• Reconfiguration of IANG leasehold areas provide operational flexibility<br />
and other opportunities to Airport<br />
• Opportunities for establishing and expanding the passenger terminal<br />
area are significantly improved<br />
• Excess air cargo facilities, primarily aircraft parking apron, would be<br />
more fully utilized by a passenger terminal use<br />
Cons<br />
• Cost to convert air cargo area (apron/utilities) to passenger terminal use<br />
could be significant<br />
• Cost to relocate air cargo facilities to existing terminal area could be<br />
significant<br />
• Impact of air cargo use on east site, near residential, could result in<br />
impacts<br />
• T-hangars would need to be relocated to the north quadrant<br />
• Vehicular access to passenger terminal area improved over current<br />
situation<br />
• Airline facilities (maintenance hangar) would need to be removed to<br />
make room for the terminal development<br />
• Allows Signature FBO to remain in place and potentially expand<br />
• Fuel farm is close to the airlines, who are a major user<br />
62<br />
TERMINAL AREA CONCEPT PLAN TECHNICAL REPORT<br />
Des Moines International Airport
Land Use Alternatives<br />
Long list land use alternatives – Alternative 3<br />
Figure 48<br />
Land Use Alternative 3<br />
Des Moines International Airport<br />
shortlisted<br />
Pros<br />
• 20-year demands can be accommodated with this configuration<br />
• Reconfiguration of IANG leasehold areas provide operational flexibility<br />
and other opportunities to Airport<br />
• Opportunities for establishing and expanding the passenger terminal<br />
area are significantly improved<br />
• Excess air cargo facilities, primarily aircraft parking apron, would be<br />
more fully utilized by a passenger terminal use<br />
• Vehicular access to passenger terminal area improved over current<br />
situation<br />
Cons<br />
• Cost to convert air cargo area (apron/utilities) to passenger terminal use<br />
could be significant<br />
• Cost to relocate air cargo facilities to existing terminal area could be<br />
significant<br />
• T-hangars would need to be relocated to the north quadrant<br />
• Signature FBO would need to be relocated to the north quadrant<br />
• Airline facilities (maintenance hangar) would need to be removed to<br />
make room for the terminal development<br />
• Fuel farm is close to the airlines, who are a major user<br />
• Air cargo to be relocated to the east quadrant<br />
63<br />
TERMINAL AREA CONCEPT PLAN TECHNICAL REPORT<br />
Des Moines International Airport
Land Use Alternatives<br />
Long list land use alternatives – Alternative 4<br />
Figure 49<br />
Land Use Alternative 4<br />
Des Moines International Airport<br />
Pros<br />
• 20-year demands can be accommodated with this configuration<br />
• Reconfiguration of IANG leasehold areas provide operational flexibility<br />
and other opportunities to Airport<br />
• Opportunities for establishing and expanding the passenger terminal<br />
area are significantly improved under this scheme<br />
• Excess air cargo facilities, primarily aircraft parking apron, would be<br />
more fully utilized by a passenger terminal use<br />
• Vehicular access to passenger terminal area improved over current<br />
situation<br />
Cons<br />
• Cost to convert air cargo area (apron/utilities) to passenger terminal use<br />
could be significant<br />
• Cost to relocate air cargo facilities could be significant<br />
• T-hangars and Signature FBO would need to be relocated to the north<br />
quadrant<br />
• Airline facilities (maintenance hangar) would need to be removed to<br />
make room for the terminal development<br />
• Fuel farm is close to the airlines, who are a major user<br />
64<br />
TERMINAL AREA CONCEPT PLAN TECHNICAL REPORT<br />
Des Moines International Airport
<strong>Terminal</strong> Alternatives<br />
Initial list and screening of alternatives<br />
KEY POINTS<br />
• Two terminal<br />
alternatives were<br />
developed for each of<br />
the short-listed land use<br />
plans<br />
• Initial evaluation<br />
reduced the terminal<br />
alternatives from four to<br />
two<br />
This section describes the development and evaluation of<br />
the terminal complex alternatives. Alternatives were<br />
formulated to meet the requirements documented in the<br />
facility requirements section.<br />
<strong>Terminal</strong> area alternatives were developed and evaluated<br />
through an integrated and collaborative approach.<br />
Working in close collaboration with executive management<br />
at the Des Moines International Airport and the <strong>Terminal</strong><br />
<strong>Area</strong> <strong>Concept</strong> <strong>Plan</strong> Advisory Committee, a set of goals and<br />
objectives were established for the Master <strong>Plan</strong> project.<br />
The goals and objectives identified were:<br />
• Develop a long-term solution to the obsolescence of the<br />
existing passenger terminal complex and its lack of<br />
capacity expansion potential<br />
• Provide a comprehensive look at each of the Airport’s<br />
functional components to ensure that corresponding<br />
components could grow and meet projected demands<br />
• Propose a terminal plan that is functional, affordable,<br />
and enhances the overall passenger experience<br />
An initial set of alternatives was formulated based on longterm<br />
development options to inform near-term strategies.<br />
Aircraft gate capacity was studied to identify potential for<br />
growth at both the south air cargo site and the existing<br />
terminal site. Through primary screening of the initial<br />
alternatives, two options were selected for further<br />
development. Detailed plans and cost estimates were then<br />
prepared for the shortlist alternatives, which were subject<br />
to secondary screening evaluation. These screening<br />
criteria were established to evaluate financial, operational,<br />
and environmental impacts of each alternative, which led<br />
to the ultimate selection of a preferred terminal<br />
alternative. Figure 50 illustrates a flowchart of the<br />
terminal alternatives screening process.<br />
Initial <strong>Terminal</strong> <strong>Area</strong> Alternatives<br />
Informed by the two short-listed land use alternatives<br />
addressed in the previous section, two potential sites were<br />
identified for passenger terminal area development – the<br />
current south air cargo site and the existing terminal area.<br />
Four initial terminal alternatives were generated to explore<br />
and understand the feasibilities and constraints on each<br />
site. Figure 51 shows two alternatives on the south air<br />
cargo site – Alternatives 1 and 2. Alternative 1 capitalizes<br />
on the existing cargo apron for the initial 14 gates required<br />
by 3.0 MAP, which requires some demolition of existing<br />
facilities to implement. On the other hand, Alternative 2<br />
requires demolition of four existing aircraft hangars and a<br />
cargo sorting facility to the west in order to build the new<br />
aircraft apron needed to meet gate demand. This option<br />
imposes more disruptions to current airport operations as<br />
compared to Alternative 1. Both options require construction<br />
of a full-length parallel taxiway southwest of Runway 13-31 as<br />
well as new access roadways and a 4-level garage to support<br />
the concept. The full-build 18 gates scenario is shown on<br />
both options meeting 4.0 MAP requirements.<br />
Figure 52shows two alternatives on the existing terminal site<br />
– Alternative 3 and 4. Alternative 3 indicates a new terminal<br />
Figure 50<br />
Flow Chart of <strong>Terminal</strong> Alternatives Screening Process<br />
Des Moines International Airport<br />
and concourse offset to the northwest of the existing<br />
terminal, which would require complex phasing to construct<br />
while the Airport remains in operation. Alternative 4 is easier<br />
to phase with the new terminal located just north of the<br />
existing, providing the least amount of disruption to existing<br />
operations during construction. Since Alternative 3 imposes<br />
the most disruptions to current Airport operation, which<br />
could be expensive and a cause for passenger dissatisfaction,<br />
this option was quickly dismissed as an infeasible alternative.<br />
Based on the pros and cons described herein, the <strong>Terminal</strong><br />
<strong>Area</strong> <strong>Concept</strong> <strong>Plan</strong> Advisory Committee selected <strong>Terminal</strong><br />
Alternatives 1 and 4, representing the south cargo site and<br />
the existing terminal site, respectively, for further refinement.<br />
65<br />
TERMINAL AREA CONCEPT PLAN TECHNICAL REPORT<br />
Des Moines International Airport
<strong>Terminal</strong> Alternatives<br />
Long-list terminal alternatives<br />
Figure 51<br />
Long-list <strong>Terminal</strong> Alternatives – South Air Cargo Site<br />
Des Moines International Airport<br />
Figure 52<br />
Long-list <strong>Terminal</strong> Alternatives – Existing <strong>Terminal</strong> Site<br />
Des Moines International Airport<br />
shortlisted<br />
TERMINAL<br />
ALTERNATIVE 1<br />
TERMINAL<br />
ALTERNATIVE 3<br />
TERMINAL<br />
ALTERNATIVE 2<br />
shortlisted<br />
TERMINAL<br />
ALTERNATIVE 4<br />
66<br />
TERMINAL AREA CONCEPT PLAN TECHNICAL REPORT<br />
Des Moines International Airport
<strong>Terminal</strong> Alternatives<br />
Short-listed <strong>Terminal</strong> Alternative 1<br />
<strong>Terminal</strong> Alternative 1<br />
Figures 53 and 54 show the more developed Alternative 1<br />
with a two-level terminal processor at approximately 250<br />
feet deep by 600 feet wide that’s centrally located on the<br />
existing aircraft apron. Both passenger processing for<br />
departures and arrivals are located on the ground level,<br />
with the security screening checkpoint and a single-loaded<br />
concourse (approximately 80 feet wide) running along the<br />
northwest-southeast direction situated on the second<br />
level. The linear concourse is configured to accommodate<br />
18 gates, required by 4.0 MAP, with expansion capabilities<br />
on both the southeast or southwest end, as shown dashed.<br />
A four-level parking garage is provided directly across from<br />
the terminal processor with an elevated pedestrian bridge<br />
linking Level 2 of the garage to the second level security<br />
screening checkpoint for passenger convenience. The<br />
public garage footprint measures approximately 360 feet deep by<br />
840 feet wide and can hold roughly 1,080 parking spaces on each<br />
level with Level 1 dedicated for rental car ready/return<br />
operations. Future expansion is available directly to the east and<br />
west of the proposed garage.<br />
Additional required infrastructure includes new terminal access<br />
roadways and two parallel terminal curbsides - with an inner<br />
curb to serve private vehicles and an outer curb dedicated to<br />
commercial vehicles. The terminal loop road wraps around the<br />
Airport’s existing fuel farm facility to avoid expensive relocation<br />
costs. A new fuel access road is shown west of the existing fuel<br />
farm to provide vehicular access to the fuel farm and airport<br />
maintenance facilities that will remain in this area. A 340-space<br />
employee surface parking lot is provided west of the new parking<br />
garage and a potential hold lot is shown north of the existing<br />
surface Lot #4 (existing rental car stacking and storage lot).<br />
The existing parking garages will be converted to provide<br />
remote parking and a new shuttle route will be needed to<br />
transfer passengers between the facilities potential. Future<br />
expansion sites for surface parking lots are shown dashed on<br />
Figure 54.<br />
For safety reasons (avoiding crossing an active runway) a fulllength<br />
parallel taxiway southwest of Runway 13-31, as shown in<br />
Figure 53, is required if a passenger terminal building is built on<br />
this site. A west deicing pad able to accommodate two<br />
narrowbody aircraft, parked side-by-side, as well as additional<br />
apron to park four remain overnight (RON) positions on the far<br />
west end and three RON positions on the far east end are also<br />
needed as a part of this terminal alternative.<br />
Figure 53<br />
<strong>Terminal</strong> Alternative 1 – 3D Massing Overview<br />
Des Moines International Airport<br />
Figure 54<br />
<strong>Terminal</strong> Alternative 1 – Full Build Scenario (18 Gates)<br />
Des Moines International Airport<br />
Aerial Source: Google Earth<br />
67<br />
TERMINAL AREA CONCEPT PLAN TECHNICAL REPORT<br />
Des Moines International Airport
<strong>Terminal</strong> Alternatives<br />
Short-listed <strong>Terminal</strong> Alternative 1<br />
<strong>Terminal</strong> Phasing<br />
<strong>Terminal</strong> Alternative 1 should be constructed in two phases –<br />
Phases 1 and 2, as shown on Figure 55. Enabling projects are<br />
organized as Phase 0.<br />
Phase 0 requires relocation of Signature Flight Support from<br />
the existing east quadrant into the Iowa Air National Guard<br />
(IANG) site to the north. As of the writing of this document,<br />
the Airport is in discussions with IANG personnel regarding<br />
the ultimate makeup of the IANG facilities , although it is<br />
assumed a portion will be given back to the Airport since the<br />
IANGs mission has changed and there are facilities they no<br />
longer need or can support. The Airport plans to convert<br />
approximately 18 acres of the IANG site, located immediately<br />
west of the existing north general aviation quadrant, into a<br />
new and consolidated Fixed Based Operator / General<br />
Aviation facility. Once Signature Flight Support vacates the<br />
east quadrant, the air cargo operators will relocate to this site<br />
and allow for demolition and site preparation to take place at<br />
the south cargo site. A new fuel access road will also be<br />
constructed in this phase to provide dedicated access to the<br />
fuel farm and airport maintenance facilities while demolition<br />
takes place.<br />
Phase 1 is the first construction phase that requires building a<br />
full-length parallel taxiway on the southwest side of Runway<br />
13-31 in order to operate the new south passenger terminal.<br />
The entire terminal processor, a linear concourse - singleloaded<br />
- to accommodate 14 aircraft gates (meeting 3.0 MAP<br />
requirements) with 4 narrowbody RON parking positions<br />
west of the new terminal building will also be built under this<br />
phase. This concourse configuration takes full advantage of<br />
the existing cargo apron with a small apron addition needed<br />
at the northwest corner to serve as a west deicing pad able<br />
to park two side-by-side narrowbody aircraft. New terminal<br />
access roadways, curbsides, Air Operations <strong>Area</strong> (AOA)<br />
perimeter fences, first phase of the new 4-level parking<br />
garage (610 spaces per level) with rental car ready/return on<br />
Level 1, a customer service building with an elevated<br />
pedestrian bridge, and a temporary surface lot east of the<br />
new garage to hold 430 parking spaces are also shown to<br />
occur in Phase 1. A new shuttle route along the existing<br />
Airport Frontage Road will be needed to transfer passengers<br />
between the new passenger terminal to the existing parking<br />
garages (to be converted into remote parking spaces). A<br />
340-space employee parking lot east of the new parking<br />
garage and a potential hold lot along the new shuttle route<br />
will also be provided during this phase.<br />
Phase 2 will require demolition of Building 31, the south<br />
cargo building, prior to the new apron construction needed<br />
to provide 4 additional aircraft gates (for a total of 18 gates)<br />
and 3 remain overnight (RON) aircraft parking positions to<br />
meet passenger demand at 4.0 MAP. The 4-level parking<br />
garage will be expanded to the east to handle a total of<br />
1,080 parking spaces per level. Two potential lots are<br />
identified east of the new parking garage to accommodate<br />
future parking demands (shown dashed on Figure 55).<br />
Cost Estimates<br />
The costs to build <strong>Terminal</strong> Alternative 1 are shown in Table 23<br />
below. Separate cost estimates were developed for the flat<br />
work (civil engineering) and vertical (buildings) portions of the<br />
proposed development, using different estimators specializing<br />
in those areas. Construction costs are the hard costs associated<br />
with the construction of the facilities; while soft costs include<br />
items such as design, construction administration, and<br />
contingencies. As this is a conceptual plan, there are generous<br />
contingencies (calculated based on a percentage of the<br />
construction cost estimates) build into the soft costs. At this<br />
initial stage of plan development, the cost to build <strong>Terminal</strong><br />
Alternative 1 to accommodate 14 gates is approximately $464<br />
million, with another $57 Million to add four gates in Phase 2.<br />
Table23<br />
<strong>Terminal</strong> Alternative 1 – Rough Order of Magnitude Cost Summary<br />
Des Moines International Airport<br />
Source: Foth Infrastructure & Environment; and<br />
CONNICO, December 2013<br />
68<br />
TERMINAL AREA CONCEPT PLAN TECHNICAL REPORT<br />
Des Moines International Airport
<strong>Terminal</strong> Alternatives<br />
<strong>Terminal</strong> Alternative 1 - phasing<br />
Figure 55<br />
<strong>Terminal</strong> Alternative 1 - Phasing <strong>Plan</strong>s<br />
Des Moines International Airport<br />
Phase 1 work:<br />
1. Construct new fulllength<br />
taxiway<br />
2. Build new terminal<br />
and apron for 14<br />
gates and 4 RON<br />
positions<br />
3. Construct deicing<br />
pad for 2 side-byside<br />
narrowbody<br />
aircraft<br />
4. Construct new<br />
roadways and<br />
curbsides<br />
5. Build Phase 1 of<br />
new 4-level garage<br />
structure,<br />
employee parking<br />
and hold lot<br />
EXISTING SOUTH AIR CARGO SITE<br />
PHASE 1 (14 GATES)<br />
Phase 0 work:<br />
1. Relocate<br />
“Signature” FBO<br />
to Iowa Air<br />
National Guard<br />
(IANG) site<br />
2. Relocate Air<br />
Cargo to old<br />
“Signature” site.<br />
3. Demolish existing<br />
buildings and<br />
access roads as<br />
shown dashed<br />
4. Build new fuel<br />
access road<br />
PHASE 0<br />
Phase 2 work:<br />
1. Demolish Building<br />
31 (South Cargo<br />
Building) prior to<br />
construction of<br />
Phase 2<br />
2. Construct new<br />
apron for 4 gates<br />
and 3 RON<br />
positions<br />
3. Construct Phase 2<br />
of new 4-level<br />
garage structure<br />
PHASE 2 (18 GATES)<br />
69<br />
TERMINAL AREA CONCEPT PLAN TECHNICAL REPORT<br />
Des Moines International Airport
<strong>Terminal</strong> Alternatives<br />
Short-listed <strong>Terminal</strong> Alternative 4<br />
<strong>Terminal</strong> Alternative 4<br />
The existing terminal complex sits on an already constrained<br />
site in the east quadrant, framed by the two runways on the<br />
west and Fleur Drive, a major traffic thoroughfare, to the east.<br />
Figures 56 and 57 below show a concept for the development<br />
of Alternative 4, which takes into account these physical<br />
constraints.<br />
Alternative 4 was developed with a main intent to explore<br />
viable terminal options on the east quadrant that makes full<br />
use of existing infrastructures to minimize construction cost.<br />
As shown on the full build scenario on Figure 57, a new twolevel<br />
terminal processor (250 feet deep by 600 feet wide) is<br />
strategically located parallel to Runway 5-23, rotated roughly<br />
45° east of the existing terminal structure. This placement<br />
would allow construction of the first terminal sub phase to<br />
have the least amount of impact to current airport operations.<br />
Similar to <strong>Terminal</strong> Alternative 1, both passenger processing<br />
for departures and arrivals are located on the ground level,<br />
with the security screening checkpoint and the singleloaded<br />
main concourse (approximately 80 wide) running<br />
along the southwest-northeast orientation on the second<br />
level. The linear concourse with an angled bend at the<br />
southwest end is configured to accommodate 18 gates,<br />
required by 4.0 MAP, with expansion capabilities on the<br />
southwest end to accommodate two additional aircraft<br />
gates, as shown dashed.<br />
A new four-level parking garage is provided directly across<br />
from the terminal processor, parallel to the new terminal<br />
curbsides, and attached to the northwest corner of the<br />
existing north parking garage. The public garage footprint is<br />
approximately 126,000 square feet, able to hold roughly<br />
450 parking spaces on each level with Level 1 dedicated to<br />
rental car operation.<br />
For passenger convenience, an elevated pedestrian bridge is<br />
provided, linking Level 2 of the public garage to the second level<br />
security screening checkpoint. A surface lot (approximately<br />
45,000 square feet), adjacent to the new garage, is needed to<br />
supplement the rental car ready/return spaces in the garage.<br />
New terminal access roadways and dual terminal curbsides -<br />
with an inner curb to serve private vehicles and an outer curb<br />
dedicated to commercial vehicles – are provided to address<br />
some of the operational and safety concerns that were<br />
discussed in the Existing Conditions section of this report.<br />
Considerations addressed include, limiting to two decision<br />
points at intersections, creating a more defined channelization<br />
from toll booths and merges on Cowles Drive, and providing<br />
appropriate distances between decision points.<br />
Figure 56<br />
<strong>Terminal</strong> Alternative 4 – 3D Massing Overview<br />
Des Moines International Airport<br />
Figure 57<br />
<strong>Terminal</strong> Alternative 4 – Full Build Scenario (18 Gates)<br />
Des Moines International Airport<br />
Aerial Source: Google Earth<br />
70<br />
TERMINAL AREA CONCEPT PLAN TECHNICAL REPORT<br />
Des Moines International Airport
<strong>Terminal</strong> Alternatives<br />
Short-listed <strong>Terminal</strong> Alternative 4<br />
A west deicing pad able to accommodate two narrowbody<br />
aircraft, parked side-by-side, as well as additional apron to<br />
park 2 RON positions on the far northeast corner and 5 RON<br />
positions north of Runway 31are also needed as a part of<br />
this terminal alternative.<br />
<strong>Terminal</strong> Phasing<br />
<strong>Terminal</strong> Alternative 4 will be constructed in two phases –<br />
Phases 1 and 2, as shown on Figure 58.<br />
Phase 0 requires relocation of Signature Flight Support,<br />
currently located north of the existing terminal building, into<br />
the Iowa Air National Guard (IANG) site that’s still under<br />
negotiations to return to the Airport. The Airport plans to<br />
convert this approximately 18 acres IANG site, immediately<br />
west of the existing north general aviation quadrant, into a<br />
new and consolidated Fixed Based Operator / General<br />
Aviation facility. Once Signature Flight Support vacates the<br />
east quadrant, demolition of the existing hangars and access<br />
roadways should occur. Construction of the first part of the<br />
new roadway system should then begin under this phase,<br />
which ties into the existing curbsides.<br />
Phase 1 is the first construction phase that will be built in<br />
two sub-phases: Phases 1A and 1B. The first part of the<br />
terminal processor, including the entire check-in/outbound<br />
baggage makeup area and a portion of the baggage<br />
claim/inbound baggage makeup area with an 8-gate linear<br />
concourse on the far northeast corner of the site will be<br />
built under Phase 1A. This allows construction to happen<br />
simultaneously while the Airport remain in operation at the<br />
existing terminal. Additional apron space to accommodate 2<br />
narrowbody remain overnight (RON) parking positions, a<br />
taxilane with the associated west deicing pad to park two<br />
side-by-side narrowbody aircraft should also be provided. A<br />
temporary link from the existing check-in lobby to the new<br />
processor is shown. Upon completion of Phase 1A, when<br />
the new 8-gate concourse begins operation, demolition of<br />
the existing 7-gate Concourse C should commence. For a<br />
short duration, the Airport will need to operate out of two<br />
separate facilities – 4 gates out of the remaining existing<br />
terminal and 8 gates out of the new terminal building on the<br />
northeast end.<br />
Phase 1B will include constructing the second part of the<br />
new terminal processor, a 6-gate concourse and the<br />
associated apron area when demolition of Concourse C is<br />
complete. Remainder of the new terminal access roadways,<br />
curbsides, Air Operations <strong>Area</strong> (AOA) perimeter fences will<br />
also be constructed in this phase. First part of the new 4-<br />
level parking garage at a footprint of approximately 72,500<br />
square feet (260 spaces per level) with rental car<br />
ready/return on Level 1 and public parking on Levels 2-4 will<br />
be required to meet 3.0 MAP demands. Directly adjacent<br />
to the garage is a customer service building with an elevated<br />
pedestrian bridge that links back to the second level security<br />
screening checkpoint at the new terminal building.<br />
Expansion of the economy parking lot to 400 spaces<br />
(approximately 112,000 square feet) and construction of a<br />
small surface lot southwest of the new garage to<br />
supplement RAC ready/return spaces in the garage are also<br />
needed. Remainder of the existing terminal and concourse<br />
can be demolished at the end of Phase 1B.<br />
Phase 2 will require construction of a new concourse extension<br />
to accommodate 4 additional aircraft gates for a total of 18<br />
gates to meet 4.0 MAP requirements. It will also require<br />
expanding the new 4-level garage by 190 spaces per level, at a<br />
footprint of approximately 53,600 square feet. Level 1 remains<br />
for RAC ready/return and Levels 2-4 are used for public parking.<br />
Economy Lot #4 will be converted entirely to RAC Quick Turn<br />
Around (QTA), staging, and storage. Construction of a 1,500<br />
space remote surface lot (approximately 420,000 square feet)<br />
for public parking is also needed in this phase.<br />
Cost Estimates<br />
The costs to build <strong>Terminal</strong> Alternative 4 are shown in Table 24.<br />
As this is a conceptual plan, there are generous contingencies<br />
(calculated based on a percentage of the construction cost<br />
estimates) build into the soft costs. At this initial stage of plan<br />
development, the cost to build <strong>Terminal</strong> Alternative 4 to<br />
accommodate 14 gates is approximately $363 million, with<br />
another $53 million to add four gates in Phase 2.<br />
Table 24<br />
<strong>Terminal</strong> Alternative 4 – Rough Order of Magnitude Cost Summary<br />
Des Moines International Airport<br />
Source: Foth Infrastructure & Environment; and CONNICO, December 2013<br />
71<br />
TERMINAL AREA CONCEPT PLAN TECHNICAL REPORT<br />
Des Moines International Airport
<strong>Terminal</strong> Alternatives<br />
<strong>Terminal</strong> Alternative 4 - phasing<br />
Figure 58<br />
<strong>Terminal</strong> Alternative 4 - Phasing <strong>Plan</strong>s<br />
Des Moines International Airport<br />
Phase 0:<br />
1. Relocate<br />
“Signature” FBO<br />
to Iowa Air<br />
National Guard<br />
(IANG) site<br />
2. Demolish existing<br />
buildings and<br />
access roads as<br />
shown dashed<br />
3. Build first part of<br />
new roadways<br />
PHASE 0<br />
Phase 1b:<br />
1. Build remainder of<br />
new terminal<br />
processor, 6 gate<br />
concourse and<br />
apron<br />
2. Construct<br />
remainder of new<br />
roadways<br />
3. Build first part of<br />
new 4-level garage<br />
structure with RAC<br />
on Level 1, parking<br />
on Levels 2 to 4<br />
4. Expand economy<br />
parking lot to 400<br />
spaces (112,000 sf)<br />
5. Demolish<br />
remainder of<br />
existing concourse<br />
and terminal at the<br />
end of this phase<br />
PHASE 1B (14 GATES)<br />
Phase 1a:<br />
1. Build first part of<br />
new terminal<br />
processor, 8 gate<br />
concourse and<br />
apron for 2 RON<br />
positions<br />
2. Build temporary<br />
link from existing<br />
ticketing lobby to<br />
new processor<br />
3. Construct new<br />
deicing pad and<br />
taxilane for 2<br />
side-by-side<br />
narrowbody<br />
aircraft<br />
4. Demolish existing<br />
Concourse C at<br />
end of this phase.<br />
PHASE 1A (8 GATES)<br />
Phase 2:<br />
1. Construct new<br />
concourse<br />
expansion and<br />
apron for 4<br />
additional gates<br />
and 5 RON<br />
positions<br />
2. Build garage<br />
expansion<br />
3. Convert all of Lot<br />
#4 to RAC<br />
storage/QTA<br />
4. Construct 1,500<br />
remote surface<br />
public parking<br />
spaces (420,000 sf)<br />
PHASE 2 (18 GATES)<br />
72<br />
TERMINAL AREA CONCEPT PLAN TECHNICAL REPORT<br />
Des Moines International Airport
<strong>Terminal</strong> Alternatives<br />
Evaluations matrix and selection of preferred terminal alternative<br />
Selection of Preferred <strong>Terminal</strong> Alternative<br />
<strong>Terminal</strong> Alternative 1 was selected as the preferred<br />
terminal alternative by the <strong>Terminal</strong> <strong>Area</strong> <strong>Concept</strong> <strong>Plan</strong><br />
Advisory Committee.<br />
Figure 59<br />
<strong>Terminal</strong> Alternative Evaluations Matrix<br />
Des Moines International Airport<br />
During Workshop #3, the two terminal alternatives were<br />
presented by the planning team. In addition, an evaluation<br />
matrix, shown in Figure 59, was also presented and<br />
explained. The evaluation matrix uses “stop light” chart<br />
graphics to describe how the respective terminal<br />
alternatives are judged against established criteria. The<br />
matrix does not factor in the fact that some criteria may be<br />
more important than others. However, from the<br />
discussions that took place among the Advisory Committee<br />
members, two criteria were regarded as perhaps most<br />
important in making this decision – long range expansion<br />
capability and passenger experience. <strong>Terminal</strong> Alternative<br />
1 clearly has the ability to add more gates (needed beyond<br />
the planning timeframe) than <strong>Terminal</strong> Alternative 4. With<br />
regard to the passenger experience, the fact that <strong>Terminal</strong><br />
Alternative 1 could be built while not disturbing existing<br />
passenger operations, was considered important.<br />
Criteria Alternative 1<br />
(South Cargo)<br />
Passenger Experience<br />
Flexibility<br />
Ease of Phasing<br />
Phasing Options<br />
Alternative 4<br />
(Existing <strong>Terminal</strong>)<br />
Best<br />
The financial feasibility of both terminal alternatives was<br />
also discussed during Workshop #3. At this initial<br />
conceptual stage, it would be challenging for the Airport to<br />
implement either <strong>Terminal</strong> Alternative 1 or 4. To make it<br />
viable financially, significant additional monies, outside of<br />
the typical funding scenarios, would need to be raised.<br />
The Financial Feasibility section of this report addresses<br />
that in more detail.<br />
Long-Range Expansion Capability<br />
Operational Efficiency<br />
Financial Feasibility<br />
Environmental<br />
Worst<br />
Compatibility with Airport Projects<br />
Impact to Stakeholders<br />
73<br />
TERMINAL AREA CONCEPT PLAN TECHNICAL REPORT<br />
Des Moines International Airport
PREFERRED ALTERNATIVES REFINEMENTS<br />
• Preferred Land Use Alternative Refinements<br />
• Preferred <strong>Terminal</strong> Alternative Refinements<br />
• Project Implementation <strong>Plan</strong>
Preferred Land Use Alternative<br />
Land use plan refinements<br />
This section of the technical report presents refinements to<br />
the land use plan and to the preferred terminal alternative,<br />
<strong>Terminal</strong> Alternative 1. It documents the evolution of the<br />
plans from rough concepts to more refined concepts. This<br />
is a key aspect of the overall project as each round of<br />
refinement yields a better, more efficient plan. The initial<br />
round of refinement on <strong>Terminal</strong> Alternative 1 yielded cost<br />
reductions in the $60-$70 million range. This is typical of<br />
such a planning process and it is reasonable to assume<br />
that as this plan moves from the conceptual stage to an<br />
even more refined planning and programming stage (prior<br />
to actual architectural and engineering design) additional<br />
efficiencies will be found.<br />
Preferred Land Use Alternative:<br />
Based on the selection of <strong>Terminal</strong> Alternative 1 as the<br />
preferred terminal alternative, Land Use Alternative 3<br />
becomes the preferred land use alternative, as shown on<br />
Figure 60. Based on discussions among Airport senior<br />
leadership, the Advisory Committee, and the planning<br />
team, the following refinements were made to the land<br />
use plan:<br />
• Combined General Aviation (T-hangars) and Iowa Air<br />
National Guard (IANG) land use designations on the<br />
northwest corner of the Airport to allow flexibility in<br />
land use to accommodate future IANG occupancy<br />
changes.<br />
• Identified the west quadrant of the Corporate General<br />
Aviation land use as areas currently under negotiations<br />
with IANG to return to the Airport.<br />
Figure 60<br />
Preferred Land Use Alternative<br />
Des Moines International Airport<br />
75<br />
TERMINAL AREA CONCEPT PLAN TECHNICAL REPORT<br />
Des Moines International Airport
Preferred <strong>Terminal</strong> Alternative<br />
Figure 61<br />
Preferred <strong>Terminal</strong> Alternative – 3D Massing Overview<br />
Des Moines International Airport<br />
Aerial Source: Google Earth<br />
76<br />
TERMINAL AREA CONCEPT PLAN TECHNICAL REPORT<br />
Des Moines International Airport
Preferred <strong>Terminal</strong> Alternative<br />
<strong>Terminal</strong> alternative refinements<br />
KEY POINTS<br />
• Several refinements<br />
were made to the layout<br />
of the concourse, rental<br />
counter and bag claim<br />
plans<br />
• Size of parking garage in<br />
Phase 1 reduced, with<br />
close-in surface parking<br />
added<br />
• <strong>Terminal</strong> roadways<br />
reconfigured to optimize<br />
automobile flow<br />
<strong>Terminal</strong> Alternative 1 was selected by the <strong>Terminal</strong> Advisory<br />
Committee as the preferred terminal alternative. Refinements<br />
were then incorporated into the preferred terminal alternative<br />
with the primary goals to reduce project cost and improve<br />
operational efficiencies. Refinements include:<br />
Airfield and <strong>Terminal</strong> -<br />
• Added a second deicing pad and aircraft apron for 3 RON<br />
positions to the east<br />
• Reduced concourse footprint by shortening concourse<br />
length and double-loading end gates<br />
• Reduced terminal footprint by eliminating in-terminal RAC<br />
counters and rotating baggage claim devices 90 degrees to<br />
decrease terminal depth<br />
• Extended pedestrian bridge connector from garage to upper<br />
level security screening checkpoint for passengers with no<br />
bags to check<br />
Parking and Roadways –<br />
• Relocated rental car counters from terminal to a<br />
separate customer service building adjacent to the<br />
garage where rental car ready/return is located to<br />
provide improved customer experience<br />
• Reduced garage size in Phase 1 and added close-in<br />
surface parking to provide “product” diversity<br />
• Removed “hold lot” and employee parking lots from<br />
South Cargo site<br />
• Reconfigured terminal roadways for more efficient<br />
flow<br />
As shown on Figures 62 and 63, the refined preferred<br />
terminal alternative indicates a linear concourse parallel<br />
to Runway 13-31 that is able to accommodate 18 aircraft<br />
gates to meet 4.0 MAP requirements. A two-level<br />
terminal building is centrally located to the concourse<br />
for passenger processing.<br />
On the ground level, passenger Check-in can be found to the<br />
east and Baggage Claim to the west of the terminal building.<br />
Security screening checkpoint is centrally located on the upper<br />
level with a direct link to the 4-level parking garage immediately<br />
southwest of the terminal building.<br />
The new parking garage is able to hold a total of 2,320 spaces<br />
(580 per level) with the entire first level dedicated to rental car<br />
operation. Footprint of the garage is approximately 173,000<br />
square feet with sloping floor ramps. A 5,200 square feet rental<br />
car customer service building is located just north of the new<br />
parking garage. Two surface lots are shown to the east and west<br />
of the parking garage, each to accommodate approximately 600<br />
uncovered parking spaces. The existing parking garage and<br />
surface lots will provide remote parking spaces via a shuttle<br />
route along the South Airport Frontage Road to transfer<br />
passengers to and from the new passenger terminal.<br />
Figure 62<br />
Preferred <strong>Terminal</strong> Alternative – 3D Massing Overview<br />
Des Moines International Airport<br />
Figure 63<br />
Preferred <strong>Terminal</strong> Alternative – Full Build Scenario (18 Gates)<br />
Des Moines International Airport<br />
77<br />
TERMINAL AREA CONCEPT PLAN TECHNICAL REPORT<br />
Des Moines International Airport
Preferred <strong>Terminal</strong> Alternative<br />
Phase 1 to provide capacity until 2042<br />
New terminal access roadways entering from SW 28 Street,<br />
directly off of Army Post Road, are provided with two<br />
terminal curbs - an inner curb to serve private vehicles and<br />
an outer curb for commercial vehicles. The terminal loop<br />
road avoids the Airport’s existing fuel farm facility in order<br />
to avoid expensive relocation cost. A separate utility road is<br />
shown west of the existing fuel farm to provide vehicular<br />
access to the airport fuel farm and maintenance support<br />
facilities located southwest of the new terminal complex.<br />
<strong>Terminal</strong> Phasing<br />
The preferred terminal alternative will require two main<br />
construction phases to implement – Phases 1 and 2, as<br />
shown on Figure 64. Phase 0 is a demolition and<br />
preparation phase.<br />
Phase 1 is the first construction phase that will be built in<br />
two sub-phases: Phases 1A and 1B. Intent is for the Airport<br />
to start operating out of the new passenger terminal at the<br />
completion of Phase 1A, while Phase 1B is under<br />
construction. Phase 1A requires construction of a new fulllength<br />
parallel taxiway southwest of Runway 13-31, the<br />
entire terminal processor and a portion of the concourse to<br />
accommodate 14 aircraft gates with 4 narrowbody remain<br />
overnight (RON) parking positions west of the new terminal<br />
building. This configuration takes full advantage of the<br />
existing cargo apron with new apron space needed to<br />
handle the west deicing pad to park two side-by-side<br />
narrowbody aircraft. New terminal access roadways,<br />
curbsides, Air Operations <strong>Area</strong> (AOA) perimeter fences, first<br />
phase of the new 4-level parking garage with rental car<br />
ready/return on Level 1, the customer service building with<br />
an elevated pedestrian bridge, and a small surface lot west<br />
of the new garage to hold 270 parking spaces are also<br />
required in Phase 1A. The shuttle route used to transfer<br />
passengers between the new passenger terminal to the<br />
existing parking garages for remote parking should also be<br />
in-place under this sub-phase. Phase 1B would require<br />
construction of a new apron for the east deicing pad to<br />
accommodate 2 additional side-by-side narrowbody aircraft,<br />
and new aircraft apron east of the new concourse to handle<br />
4 RON parking positions.<br />
Aerial Source: Google Earth<br />
Most of the facilities will need to be expanded in Phase 2 to<br />
meet 4.0 MAP passenger demand. A new hammerhead<br />
concourse, to the east on the second level, is required to<br />
handle 4 additional contact gates for a total of 18 aircraft<br />
gates needed by 4.0 MAP. Due to this demand, new apron is<br />
provided south of the east deicing pad to accommodate 3<br />
displaced narrowbody RON parking positions under this<br />
phase. The 4-level parking garage will be expanded to the<br />
east to accommodate an additional 600 parking spaces total,<br />
equivalent to 150 spaces on each level. A new 600 space<br />
surface lot is required to the east of the parking garage and<br />
an additional 330 spaces are required on the west surface lot.<br />
Additional terminal curb lengths, both inner and outer, are<br />
also required to meet passenger demand.<br />
Cost Estimates<br />
Table 25 provides a summary of the order of magnitude cost<br />
estimates for the preferred development alternative. Through<br />
a series of refinements to the initial plan, the total cost of the<br />
program was reduced from the initial $520 million to $468<br />
million. The costs are broken down by civil projects, buildings,<br />
and enabling projects. Enabling projects are necessary to<br />
allow for the major terminal complex elements to be<br />
constructed. Phase 1 costs are the most important for this<br />
planning effort as they are the focus of the financial capacity<br />
analysis. Phase 2 will not need to be implemented until about<br />
2042.<br />
Table 25<br />
Preferred <strong>Terminal</strong> Alternative - Refined Order Of Magnitude Cost Summary<br />
Des Moines International Airport<br />
78<br />
TERMINAL AREA CONCEPT PLAN TECHNICAL REPORT<br />
Des Moines International Airport
Preferred <strong>Terminal</strong> Alternative<br />
<strong>Terminal</strong> phasing plans<br />
Figure 64<br />
Preferred <strong>Terminal</strong> Alternative – Phasing <strong>Plan</strong>s<br />
Des Moines International Airport<br />
Footnote:<br />
1/ T-hangar demolition and relocation<br />
not included in the terminal project<br />
financial analysis or cost estimates<br />
Phase 0 work:<br />
1. Relocate “Signature” FBO<br />
to Iowa Air National<br />
Guard (IANG) site<br />
2. Relocate FedEx to IANG<br />
site<br />
3. Demolish existing<br />
buildings and access<br />
roads as shown dashed<br />
4. Build new fuel access<br />
road<br />
5. Relocate UPS to<br />
“Signature” site once<br />
new terminal is open for<br />
operation<br />
PHASE 0<br />
Phase 1A work:<br />
1. Construct new full-length<br />
taxiway<br />
2. Build new terminal and<br />
apron for 14 gates and 4<br />
remain overnight parking<br />
(RON) positions<br />
3. Construct west deicing<br />
pad to accommodate 2<br />
side-by-side narrowbody<br />
aircraft<br />
4. Construct new roadways,<br />
curbsides and AOA fence<br />
5. Build new 4-level parking<br />
garage with rental car<br />
ready/return on Level 1<br />
6. Build new RAC Customer<br />
Service Building and<br />
elevated pedestrian<br />
bridge<br />
7. Construct new surface<br />
parking lot<br />
PHASE 1A (14 GATES)<br />
Phase 1B work:<br />
1. Construct east<br />
deicing pad to<br />
accommodate 2<br />
side-by-side<br />
narrowbody aircraft<br />
2. Construct additional<br />
aircraft apron for 4<br />
remain overnight<br />
parking (RON)<br />
positions to the east<br />
PHASE 1B (14 GATES)<br />
Phase 2:<br />
1. Construct new apron<br />
for 3 remain<br />
overnight parking<br />
(RON) positions to<br />
the east<br />
2. Construct new<br />
hammerhead<br />
concourse to the<br />
east<br />
3. Build new garage<br />
expansion<br />
4. Construct new<br />
surface parking lots<br />
5. Extend terminal<br />
curbside<br />
PHASE 2 (18 GATES)<br />
79<br />
TERMINAL AREA CONCEPT PLAN TECHNICAL REPORT<br />
Des Moines International Airport
Project Implementation <strong>Plan</strong><br />
Full project phasing<br />
Figure 65<br />
Preferred <strong>Terminal</strong> Alternative – Project Implementation Phasing<br />
Des Moines International Airport<br />
Aerial Source: Google Earth<br />
80<br />
TERMINAL AREA CONCEPT PLAN TECHNICAL REPORT<br />
Des Moines International Airport
Project Implementation <strong>Plan</strong><br />
Enabling projects will be key to Phase 1 development phasing<br />
Through extensive collaboration with Airport management<br />
and the Airport’s consulting engineers, a list of enabling<br />
projects was identified prior to implementation of the<br />
preferred terminal project.<br />
Project Implementation Phasing<br />
Figure 65 provides a list of these enabling projects and the<br />
various work required at each phase to implement this<br />
terminal program. The Airport’s successful reclamation of<br />
approximately 18 acres of land (including apron areas)<br />
currently leased to the Iowa Air National Guard (IANG)<br />
located adjacent to the existing north general aviation area<br />
is critical to the overall program schedule. Possession of<br />
this IANG parcel will enable both FedEx and Signature<br />
Flight Support to move into this area and make way for<br />
demolition and preparation of the south cargo site for the<br />
new passenger terminal and the existing Signature site to<br />
become the new air cargo facility. The old 18 acres IANG<br />
parcel will eventually become the new consolidated Fixed<br />
Based Operator (FBO) / General Aviation (GA) facility<br />
situated on the north quadrant of the Airport.<br />
Aside from the suggested terminal phasing mentioned in<br />
the previous section, Phase 1 will also include converting<br />
two existing surface parking lots (Lots #3 and #4) into<br />
employee parking and rental car stacking and storage. At<br />
the completion of Phase 1, and once the new south<br />
passenger terminal is in full operation, the existing<br />
terminal and concourse building will be demolished to<br />
provide expanded apron space to handle cargo operation.<br />
Existing parking garages and surface lots will remain and be<br />
used as remote parking facilities.<br />
Project Implementation Schedule<br />
The project implementation schedule, as shown on Figure<br />
66, indicates the south passenger terminal’s Phase 1 (14<br />
gates) target Date of Beneficial Occupancy (DBO) in 2024.<br />
This informs that airline and terminal tenant coordination<br />
and programming should start no later than the beginning<br />
of 2016. Some enabling tenant relocations, such as<br />
FedEx’s temporary move and Signature’s permanent move<br />
to the old IANG site, which will become the new FBO/GA<br />
facility, should also occur around this time.<br />
<strong>Terminal</strong> site preparation should begin around 2017 when<br />
affected tenants have been relocated to their respective<br />
homes. The new full-length taxiway should start at the<br />
beginning of 2020, and will take several phases to build as<br />
indicated on the schedule. Assuming the new terminal will<br />
take a little more than 2 years to design, this element should<br />
start at the beginning of 2019. Accounting for approximately<br />
9 months for general contractor’s bidding, negotiations,<br />
Figure 66<br />
Preferred <strong>Terminal</strong> Alternative – Project Implementation Schedule<br />
Des Moines International Airport<br />
staging and coordination, and an estimated 2 years to<br />
construct, terminal construction should begin no later than<br />
early 2022 in order to meet the target DBO at the end of 2023.<br />
Construction of the apron, deicing pads and parking garage,<br />
rental car service building are independent projects; therefore,<br />
could occur concurrent to the terminal construction<br />
timeframe. Demolition of the existing terminal should begin in<br />
2024.<br />
81<br />
TERMINAL AREA CONCEPT PLAN TECHNICAL REPORT<br />
Des Moines International Airport
PRELIMINARY FINANCIAL CAPACITY ANALYSIS<br />
• Key Drivers<br />
• Industry Benchmarks<br />
• Preliminary <strong>Plan</strong> of Finance<br />
• Sensitivity Analyses and Financial Conclusions
Preliminary Financial Capacity Analysis<br />
Overview and Key Assumptions<br />
KEY POINTS<br />
• A comprehensive<br />
financial model was<br />
used to assess the<br />
reasonableness of the<br />
proposed terminal<br />
development program<br />
• Key financial drivers<br />
were developed jointly<br />
with the Airport<br />
This section of the technical report documents the<br />
preliminary financial capacity analyses conducted as<br />
part of the <strong>Terminal</strong> <strong>Area</strong> <strong>Concept</strong> <strong>Plan</strong>. Financial<br />
results were projected using a comprehensive<br />
financial planning model, and are considered high<br />
level preliminary results based on the conceptual<br />
nature of the <strong>Plan</strong>. The initial capacity analysis was<br />
conducted on two alternatives: <strong>Terminal</strong> Alternative 1<br />
and <strong>Terminal</strong> Alternative 4. Following the Advisory<br />
Committee’s selection of <strong>Terminal</strong> Alternative 1 as the<br />
preferred terminal alternative, and the refinement of<br />
the physical plan, a revised financial capacity analysis<br />
was conducted. Stress tests were also performed to<br />
test sensitivity to key variables.<br />
Key drivers<br />
Many factors (drivers) and assumptions went into the<br />
preparation of the preliminary financial capacity<br />
analysis. These key drivers are listed and discussed<br />
below.<br />
• Forecast Traffic Activity Levels. – Many of the<br />
sources of airport revenue are derived from activity<br />
projections. The most important of these is the<br />
number of passengers expected to use the airport.<br />
Passenger activity drives a number of key airport<br />
revenues, including terminal concessions, public<br />
parking, rental car, passenger facility charges<br />
(PFCs), as well as AIP grant funding levels.<br />
• Timing of Development – The Date of Beneficial<br />
Occupancy (or “DBO”) is projected to occur in<br />
2024. This is based on the implementation plan<br />
discussed in the previous section. Project costs,<br />
which were estimated in 2014 dollars, are<br />
escalated at 3% per year to the mid-point of<br />
construction to account for inflation, which is the<br />
reason project costs in this section are higher than<br />
those previously stated.<br />
• Project Costs<br />
– Projections of capital expenditures beyond the Authority’s<br />
current 2013 – 2017 Capital Improvement Program (“CIP”)<br />
were developed recognizing the time required to build the<br />
new terminal and need to maintain terminal operations and<br />
level of service. Improvements to the existing terminal are<br />
estimated at $5 million per year from 2016 through 2021;<br />
$4 million in 2018, $3 million in 2019, $2 million in 2020, and<br />
$1 million in 2021<br />
– Soft costs/contingency allowances applied to civil and<br />
vertical project costs<br />
– Escalation rate of 3.0% per year to midpoint of construction<br />
– 3.0 MAP program requirements at DBO<br />
– Post DBO, $2 million per year in capital expenditures net of<br />
grants, escalated at 3% per year from 2014<br />
• Grants<br />
– Federal Airport Improvement Program (AIP)<br />
entitlement/discretionary grants would fund 90% of the<br />
eligible costs of the new terminal taxiway, apron, and deicing<br />
facilities<br />
– AIP “entitlement” grants ($4 million per year) targeted to<br />
new terminal roadways beginning in 2019<br />
– TSA grant of $7 million for new terminal security<br />
infrastructure improvements<br />
– State vertical infrastructure grant for new Signature hangar<br />
of $2.5 million<br />
– Various levels of State and other non-AIP grants were<br />
assumed to meet feasibility targets<br />
• Passenger Facility Charge (PFC) Level<br />
– Current PFC level would remain at $4.50 (base case)<br />
– Sensitivity analyses included PFC levels of $6.00 and $8.50<br />
beginning in 2016, if authorized by Congress as part of the<br />
FAA reauthorization on October 1, 2015<br />
• Rental Car Customer Facility Charge (CFCs)<br />
– Amounts collected pre-DBO in excess of reimbursement for<br />
the Quick Turnaround (QTA) facility to be used for pay-asyou-go<br />
funding of program costs<br />
– Post DBO CFC revenues used to pay debt service on<br />
outstanding General Airport Revenue Bonds (GARBs) for<br />
debt related to rental car facilities (e.g., counters, readyreturn<br />
car parking<br />
• <strong>Plan</strong> of Finance<br />
– 30-year tax-exempt revenue bonds at 6.5% interest rate<br />
issued annually to minimize financing costs<br />
– Interest capitalized through DBO<br />
– Debt service reserve cash funded through bonds<br />
– PFC revenues leveraged on a direct off-set basis (which<br />
requires amendment to bond indenture)<br />
– Signature contributes $2.5 million to its new hangar<br />
• Airline Business Deal<br />
– Existing ratemaking approach.<br />
– Existing leasable space protocols, increase in rented<br />
exclusive use space<br />
– Amortization of existing terminal improvements expire at<br />
DBO and unamortized balance is not recovered<br />
(assuming 10 year amortization for pre-DBO<br />
improvements)<br />
• Operation & Maintenance (O&M) Expenses<br />
– Inflation of 3.5% per year over 2014 budgeted O&M<br />
expenses<br />
– O&M expense increase to reflect increase in gross<br />
terminal square footage<br />
– Increase in parking and rental car O&M expense to reflect<br />
(1) longer shuttle to economy parking (old garage) and<br />
additional patrons to shuttle to old garage and (2) O&M<br />
for new rental car customer service building<br />
– Aircraft Rescue and Firefighting services becomes<br />
Authority responsibility in 2015, resulting in increased<br />
O&M expenses of $1.2 million per year<br />
• Non-Airline Revenues<br />
– <strong>Terminal</strong> concession revenues increase with projected<br />
passenger growth and 2% per year inflation plus 15%<br />
boost in net terminal concession revenue per passenger<br />
at DBO<br />
– Rental car revenues increase with projected passenger<br />
growth and 2% per year inflation<br />
– Daily public parking rates increase $1 per day every three<br />
years beginning in 2018<br />
– Mesaba maintenance base rentals and one-third of UPS<br />
rentals for south site construction discontinued.<br />
– Other revenues increase by 1% per year<br />
83<br />
TERMINAL AREA CONCEPT PLAN TECHNICAL REPORT<br />
Des Moines International Airport
Preliminary Financial Capacity Analysis<br />
Industry Benchmarks to Gauge Reasonableness<br />
KEY POINTS<br />
• Industry benchmarks<br />
are used as a primary<br />
tool to assess the<br />
reasonableness of the<br />
proposed terminal<br />
development program<br />
• Recently completed and<br />
future capital programs<br />
at other airports are<br />
useful to understand<br />
and to provide context<br />
for evaluating industry<br />
airline cost per<br />
enplaned passenger<br />
data<br />
• Current levels of cost<br />
per enplaned passenger<br />
are not particularly<br />
relevant in terms of<br />
evaluating future<br />
investments<br />
Industry Benchmarks<br />
This element is focused on<br />
benchmark data related to the<br />
financing of capital programs at<br />
comparable large U.S. airports, with<br />
particular focus on comparable<br />
terminal development programs.<br />
Industry benchmarks are used heavily<br />
in this analysis because, on a<br />
preliminary basis, they represent<br />
strong tools for judging the<br />
reasonableness of the terminal<br />
development plan. Airline cost per<br />
enplaned passenger at airports<br />
(CPE)—the total amount paid by<br />
airlines in airport rents and fees<br />
divided by the total number of<br />
passengers enplaned at an airport—is<br />
an accepted industry metric used to<br />
evaluate the “reasonableness” or<br />
“affordability” of current airport<br />
operations and proposed future<br />
airport development.<br />
Following are key metrics that were calculated<br />
for this analysis, as well as an indication of<br />
recommended minimum/maximum levels.<br />
• Airline cost per enplaned passenger (CPE)<br />
– Comparisons with nearby airports with<br />
major terminal programs, as illustrated<br />
on Figure 67<br />
– Comparisons with peer airports (small<br />
and medium hub airports served by<br />
Southwest Airlines) shown on Figure 68<br />
• Airline CPE as a percent of fare revenue<br />
• Airline revenues as a percent of total airport<br />
revenues<br />
• Debt service coverage –airport revenues less<br />
operating expenses divided by<br />
annual debt service payments<br />
• Outstanding debt per enplaned passenger<br />
(DPE), as referenced on Figure 69<br />
• Liquidity or days cash on hand – unrestricted<br />
cash divided by annual operating expenses<br />
• Size of capital program<br />
Figure 67<br />
Airline CPE at Airports With Major <strong>Terminal</strong> Programs<br />
$17.00<br />
$16.00<br />
$15.00<br />
$14.00<br />
$13.00<br />
$12.00<br />
$11.00<br />
$10.00<br />
$9.00<br />
$8.00<br />
$7.00<br />
$6.00<br />
$5.00<br />
$4.00<br />
$3.00<br />
$2.00<br />
$1.00<br />
$0.00<br />
Figure 68<br />
2012 Airline CPE at Peer Airports With Similar Service<br />
75th Percentile<br />
($9.15)<br />
50th Percentile<br />
($7.67 Median)<br />
25th Percentile<br />
($6.33)<br />
Sources: Rating agency reports, FAA Form 5100-127, and Comprehensive Annual Financial <strong>Report</strong>s ("CAFRs").<strong>DSM</strong> 2025 CPE (in 2013$) with new terminal $200M Grant.<br />
$275<br />
$250<br />
$225<br />
$254<br />
Figure 69<br />
Debt per Enplaned Passenger - U.S. Small Hub Airports<br />
$200<br />
$175<br />
$150<br />
$198<br />
$183<br />
$175<br />
$154<br />
$149<br />
$125<br />
$100<br />
$75<br />
$50<br />
$43<br />
$25<br />
$24<br />
$16<br />
$-<br />
Sources: rating agency reports in 2012 and 2013.<br />
Estimated <strong>DSM</strong>* estimated after new after terminal new terminal (2025) (2025) with with $200 $200 million million non-AIP non-AIP grant. grant.<br />
84<br />
TERMINAL AREA CONCEPT PLAN TECHNICAL REPORT<br />
Des Moines International Airport
Preliminary Financial Capacity Analysis<br />
Preliminary <strong>Plan</strong> of Finance and Establishing Financial Targets<br />
KEY POINTS<br />
• The preliminary plan of<br />
finance, using key<br />
industry metrics as a<br />
guide, shows that the<br />
Airport must secure<br />
$200 million in non-AIP<br />
grants for the terminal<br />
development program to<br />
be affordable.<br />
Preliminary <strong>Plan</strong> of Finance<br />
Due to inflation of construction costs and the project schedule for<br />
the various components of the terminal development plan, the<br />
actual price tag for Phase 1 is $538 M (escalated from $420 M in<br />
2014 dollars). Following are recommendations for funding the<br />
proposed terminal development. The conceptual funding plan as<br />
illustrated on Figure 70 below shows the various sources of funds<br />
for this preliminary plan of finance.<br />
• Grants<br />
– Secure maximum AIP participation in the new terminal<br />
program for apron, taxiway, roadways<br />
– Secure state or other non-Federal grants to achieve financial<br />
affordability<br />
• PFCs<br />
– Amend bond indenture to maximize PFC leveraging via a<br />
direct off-set structure<br />
• Airline Business Deal<br />
– Engage airlines in the new terminal planning discussions<br />
early<br />
– Attempt to negotiate a new airline agreement with<br />
ratemaking that contemplates the new terminal<br />
Figure 70<br />
<strong>Concept</strong>ual Funding <strong>Plan</strong><br />
Credit/Structuring Debt and Establishing Financial Targets<br />
Regarding the Authority’s credit rating, the debt should be<br />
structured to maintain “A” credit rating. Financial targets were<br />
established as follows:<br />
– Airline CPE of < $13.50 (in 2014$)<br />
– CPE as a percent of fare revenues < 6%<br />
– Liquidity/days cash on hand > 365 Days<br />
– Debt per enplaned passenger of < $165<br />
– Debt service coverage of no less than 1.65x<br />
– Airline revenue as a percent of total airport revenue < 45%<br />
Preliminary Financial Projections:<br />
Comparison of Projected Financial Metrics to Targets and Medians<br />
Table 26 below, shows the preliminary results of the financial capacity<br />
analysis, based on how the key financial metrics compare to target<br />
levels. The primary variable shown in the table is the amount of non-<br />
AIP grants ($50M, $165M or $200M) the Airport will need to secure.<br />
The preliminary conclusion is that the Airport will need to secure a<br />
minimum of $200 million in non-AIP grants to meet the key metrics to<br />
be considered reasonable.<br />
Table 26<br />
Financial Metric Comparison<br />
2012 Preferred <strong>Terminal</strong> Alternative - 2025<br />
Moody's Financial Amount of Non-AIP Grant<br />
Financial Metric <strong>DSM</strong> Median* Targets $50 M $165 M $200 M<br />
Cost per enplaned passenger $8.90 $6.73 $22.26 $17.94 $16.63<br />
CPE discounted to 2013 $ $8.90 $6.73 $13.50 $17.55 $14.15 $13.11<br />
CPE as percent of fare revenues 4.6% n.a, 6.0% 8.1% 6.5% 6.0%<br />
Debt per enplaned passenger $43 $65 $165 $250 $173 $149<br />
Debt service coverage** 2.09 1.67 1.65 1.11 1.45 1.66<br />
Airline revenues as percent of total revenues 35.6% 27% 45.0% 50.0% 44.6% 42.7%<br />
Notes:<br />
* Small hub airports from Moody's Investor Service, Median <strong>Report</strong>: US Airport Medians for FY 2012 , November 2013.<br />
** 2012 debt service coverage ratio excludes one-time amounts received for the UPS settlement.<br />
** Cannot be lower than 1.25 under bond rate covenant.<br />
85<br />
TERMINAL AREA CONCEPT PLAN TECHNICAL REPORT<br />
Des Moines International Airport
Preliminary Financial Capacity Analysis<br />
Sensitivity Analyses and Financial Conclusion<br />
KEY POINTS<br />
• The sensitivity analyses<br />
shows how much the<br />
non-AIP grant would<br />
need to increase to<br />
afford the new terminal<br />
under more conservative<br />
assumptions for key<br />
variables<br />
• Initial results show that a<br />
significant amount of<br />
grant funding will be<br />
needed to make the<br />
project affordable<br />
• Securing airline input<br />
and alignment is<br />
recommended for a<br />
successful program<br />
Stress Tests<br />
Various stress tests were conducted to determine the<br />
sensitivity of the plan of finance to certain variables.<br />
Scenarios analyzed include higher construction costs, slower<br />
traffic growth, higher bond interest rates, a higher PFC<br />
amount, and lower AIP grant amounts.<br />
Table 27 below shows how much the non-AIP grant would<br />
need to increase (decrease) over the minimum $200 million<br />
level to stay within the range of the financial targets under<br />
changes in assumptions to the key variables. The amounts in<br />
the table are not cumulative.<br />
Table 27<br />
<strong>Plan</strong> of Finance Sensitivity Analysis<br />
Financial conclusions<br />
• A significant amount of grant funding will be needed to<br />
make the new terminal affordable.<br />
• Deferring the implementation will not necessarily enhance<br />
affordability due to construction escalation.<br />
• Securing airline input and alignment is important for a<br />
successful program.<br />
* See previous page for financial targets.<br />
86<br />
TERMINAL AREA CONCEPT PLAN TECHNICAL REPORT<br />
Des Moines International Airport