DSM Terminal-Area-Concept-Plan-Technical-Report - FINAL
DSM Terminal-Area-Concept-Plan-Technical-Report - FINAL
DSM Terminal-Area-Concept-Plan-Technical-Report - FINAL

You also want an ePaper? Increase the reach of your titles
YUMPU automatically turns print PDFs into web optimized ePapers that Google loves.
Aviation Demand Forecast<br />
Aviation Activity Forecast – Comparison with the FAA 2012 TAF<br />
KEY POINTS<br />
• The forecasts are<br />
compared for the<br />
components of total<br />
enplaned passengers,<br />
commercial aircraft<br />
operations, and total<br />
aircraft operations.<br />
• Forecast of enplaned<br />
passengers for <strong>DSM</strong> is<br />
higher than the TAF in<br />
2017 and 2022. The<br />
variance between the<br />
<strong>DSM</strong> enplaned<br />
passenger forecast and<br />
the FAA 2012 TAF is<br />
15.2% in 2017 and<br />
26.8% in 2022.<br />
Table 18<br />
FAA TAF Forecast Comparison<br />
Des Moines International Airport (2012 – 2027)<br />
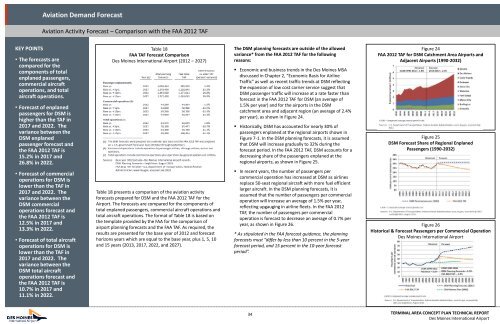
The <strong>DSM</strong> planning forecasts are outside of the allowed<br />
variance* from the FAA 2012 TAF for the following<br />
reasons:<br />
• Economic and business trends in the Des Moines MSA<br />
discussed in Chapter 2, “Economic Basis for Airline<br />
Traffic” as well as recent traffic trends at <strong>DSM</strong> reflecting<br />
the expansion of low cost carrier service suggest that<br />
<strong>DSM</strong> passenger traffic will increase at a rate faster than<br />
forecast in the FAA 2012 TAF for <strong>DSM</strong> (an average of<br />
1.5% per year) and for the airports in the <strong>DSM</strong><br />
catchment area and adjacent region (an average of 2.4%<br />
per year), as shown in Figure 24.<br />
• Historically, <strong>DSM</strong> has accounted for nearly 30% of<br />
passengers enplaned at the regional airports shown in<br />
Figure 7‐1. In the <strong>DSM</strong> planning forecasts, it is assumed<br />
that <strong>DSM</strong> will increase gradually to 32% during the<br />
forecast period. In the FAA 2012 TAF, <strong>DSM</strong> accounts for a<br />
decreasing share of the passengers enplaned at the<br />
regional airports, as shown in Figure 25.<br />
Figure 24<br />
FAA 2012 TAF for <strong>DSM</strong> Catchment <strong>Area</strong> Airports and<br />
Adjacent Airports (1990-2032)<br />
Figure 25<br />
<strong>DSM</strong> Forecast Share of Regional Enplaned<br />
Passengers (1990-2032)<br />
• Forecast of commercial<br />
operations for <strong>DSM</strong> is<br />
lower than the TAF in<br />
2017 and 2022. The<br />
variance between the<br />
<strong>DSM</strong> commercial<br />
operations forecast and<br />
the FAA 2012 TAF is<br />
12.5% in 2017 and<br />
13.3% in 2022.<br />
• Forecast of total aircraft<br />
operations for <strong>DSM</strong> is<br />
lower than the TAF in<br />
2017 and 2022. The<br />
variance between the<br />
<strong>DSM</strong> total aircraft<br />
operations forecast and<br />
the FAA 2012 TAF is<br />
10.7% in 2017 and<br />
11.1% in 2022.<br />
Table 18 presents a comparison of the aviation activity<br />
forecasts prepared for <strong>DSM</strong> and the FAA 2012 TAF for the<br />
Airport. The forecasts are compared for the components of<br />
total enplaned passengers, commercial aircraft operations and<br />
total aircraft operations. The format of Table 18 is based on<br />
the template provided by the FAA for the comparison of<br />
airport planning forecasts and the FAA TAF. As required, the<br />
results are presented for the base year of 2012 and forecast<br />
horizons years which are equal to the base year, plus 1, 5, 10<br />
and 15 years (2013, 2017, 2022, and 2027).<br />
• In recent years, the number of passengers per<br />
commercial operation has increased at <strong>DSM</strong> as airlines<br />
replace 50‐seat regional aircraft with more fuel efficient<br />
larger aircraft. In the <strong>DSM</strong> planning forecasts, it is<br />
assumed that the number of passengers per commercial<br />
operation will increase an average of 1.5% per year,<br />
reflecting upgauging in airline fleets. In the FAA 2012<br />
TAF, the number of passengers per commercial<br />
operation is forecast to decrease an average of 0.7% per<br />
year, as shown in Figure 26.<br />
* As stipulated in the FAA forecast guidance, the planning<br />
forecasts must “differ by less than 10 percent in the 5‐year<br />
forecast period, and 15 percent in the 10‐year forecast<br />
period”.<br />
Figure 26<br />
Historical & Forecast Passengers per Commercial Operation<br />
Des Moines International Airport<br />
34<br />
TERMINAL AREA CONCEPT PLAN TECHNICAL REPORT<br />
Des Moines International Airport