Facts & Figures - The Port of Los Angeles
Facts & Figures - The Port of Los Angeles
Facts & Figures - The Port of Los Angeles
You also want an ePaper? Increase the reach of your titles
YUMPU automatically turns print PDFs into web optimized ePapers that Google loves.
<strong>Facts</strong> &<br />
<strong>Figures</strong><br />
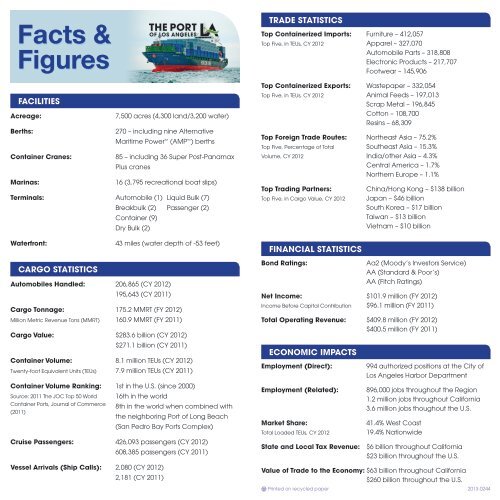
FACILITIES<br />
Acreage:<br />
Berths:<br />
Container Cranes:<br />
Marinas:<br />
7,500 acres (4,300 land/3,200 water)<br />
270 – including nine Alternative<br />
Maritime Power (AMP ) berths<br />
85 – including 36 Super Post-Panamax<br />
Plus cranes<br />
16 (3,795 recreational boat slips)<br />
Terminals: Automobile (1) Liquid Bulk (7)<br />
Breakbulk (2) Passenger (2)<br />
Container (9)<br />
Dry Bulk (2)<br />
TRADE STATISTICS<br />
Top Containerized Imports: Furniture – 412,057<br />
Top Five, in TEUs, CY 2012 Apparel – 327,070<br />
Automobile Parts – 318,808<br />
Electronic Products – 217,707<br />
Footwear – 145,906<br />
Top Containerized Exports: Wastepaper – 332,054<br />
Top Five, in TEUs, CY 2012 Animal Feeds – 197,013<br />
Scrap Metal – 196,845<br />
Cotton – 108,700<br />
Resins – 68,309<br />
Top Foreign Trade Routes: Northeast Asia – 75.2%<br />
Top Five, Percentage <strong>of</strong> Total Southeast Asia – 15.3%<br />
Volume, CY 2012 India/other Asia – 4.3%<br />
Central America – 1.7%<br />
Northern Europe – 1.1%<br />
Top Trading Partners:<br />
Top Five, in Cargo Value, CY 2012<br />
China/Hong Kong – $138 billion<br />
Japan – $46 billion<br />
South Korea – $17 billion<br />
Taiwan – $13 billion<br />
Vietnam – $10 billion<br />
Waterfront:<br />
43 miles (water depth <strong>of</strong> -53 feet)<br />
FINANCIAL STATISTICS<br />
CARGO STATISTICS<br />
Automobiles Handled: 206,865 (CY 2012)<br />
195,643 (CY 2011)<br />
Cargo Tonnage: 175.2 MMRT (FY 2012)<br />
Million Metric Revenue Tons (MMRT) 160.9 MMRT (FY 2011)<br />
Cargo Value: $283.6 billion (CY 2012)<br />
$271.1 billion (CY 2011)<br />
Container Volume: 8.1 million TEUs (CY 2012)<br />
Twenty-foot Equivalent Units (TEUs) 7.9 million TEUs (CY 2011)<br />
Container Volume Ranking: 1st in the U.S. (since 2000)<br />
Source: 2011 <strong>The</strong> JOC Top 50 World 16th in the world<br />
Container <strong>Port</strong>s, Journal <strong>of</strong> Commerce 8th in the world when combined with<br />
(2011)<br />
the neighboring <strong>Port</strong> <strong>of</strong> Long Beach<br />
(San Pedro Bay <strong>Port</strong>s Complex)<br />
Cruise Passengers: 426,093 passengers (CY 2012)<br />
608,385 passengers (CY 2011)<br />
Vessel Arrivals (Ship Calls): 2,080 (CY 2012)<br />
2,181 (CY 2011)<br />
Bond Ratings:<br />
Aa2 (Moody’s Investors Service)<br />
AA (Standard & Poor’s)<br />
AA (Fitch Ratings)<br />
Net Income: $101.9 million (FY 2012)<br />
Income Before Capital Contribution $96.1 million (FY 2011)<br />
Total Operating Revenue: $409.8 million (FY 2012)<br />
$400.5 million (FY 2011)<br />
ECONOMIC IMPACTS<br />
Employment (Direct):<br />
Employment (Related):<br />
Market Share:<br />
Total Loaded TEUs, CY 2012<br />
994 authorized positions at the City <strong>of</strong><br />
<strong>Los</strong> <strong>Angeles</strong> Harbor Department<br />
896,000 jobs throughout the Region<br />
1.2 million jobs throughout California<br />
3.6 million jobs thoughout the U.S.<br />
41.4% West Coast<br />
19.4% Nationwide<br />
State and Local Tax Revenue: $6 billion throughout California<br />
$23 billion throughout the U.S.<br />
Value <strong>of</strong> Trade to the Economy: $63 billion throughout California<br />
$260 billion throughout the U.S.<br />
E Printed on recycled paper 2013-0244


