Key Performance Indicators - The Port of Los Angeles
Key Performance Indicators - The Port of Los Angeles
Key Performance Indicators - The Port of Los Angeles

Create successful ePaper yourself
Turn your PDF publications into a flip-book with our unique Google optimized e-Paper software.
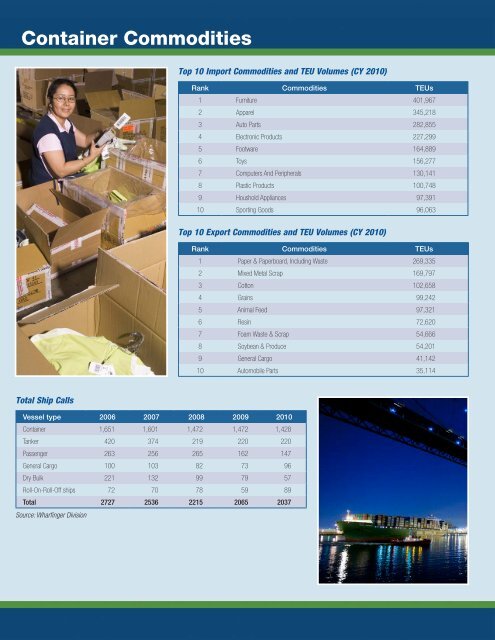
Container Commodities<br />
Top 10 Import Commodities and TEU Volumes (CY 2010)<br />
Rank Commodities TEUs<br />
1 Furniture 401,967<br />
2 Apparel 345,218<br />
3 Auto Parts 282,855<br />
4 Electronic Products 227,299<br />
5 Footware 164,889<br />
6 Toys 156,277<br />
7 Computers And Peripherals 130,141<br />
8 Plastic Products 100,748<br />
9 Houshold Appliances 97,391<br />
10 Sporting Goods 96,063<br />
Top 10 Export Commodities and TEU Volumes (CY 2010)<br />
Rank Commodities TEUs<br />
1 Paper & Paperboard, Including Waste 269,335<br />
2 Mixed Metal Scrap 169,797<br />
3 Cotton 102,658<br />
4 Grains 99,242<br />
5 Animal Feed 97,321<br />
6 Resin 72,620<br />
7 Foam Waste & Scrap 54,666<br />
8 Soybean & Produce 54,201<br />
9 General Cargo 41,142<br />
10 Automobile Parts 35,114<br />
Total Ship Calls<br />
Vessel type 2006 2007 2008 2009 2010<br />
Container 1,651 1,601 1,472 1,472 1,428<br />
Tanker 420 374 219 220 220<br />
Passenger 263 256 265 162 147<br />
General Cargo 100 103 82 73 96<br />
Dry Bulk 221 132 99 79 57<br />
Roll-On-Roll-Off ships 72 70 78 59 89<br />
Total 2727 2536 2215 2065 2037<br />
Source: Wharfinger Division