Key Performance Indicators - The Port of Los Angeles
Key Performance Indicators - The Port of Los Angeles
Key Performance Indicators - The Port of Los Angeles

Create successful ePaper yourself
Turn your PDF publications into a flip-book with our unique Google optimized e-Paper software.
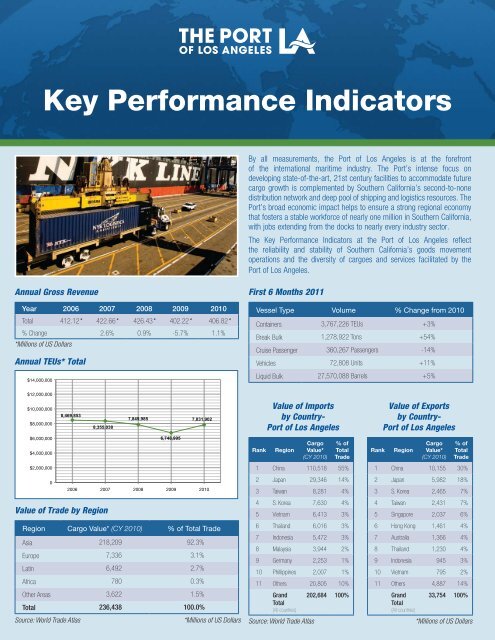
<strong>Key</strong> <strong>Performance</strong> <strong>Indicators</strong><br />
By all measurements, the <strong>Port</strong> <strong>of</strong> <strong>Los</strong> <strong>Angeles</strong> is at the forefront<br />
<strong>of</strong> the international maritime industry. <strong>The</strong> <strong>Port</strong>’s intense focus on<br />
developing state-<strong>of</strong>-the-art, 21st century facilities to accommodate future<br />
cargo growth is complemented by Southern California’s second-to-none<br />
distribution network and deep pool <strong>of</strong> shipping and logistics resources. <strong>The</strong><br />
<strong>Port</strong>’s broad economic impact helps to ensure a strong regional economy<br />
that fosters a stable workforce <strong>of</strong> nearly one million in Southern California,<br />
with jobs extending from the docks to nearly every industry sector.<br />
<strong>The</strong> <strong>Key</strong> <strong>Performance</strong> <strong>Indicators</strong> at the <strong>Port</strong> <strong>of</strong> <strong>Los</strong> <strong>Angeles</strong> reflect<br />
the reliability and stability <strong>of</strong> Southern California’s goods movement<br />
operations and the diversity <strong>of</strong> cargoes and services facilitated by the<br />
<strong>Port</strong> <strong>of</strong> <strong>Los</strong> <strong>Angeles</strong>.<br />
Annual Gross Revenue<br />
Year 2006 2007 2008 2009 2010<br />
Total 412.12* 422.66* 426.43* 402.22* 406.82*<br />
% Change 2.6% 0.9% -5.7% 1.1%<br />
*Millions <strong>of</strong> US Dollars<br />
Annual TEUs* Total<br />
$14,000,000<br />
First 6 Months 2011<br />
Vessel Type Volume % Change from 2010<br />
Containers 3,767,226 TEUs +3%<br />
Break Bulk 1,278,922 Tons +54%<br />
Cruise Passenger 360,267 Passengers -14%<br />
Vehicles 72,808 Units +11%<br />
Liquid Bulk 27,570,088 Barrels +5%<br />
$12,000,000<br />
$10,000,000<br />
8,469,853<br />
7,849,985<br />
7,831,902<br />
$8,000,000<br />
8,355,038<br />
$6,000,000<br />
6,748,995<br />
$4,000,000<br />
$2,000,000<br />
0<br />
2006 2007 2008 2009 2010<br />
Value <strong>of</strong> Trade by Region<br />
Region Cargo Value* (CY 2010) % <strong>of</strong> Total Trade<br />
Asia 218,209 92.3%<br />
Europe 7,336 3.1%<br />
Latin 6,492 2.7%<br />
Africa 780 0.3%<br />
Other Areas 3,622 1.5%<br />
Total 236,438 100.0%<br />
Source: World Trade Atlas<br />
*Millions <strong>of</strong> US Dollars<br />
Rank<br />
Value <strong>of</strong> Imports<br />
by Country-<br />
<strong>Port</strong> <strong>of</strong> <strong>Los</strong> <strong>Angeles</strong><br />
Region<br />
Cargo<br />
Value*<br />
(CY 2010)<br />
% <strong>of</strong><br />
Total<br />
Trade<br />
1 China 110,518 55%<br />
2 Japan 29,346 14%<br />
3 Taiwan 8,281 4%<br />
4 S. Korea 7,630 4%<br />
5 Vietnam 6,413 3%<br />
6 Thailand 6,016 3%<br />
7 Indonesia 5,472 3%<br />
8 Malaysia 3,944 2%<br />
9 Germany 2,253 1%<br />
10 Phillippines 2,007 1%<br />
11 Others 20,805 10%<br />
Grand<br />
Total<br />
(All countries)<br />
202,684 100%<br />
Source: World Trade Atlas<br />
Rank<br />
Value <strong>of</strong> Exports<br />
by Country-<br />
<strong>Port</strong> <strong>of</strong> <strong>Los</strong> <strong>Angeles</strong><br />
Region<br />
Cargo<br />
Value*<br />
(CY 2010)<br />
% <strong>of</strong><br />
Total<br />
Trade<br />
1 China 10,155 30%<br />
2 Japan 5,982 18%<br />
3 S. Korea 2,465 7%<br />
4 Taiwan 2,431 7%<br />
5 Singapore 2,037 6%<br />
6 Hong Kong 1,461 4%<br />
7 Australia 1,366 4%<br />
8 Thailand 1,230 4%<br />
9 Indonesia 945 3%<br />
10 Vietnam 795 2%<br />
11 Others 4,887 14%<br />
Grand<br />
Total<br />
(All countries)<br />
33,754 100%<br />
*Millions <strong>of</strong> US Dollars
Container Commodities<br />
Top 10 Import Commodities and TEU Volumes (CY 2010)<br />
Rank Commodities TEUs<br />
1 Furniture 401,967<br />
2 Apparel 345,218<br />
3 Auto Parts 282,855<br />
4 Electronic Products 227,299<br />
5 Footware 164,889<br />
6 Toys 156,277<br />
7 Computers And Peripherals 130,141<br />
8 Plastic Products 100,748<br />
9 Houshold Appliances 97,391<br />
10 Sporting Goods 96,063<br />
Top 10 Export Commodities and TEU Volumes (CY 2010)<br />
Rank Commodities TEUs<br />
1 Paper & Paperboard, Including Waste 269,335<br />
2 Mixed Metal Scrap 169,797<br />
3 Cotton 102,658<br />
4 Grains 99,242<br />
5 Animal Feed 97,321<br />
6 Resin 72,620<br />
7 Foam Waste & Scrap 54,666<br />
8 Soybean & Produce 54,201<br />
9 General Cargo 41,142<br />
10 Automobile Parts 35,114<br />
Total Ship Calls<br />
Vessel type 2006 2007 2008 2009 2010<br />
Container 1,651 1,601 1,472 1,472 1,428<br />
Tanker 420 374 219 220 220<br />
Passenger 263 256 265 162 147<br />
General Cargo 100 103 82 73 96<br />
Dry Bulk 221 132 99 79 57<br />
Roll-On-Roll-Off ships 72 70 78 59 89<br />
Total 2727 2536 2215 2065 2037<br />
Source: Wharfinger Division
Non-Container Commodities<br />
Finished Vehicles in Units<br />
360,000<br />
300,000<br />
240,000<br />
245,933<br />
180,000<br />
120,000<br />
152,259<br />
151,584<br />
150,233<br />
106,059<br />
60,000<br />
0<br />
2006 2007 2008 2009 2010<br />
Break Bulk Commodities in Metric Tons<br />
Year 2006 2007 2008 2009 2010<br />
Break Bulk 4,230,788 2,852,642 2,463,348 1,115,778 1,616,626<br />
% Change -32.60% -13.60% -54.70% 44.9%<br />
Non-containerized cargo shipped in units <strong>of</strong> one<br />
Bulk Commodities in Metric Tons<br />
Year 2006 2007 2008 2009 2010<br />
Bulk 2,455,655 1,797,601 637,088 1,076,453 720,086<br />
% Change -26.80% -64.60% 69.00% -33.1%<br />
Homogeneous cargo stowed lose in hold <strong>of</strong> ship<br />
Liquid Bulk Commodities in Metric Tons<br />
Year 2006 2007 2008 2009 2010<br />
Liquid Bulk 20,609,115 15,491,259 10,728,271 11,464,599 10,763,387<br />
% Change -24.8% -30.7% 6.9% -6.1%<br />
Source: Wharfinger Division<br />
Annual Passenger Totals<br />
Year 2006 2007 2008 2009 2010<br />
Passengers 1,184,223 1,161,336 1,195,897 798,886 731,952<br />
% Change -1.9% 3.0% -33.2% -8.4%<br />
Source: Wharfinger Division
Economic Impact <strong>of</strong> the San Pedro Bay <strong>Port</strong>s*<br />
Employment (Direct):<br />
• 43,000 positions at the <strong>Port</strong> <strong>of</strong> <strong>Los</strong> <strong>Angeles</strong> (CY 2010)<br />
Employment (Related):<br />
• 1.1 million jobs in California (CY 2010)<br />
• 3.3 million jobs in the U.S. (CY 2010)<br />
Value <strong>of</strong> Trade:<br />
• $ 47.8 billion in California (CY 2009)<br />
• $195.7 billion in the U.S. (CY 2009)<br />
State and Local Tax Revenue:<br />
• $5.1 billion in California (CY 2008)<br />
• $21.5 billion in the U.S. (CY 2008)<br />
West Coast Market Share (incl. Canadian ports):<br />
• 33.7% <strong>Port</strong> <strong>of</strong> <strong>Los</strong> <strong>Angeles</strong> (CY 2010)<br />
• 60.8% <strong>Port</strong> <strong>of</strong> <strong>Los</strong> <strong>Angeles</strong>/Long Beach (CY 2010)<br />
National Market Share (incl. Canadian ports):<br />
• 18.5% <strong>of</strong> all waterborne imports and exports<br />
<strong>Port</strong> <strong>of</strong> <strong>Los</strong> <strong>Angeles</strong> (CY 2010)<br />
* San Pedro Bay <strong>Port</strong>s are the <strong>Port</strong> <strong>of</strong> <strong>Los</strong> <strong>Angeles</strong> and the <strong>Port</strong> <strong>of</strong> Long Beach<br />
Source: Planning & Economic Development<br />
• Spending $1 million a day in capital improvement programs.<br />
• Current projects: Channel deepening, terminal expansion at<br />
Trapac, China Shipping and APL, Transportation projects for<br />
efficient access to port terminals and security projects.<br />
• 10,000+ drayage trucks that are model year 2007 or newer<br />
for superior reliability and air quality.<br />
• Workforce <strong>of</strong> 18,000 regular and casual longshore personnel.<br />
• Access to multiple service providers in all parts <strong>of</strong> the<br />
logistics chain.<br />
• Easy access to special handling equipment companies.<br />
• 1,684 acres/674 hectares <strong>of</strong> container terminal backland.<br />
• 113 miles/182 kilometers <strong>of</strong> rail on <strong>Port</strong> property.<br />
• Handling more than 40 trains daily.<br />
• 1 Billion sq. ft./93 million <strong>of</strong> square meter warehousing and<br />
DC facilities within Southern California.<br />
• 53’ deep draft waterways to accommodate the world’s largest<br />
container ships.<br />
• 50+ berths and 75 gantry cranes.<br />
425 South Palos Verdes Street, P.O. Box 151 • San Pedro, California 90733-0151<br />
Tel/TDD: 310-SEA-PORT • www.port<strong>of</strong>losangeles.org<br />
As a covered entity under Title II <strong>of</strong> the Americans with Disabilities Act, the City <strong>of</strong> <strong>Los</strong> <strong>Angeles</strong> does not discriminate on the basis <strong>of</strong> disability and, upon<br />
request, will provide reasonable accommodation to ensure equal access to its programs, services, and activities.<br />
Printed on recycled paper 2011-0923 Revised Aug 2011