TURBIDITY SENSOR FOR UNDERWATER APPLICATIONS Sensor ...
TURBIDITY SENSOR FOR UNDERWATER APPLICATIONS Sensor ...
TURBIDITY SENSOR FOR UNDERWATER APPLICATIONS Sensor ...

Create successful ePaper yourself
Turn your PDF publications into a flip-book with our unique Google optimized e-Paper software.
<strong>TURBIDITY</strong> <strong>SENSOR</strong> <strong>FOR</strong> <strong>UNDERWATER</strong> <strong>APPLICATIONS</strong><br />
<strong>Sensor</strong> Design and System Performance with Calibration Results<br />
Saba Mylvaganam 1 , Torgeir Jakobsen 2<br />
1 Høgskolen i Bergen (Bergen College), P. O. Box 6030, N-5020 Bergen<br />
2 Torgeir Jakobsen, Aanderaa Instruments, Fanavegen 13 B, N-5051 Bergen<br />
NORWAY<br />
Abstract - When using optical methods turbidity is one<br />
of the main hindrances to achieving good imaging and<br />
ranging qualities in underwater applications of<br />
remote sensing, ROVs and instruments. This paper<br />
gives the principles of operation and design of an<br />
optical turbidity meter. The operation of the meter is<br />
based on illuminating the medium with light of<br />
selected wavelengths and then measuring the<br />
backscattered light. Many series of measurements<br />
were made with the sensor under discussion based on<br />
standard calibration mediums of formazin. The<br />
experimental results in calibration mediums and from<br />
actual underwater applications are presented in this<br />
paper. Finally, the performance of the sensor system<br />
in practical applications is described. The main<br />
aspects of the sensor electronics is also presented.<br />
I. INTRODUCTION<br />
Turbidity is an indicator often used to find the amount of<br />
suspended sediment in water. By cumbersome<br />
mechanical sampling, it is possible to measure the<br />
concentration of suspended solids (in mg/ l) in water, but<br />
turbidity is increasingly used instead, as it is easy to use<br />
and cheaper too. It is an ecologically important<br />
parameter as the various effects of suspended solids in<br />
aquatic ecosystems are due to their light scattering<br />
properties rather than their absolute mass.<br />
High turbidity has a number of detrimental effects on<br />
aquatic ecosystems: decrease in light penetration<br />
(limiting plant growth), fish movements and the ability<br />
of predatory fish and birds to see their prey. High<br />
turbidity means high concentration of suspended solids,<br />
which can harm fish and other aquatic fauna. These<br />
suspended solids in the process of settling down to the<br />
ocean bottom have a choking effect on bottom dwelling<br />
organisms and aquatic habitats.<br />
Turbidity, a measure of the degree of scattering light, is<br />
primarily determined by the amount of suspended<br />
particulate matter in water, [1]. The particulate matter<br />
consists of soil, sand or mud, may include also algae,<br />
faecal matter and other organic particles. In rivers,<br />
turbidity increases during rainfall or due to flow changes<br />
or disturbances leading to high variations in turbidity<br />
levels.<br />
According to Water Quality Association of Illinois in the<br />
USA [2], turbidity is defined as «the amount of small<br />
particles of solid matter suspended in water as measured<br />
by the amount of scattering and absorption of light rays<br />
caused by the particles», which is in harmony with the<br />
definition given in ISO 7027, [1]. Turbidity is mostly<br />
measured in NTU (Nephelometric Turbidity Unit: Unit<br />
used in water treatment for measurement at 90°<br />
backscattering), [3]. Potable water, for example, should<br />
not have turbidity exceeding 0.5 NTU.<br />
There is growing need for a turbidimeter for use in the<br />
detection of algae or other ocean borne particles in the<br />
context of environmental monitoring and especially in<br />
fish farms, as described in [2], [4], and [5]. Turbidimeter<br />
is useful to the port authorities in general and can be<br />
integrated into existing oceanographic metering buoys.<br />
Turbidimeter can be also used to monitor sediment and<br />
particle pollution.<br />
As the turbidimeter in discussion, called hereafter<br />
turbidity sensor 3612, in the context of this paper, is<br />
planned to be integrated in oceanographic metering<br />
buoys and other oceanographic instruments, it is<br />
essential that the sensor is compact and uses as little<br />
energy as possible, due to the fact that the metering<br />
buoys are deployed for many months or even for a whole<br />
year.<br />
II. PRINCIPLE<br />
Turbidity as measured using photometric techniques is<br />
defined as «reduction of transparency of a liquid caused<br />
by the presence of undissolved matter». Reduction of<br />
transparency can be measured to a certain extent using<br />
scattering and/or transmission of light. Consider an<br />
incident light beam with intensity I inc and wavelength λ<br />
striking a spheroidal particle of diameter d. The intensity<br />
I sc of the scattered light is a function of the scatter angle<br />
θ, the particle size d, the wavelength , and the optical<br />
properties of the particle and the medium such as the<br />
refractive index n. This functional relationship can then<br />
be written as, I sc = I sc ( θ,λ, d, n ). In the case of<br />
spheroidal particles, the general solution for any values<br />
of the variables is given by the Mie theory, [6] and [7].<br />
Mie theory encompasses the Rayleigh Theory, which<br />
addresses the special case of very tiny particles (with λ <<br />
1
0.05µm). Figure 1 is reproduced from ISO 7027, [1],<br />
showing only the scattered radiation (called as diffused<br />
radiation in ISO 7027) at an angle θ , as compared to the<br />
direction of incident radiation at angle 0°. The solid<br />
angles Ω θ and Ω 0 relates to the aperture angles at the<br />
receivers at angles θ and 0°. ISO 7027 states that the<br />
common spectral attenuation coefficient µ(λ) is the sum<br />
of spectral diffusion coefficient s(λ) and the spectral<br />
absorption coefficient a(λ) with<br />
µ(λ) = s(λ) + a(λ)<br />
and limits the spectral bandwidth ∆λ to about 60 nm, θ<br />
to 90° ± 2.5° and Ω θ to 20°, which should be taken into<br />
account in design considerations. Now, the intensities of<br />
light at at angles θ and 0° can be written as<br />
I sc = I inc exp (-s(λ) z) & I 0 = I inc exp - ( µ(λ) z)<br />
Simple scatter is limited to about 10 NTU. In practice,<br />
however, electronic linearization makes it possible to use<br />
scatter intensity measurement for much higher<br />
measuring ranges (up to about 2000 NTU). The lowest<br />
measurable turbidity level depends on how much stray<br />
light is present. The amount of stray light present in the<br />
photometer system determines the lowest measurable<br />
turbidity level.<br />
III. <strong>SENSOR</strong> DESIGN<br />
Infra-red light is used to illuminate the medium. The<br />
principle used in the sensor under discussion is in<br />
detecting the intensity of infra-red light (wavelength λ of<br />
860 nm) emitted by two LEDs to a common centre and<br />
received by a symmetrically placed photodiode of<br />
suitable wavelength. The principle of the sensor design<br />
can be seen in Figure 2. The IR-pulses are sent out at a<br />
frequency of 2kHz. The suspended particles scatter these<br />
pulses and the backscatterd IR-pulses are detected by the<br />
photodiode. The signal processing, involving 2kHz pulse<br />
generation using a microcontroller and the necessary<br />
filtering and rectification, is schematically shown in<br />
Figure 3.<br />
The sensor head with two LEDs and a single photodiode<br />
is shown in Figure 4. The directional characteristics of<br />
the transmitters and receivers are shown in Figure 5. As<br />
can be seen from Figure 5, the cross-hatched volume in<br />
front of the sensor head accounts for the backscattering<br />
volume of the optical measurement system.<br />
IV. TESTS<br />
The turbidimeter in discussion has been used in studying<br />
the dynamics in the water and the resulting transport of<br />
sediments especially very close to the bottom of the ocean<br />
in conjunction with dredging, ports and groin actions by<br />
various organizations in addition to buoy mounted<br />
oceanographic applications. The Turbidity sensor was<br />
compared with a reference sensor leading to the results<br />
shown in Table 1.<br />
V. EXPERIENCE WITH DIFFERENT <strong>TURBIDITY</strong><br />
UNITS OF MEASUREMENTS<br />
The output of the analog to digital converter v adc is fed<br />
into the microcomputer to calculate the turbidity in NTU<br />
using an empirical relation using sensor-specific<br />
constants a, b and c:<br />
f ( v ) = a + b v + c v + d v<br />
2<br />
adc adc adc adc<br />
3 .<br />
Table 1. Turbidity sensor discussed in this paper<br />
compared with a laboratory turbidimeter<br />
Reference Meter Turbidity <strong>Sensor</strong> 3612<br />
NTU<br />
NTU<br />
0 -0.01<br />
4.06 4.10<br />
8.21 8.17<br />
12.10 12.09<br />
16.10 16.16<br />
18.7 18.68<br />
The analog digital converter has 12 bits resolution and<br />
the sensor output 10 bits resolution in a typical system<br />
used. For a sensor with a = -0.9573, b = 0.2304, c= 7.048<br />
. 10 -6 , d = -4.360. 10 -6 , the turbidity in NTU is given in<br />
Figure 6. Due to the small values of the constants c and d<br />
compared to those of a and b , the plot in Figure 6 looks<br />
linear for the whole range. However, for accuracies<br />
strived for in the design of turbidity sensor 3612, it is<br />
necessary to have all the constants in the equation above.<br />
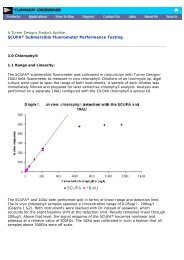
Figure 7 shows the performance of the turbidity sensor<br />
3612 as compared to that of a laboratory reference<br />
sensor.<br />
In the course of our applications, we found out that the<br />
units used in turbidity measurements need conversions.<br />
Figure 8 shows the conversion from NTU to FNU.<br />
VI. CONCLUSIONS<br />
The correlation between the turbidity sensor and the<br />
reference sensor is very good. The deviation is within<br />
±0.3%. Due to the low energy consumption design, on<br />
the average, energy consumed by turbidity sensor 3612 in<br />
a 10 min interval is
VII. REFERENCE<br />
[1] ISO 7027, Water Quality, International Standard,<br />
1990.<br />
[2] WQA Glossary of Terms, by the Water Quality<br />
Association, Illinois 60532 USA, 3rd Edition, 1997.<br />
[3] V. S. Hart, C. E. Johnson, and R. D. Letterman, An<br />
Analysis of Low-Level Turbidity Measurements,<br />
Management and Operations, Journal of AWWA,<br />
December 1992, pp. 40-45.<br />
[4] Australian Water Quality Guidelines for Fresh and<br />
Marine Waters, Australian and New Zealand<br />
Environment and Conservation Council, Canberra, 1992.<br />
[5] State of the Environment Australia 1996, State of the<br />
Environment Advisory Council, Department of the<br />
Environment, Sports and Territories, CSIRO Publishing,<br />
Melbourne, 1996.<br />
[6] N. G. Jerlov and E. S. Nielsen, Optical Aspects of<br />
Oceanography, Academic Press, London and New York,<br />
1974.<br />
[7] H.C. van de Hulst, Light Scattering by small<br />
particles, Dover Publications Inc., New York, 1981<br />
[8] M. Underheim and G. A. Johnsen, Turbidimeter<br />
3200, Final year project work at Høgskolen i Bergen in<br />
Collaboration with Aanderaa Instruments A/S, Bergen,<br />
May 1995.<br />
Figure 2. Principle of backscattering used in the<br />
turbidimeter using two LEDs (marked Tx) at 860nm and<br />
single photodiode (marked Rx). From design workshop<br />
of Aanderaa Instruments A/S.<br />
Figure 1. Scattering and transmission parameters as defined in<br />
ISO 7027, [1]. The circle on the left represents the light source.<br />
The solid angles Ω θ and Ω 0 relates to the aperture<br />
angles at the receivers at angles θ and 0°.<br />
Figure 3. <strong>Sensor</strong>s and their signal processing in the turbidimeter under discussion. SR10 is a special signal standard used<br />
by Aanderaa Instruments A/S. Microcontroller and IR-LED are connected to the lock-in amplifier (shown with the sign of<br />
multiplication X) which amplifies the photodiode signal. From design workshop of Aanderaa Instruments A/S.<br />
3
Turbidity in NTU Units<br />
200<br />
180<br />
160<br />
140<br />
120<br />
100<br />
80<br />
60<br />
40<br />
20<br />
0<br />
0 100 200 300 400 500 600 700 800<br />
ADC Output<br />
Figure 6. Turbidity in NTU units from the output<br />
value of the analog to digital converter.<br />
20<br />
Turbidity <strong>Sensor</strong> 3612 compared with a laboratory reference turbidimeter<br />
18<br />
Figure 4. <strong>Sensor</strong> head with integrated LEDs and<br />
photodiode. From design workshop of Aanderaa<br />
Instruments A/S. LED has its peak response<br />
around λ = 875 nm. The photodiode has its peak<br />
around λ = 900nm.<br />
NTU from lab reference turbidimeter<br />
16<br />
14<br />
12<br />
10<br />
8<br />
6<br />
4<br />
2<br />
0<br />
0 2 4 6 8 10 12 14 16 18 20<br />
NTU from Turbidity <strong>Sensor</strong> 3612<br />
Figure 7. Turbidity <strong>Sensor</strong> 3612 discussed in this<br />
paper compared with a laboratory reference sensor.<br />
The deviation is within ±0.3%. The circles show<br />
the measurement points and the straight line goes<br />
through the interpolated values between the<br />
measurement points.<br />
1400<br />
Turbidity units: Conversion from FNU to NTU<br />
Turbidity Units in NTU<br />
1200<br />
1000<br />
800<br />
600<br />
400<br />
200<br />
Figure 5. Backscattering volume in front of the<br />
sensor head. The hatched area corresponds to the<br />
backscattering volume used by the Turbidity<br />
<strong>Sensor</strong> 3612. Trace of half angle beams of<br />
Turbidity <strong>Sensor</strong> 3612 are used to define the<br />
scattering volume with respect to the photodiode.<br />
From the design workshop of Aanderaa<br />
Instruments A/S.<br />
0<br />
-200<br />
0 200 400 600 800 1000<br />
Turbidity Units in FNU<br />
Figure 8. Conversion from FNU to NTU and vice<br />
versa. Some of the assumptions re conversion of<br />
different turbidity units are not always valid and<br />
care should be exercised when using these. It is<br />
important to note that these results may be specific<br />
to prevailing laboratory conditions and the<br />
methods adopted in the lab.<br />
4