comparison of practical fault ride-through capability for mv - PSCC
comparison of practical fault ride-through capability for mv - PSCC
comparison of practical fault ride-through capability for mv - PSCC

Create successful ePaper yourself
Turn your PDF publications into a flip-book with our unique Google optimized e-Paper software.
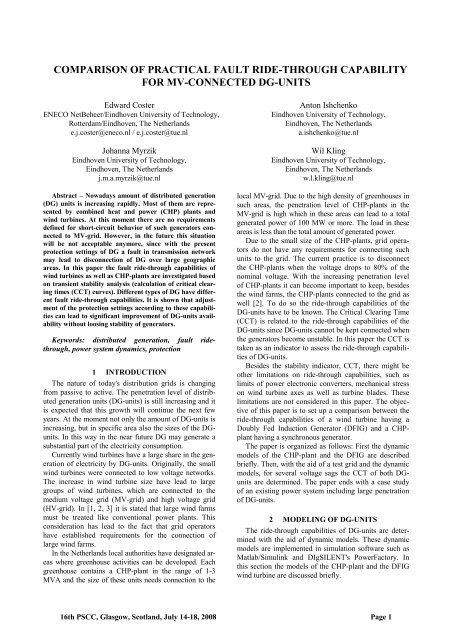
COMPARISON OF PRACTICAL FAULT RIDE-THROUGH CAPABILITY<br />
FOR MV-CONNECTED DG-UNITS<br />
Edward Coster<br />
ENECO NetBeheer/Eindhoven University <strong>of</strong> Technology,<br />
Rotterdam/Eindhoven, The Netherlands<br />
e.j.coster@eneco.nl / e.j.coster@tue.nl<br />
Johanna Myrzik<br />
Eindhoven University <strong>of</strong> Technology,<br />
Eindhoven, The Netherlands<br />
j.m.a.myrzik@tue.nl<br />
Abstract – Nowadays amount <strong>of</strong> distributed generation<br />
(DG) units is increasing rapidly. Most <strong>of</strong> them are represented<br />
by combined heat and power (CHP) plants and<br />
wind turbines. At this moment there are no requirements<br />
defined <strong>for</strong> short-circuit behavior <strong>of</strong> such generators connected<br />
to MV-grid. However, in the future this situation<br />
will be not acceptable anymore, since with the present<br />
protection settings <strong>of</strong> DG a <strong>fault</strong> in transmission network<br />
may lead to disconnection <strong>of</strong> DG over large geographic<br />
areas. In this paper the <strong>fault</strong> <strong>ride</strong>-<strong>through</strong> capabilities <strong>of</strong><br />
wind turbines as well as CHP-plants are investigated based<br />
on transient stability analysis (calculation <strong>of</strong> critical clearing<br />
times (CCT) curves). Different types <strong>of</strong> DG have different<br />
<strong>fault</strong> <strong>ride</strong>-<strong>through</strong> capabilities. It is shown that adjustment<br />
<strong>of</strong> the protection settings according to these capabilities<br />
can lead to significant improvement <strong>of</strong> DG-units availability<br />
without loosing stability <strong>of</strong> generators.<br />
Keywords: distributed generation, <strong>fault</strong> <strong>ride</strong><strong>through</strong>,<br />
power system dynamics, protection<br />
1 INTRODUCTION<br />
The nature <strong>of</strong> today's distribution grids is changing<br />
from passive to active. The penetration level <strong>of</strong> distributed<br />
generation units (DG-units) is still increasing and it<br />
is expected that this growth will continue the next few<br />
years. At the moment not only the amount <strong>of</strong> DG-units is<br />
increasing, but in specific area also the sizes <strong>of</strong> the DGunits.<br />
In this way in the near future DG may generate a<br />
substantial part <strong>of</strong> the electricity consumption.<br />
Currently wind turbines have a large share in the generation<br />
<strong>of</strong> electricity by DG-units. Originally, the small<br />
wind turbines were connected to low voltage networks.<br />
The increase in wind turbine size have lead to large<br />
groups <strong>of</strong> wind turbines, which are connected to the<br />
medium voltage grid (MV-grid) and high voltage grid<br />
(HV-grid). In [1, 2, 3] it is stated that large wind farms<br />
must be treated like conventional power plants. This<br />
consideration has lead to the fact that grid operators<br />
have established requirements <strong>for</strong> the connection <strong>of</strong><br />
large wind farms.<br />
In the Netherlands local authorities have designated areas<br />
where greenhouse activities can be developed. Each<br />
greenhouse contains a CHP-plant in the range <strong>of</strong> 1-3<br />
MVA and the size <strong>of</strong> these units needs connection to the<br />
Anton Ishchenko<br />
Eindhoven University <strong>of</strong> Technology,<br />
Eindhoven, The Netherlands<br />
a.ishchenko@tue.nl<br />
Wil Kling<br />
Eindhoven University <strong>of</strong> Technology,<br />
Eindhoven, The Netherlands<br />
w.l.kling@tue.nl<br />
local MV-grid. Due to the high density <strong>of</strong> greenhouses in<br />
such areas, the penetration level <strong>of</strong> CHP-plants in the<br />
MV-grid is high which in these areas can lead to a total<br />
generated power <strong>of</strong> 100 MW or more. The load in these<br />
areas is less than the total amount <strong>of</strong> generated power.<br />
Due to the small size <strong>of</strong> the CHP-plants, grid operators<br />
do not have any requirements <strong>for</strong> connecting such<br />
units to the grid. The current practice is to disconnect<br />
the CHP-plants when the voltage drops to 80% <strong>of</strong> the<br />
nominal voltage. With the increasing penetration level<br />
<strong>of</strong> CHP-plants it can become important to keep, besides<br />
the wind farms, the CHP-plants connected to the grid as<br />
well [2]. To do so the <strong>ride</strong>-<strong>through</strong> capabilities <strong>of</strong> the<br />
DG-units have to be known. The Critical Clearing Time<br />
(CCT) is related to the <strong>ride</strong>-<strong>through</strong> capabilities <strong>of</strong> the<br />
DG-units since DG-units cannot be kept connected when<br />
the generators become unstable. In this paper the CCT is<br />
taken as an indicator to assess the <strong>ride</strong>-<strong>through</strong> capabilities<br />
<strong>of</strong> DG-units.<br />
Besides the stability indicator, CCT, there might be<br />
other limitations on <strong>ride</strong>-<strong>through</strong> capabilities, such as<br />
limits <strong>of</strong> power electronic converters, mechanical stress<br />
on wind turbine axes as well as turbine blades. These<br />
limitations are not considered in this paper. The objective<br />
<strong>of</strong> this paper is to set up a <strong>comparison</strong> between the<br />
<strong>ride</strong>-<strong>through</strong> capabilities <strong>of</strong> a wind turbine having a<br />
Doubly Fed Induction Generator (DFIG) and a CHPplant<br />
having a synchronous generator.<br />
The paper is organized as follows: First the dynamic<br />
models <strong>of</strong> the CHP-plant and the DFIG are described<br />
briefly. Then, with the aid <strong>of</strong> a test grid and the dynamic<br />
models, <strong>for</strong> several voltage sags the CCT <strong>of</strong> both DGunits<br />
are determined. The paper ends with a case study<br />
<strong>of</strong> an existing power system including large penetration<br />
<strong>of</strong> DG-units.<br />
2 MODELING OF DG-UNITS<br />
The <strong>ride</strong>-<strong>through</strong> capabilities <strong>of</strong> DG-units are determined<br />
with the aid <strong>of</strong> dynamic models. These dynamic<br />
models are implemented in simulation s<strong>of</strong>tware such as<br />
Matlab/Simulink and DIgSILENT's PowerFactory. In<br />
this section the models <strong>of</strong> the CHP-plant and the DFIG<br />
wind turbine are discussed briefly.<br />
16th <strong>PSCC</strong>, Glasgow, Scotland, July 14-18, 2008 Page 1
2.1 Dynamic Model <strong>of</strong> a CHP-plant<br />
Modern CHP-plants have a turbo charged gas engine<br />
as a prime mover. When studying the <strong>ride</strong>-<strong>through</strong> capabilities<br />
<strong>of</strong> such CHP-plants it is necessary to study the<br />
dynamics <strong>of</strong> the gas engine. Gas engine modeling is<br />
very complex due to the difficulties in describing the<br />
internal processes <strong>of</strong> the engine by equations. Most<br />
models which are available in the literature are too specific<br />
and not developed <strong>for</strong> power system dynamical<br />
studies. In [4] a model is developed, which is suitable to<br />
represent the gas engine dynamics. In Figure 1 a block<br />
scheme <strong>of</strong> the gas engine model is given. This block<br />
scheme is implemented in Matlab/Simulink and dynamic<br />
simulations are per<strong>for</strong>med. In [4] a detailed description<br />
<strong>of</strong> the applied model as well as the used figures can be<br />
found.<br />
Throttle<br />
α<br />
1-α<br />
Engine<br />
Turbo<br />
Charger<br />
Figure 1: Block scheme <strong>of</strong> a turbo charged gas engine<br />
Torque<br />
The dynamics <strong>of</strong> the gas engine is demonstrated with<br />
a simulation <strong>of</strong> a torque step. At t = 0 s the engine is<br />
started up and at t = 5 s a torque step from 0.8 p.u. to 0.3<br />
p.u. is applied. The result is depicted in Figure 2 and<br />
shows that the dynamics <strong>of</strong> the gas engine are mainly<br />
determined by the dynamics <strong>of</strong> the throttle.<br />
2.2 Dynamic Model <strong>of</strong> a DFIG<br />
The scheme <strong>of</strong> a DFIG used <strong>for</strong> the simulations is<br />
shown in Figure 3. This concept includes a wound rotor<br />
asynchronous generator with the stator directly connected<br />
to the grid, while the rotor is coupled with the<br />
network using an AC to AC power converter with a DClink.<br />
Wind<br />
Turbine DFIG<br />
1.5 MW 2 MVA<br />
575 V / 10 kV<br />
Pitch<br />
Control<br />
RSC<br />
~<br />
RSC<br />
Control<br />
GSC<br />
~<br />
GSC<br />
Control<br />
150 kvar<br />
Figure 3: Model <strong>of</strong> the DFIG <strong>for</strong> stability assessment<br />
The simulations <strong>of</strong> the DFIG dynamic behavior were<br />
per<strong>for</strong>med with the Matlab/SimPowerSystems toolbox<br />
using the DFIG model available there [5]. The model<br />
includes the following main features:<br />
• The wind turbine is modeled using steady-state<br />
aerodynamic relationship between wind speed<br />
and the mechanical power <strong>of</strong> the turbine.<br />
• The power electronic converters are represented<br />
by equivalent voltage sources generating the AC<br />
voltage averaged over one cycle <strong>of</strong> the switching<br />
frequency.<br />
• Pitch control, rotor-side converter (RSC) and<br />
grid-side converter (GSC) controls are modeled<br />
in full detail. During the simulation the RSC control<br />
operates in power factor regulation mode<br />
keeping the generator reactive power exchange<br />
equal to zero.<br />
Figure 2: Dynamic response <strong>of</strong> a gas engine<br />
In <strong>comparison</strong> with typical <strong>fault</strong> clearing times <strong>of</strong> the<br />
protection systems and critical clearing time <strong>of</strong> generators,<br />
the dynamics <strong>of</strong> the gas engine are slow. Due to<br />
these slow dynamics the gas engine is represented by its<br />
inertia only. This inertia is incorporated with the generator<br />
inertia.<br />
The generator model <strong>of</strong> the CHP-plant, used in the<br />
dynamic simulations, is a regular model <strong>of</strong> the synchronous<br />
machine which is available in PowerFactory.<br />
• The wound rotor asynchronous generator is represented<br />
by 5th order model in the dq-reference<br />
frame.<br />
• The model does not include crowbar protection.<br />
3 TRANSIENT STABILITY OF DG-UNITS<br />
The aim <strong>of</strong> <strong>ride</strong>-<strong>through</strong> criteria is to keep DG-units<br />
connected to the grid during the disturbance and recover<br />
the power balance after <strong>fault</strong> clearing. Keeping DG-units<br />
connected to the grid means that the units have to withstand<br />
certain voltage dips. The effect <strong>of</strong> voltage dips on<br />
stability <strong>of</strong> CHP-plants and wind turbines is studied by<br />
16th <strong>PSCC</strong>, Glasgow, Scotland, July 14-18, 2008 Page 2
means <strong>of</strong> a study grid having a variable voltage source.<br />
The voltage source is able to produce a voltage dip <strong>of</strong> a<br />
certain depth and duration. The defined dynamic models<br />
are implemented in the test grid and the stability <strong>of</strong> the<br />
DG-units as a function <strong>of</strong> the depth and duration <strong>of</strong> the<br />
voltage dip is determined.<br />
In Figure 4 the study grid is shown. It consist <strong>of</strong> two<br />
10 kV busbars, a swing-bus which represents the external<br />
grid, a 3 km XLPE 630 mm 2 Al cable connection<br />
and a generator. Parallel at the swing-bus the variable<br />
voltage source is connected.<br />
Variable<br />
Voltage<br />
Source<br />
Swing<br />
Bus<br />
V<br />
Bus 1<br />
Bus 2<br />
Figure 4: Study grid including a variable voltage source<br />
G<br />
3.1 Dynamic Behavior <strong>of</strong> CHP-plants<br />
With the aid <strong>of</strong> the defined test grid the dynamic behavior<br />
<strong>of</strong> the CHP-plant is studied. In the simulations<br />
the rotor angle is used as a stability index. To find the<br />
stability limit at a certain depth <strong>of</strong> the voltage dip the<br />
duration <strong>of</strong> the voltage dip is adjusted. In this way the<br />
CCT as a function <strong>of</strong> the voltage dip can be found. In<br />
Table 1 the figures <strong>for</strong> which the simulations are carried<br />
out are displayed. The results <strong>of</strong> the simulation are depicted<br />
in Figure 5.<br />
S nom [MVA] P [MW] p.f. H [s]<br />
3 2.4 1.0 2<br />
3 2.4 0.8 2<br />
3 2.4 1.0 4<br />
3 2.4 0.8 4<br />
Table 1: Simulation figures <strong>of</strong> the CHP-plant<br />
u [p.u.]<br />
0.5<br />
0.45<br />
0.4<br />
0.35<br />
0.3<br />
0.25<br />
0.2<br />
0.15<br />
0.1<br />
H = 2 s, p.f. = 1<br />
H = 2 s, p.f. = 0.8<br />
0.05<br />
H = 4 s, p.f. = 1<br />
H = 4 s, p.f. = 0.8<br />
0<br />
0 0.2 0.4 0.6 0.8 1 1.2 1.4 1.6 1.8 2<br />
t [s]<br />
Figure 5: CCT <strong>of</strong> a CHP-plant as a function <strong>of</strong> the voltage<br />
dip (remains voltage)<br />
3.2 Dynamic Behavior <strong>of</strong> a DFIG<br />
Transient stability <strong>of</strong> a DFIG can be evaluated by<br />
monitoring the DC-link voltage. Its behavior <strong>for</strong> threephase<br />
<strong>fault</strong> durations <strong>of</strong> 100 and 300 ms at wind speed<br />
<strong>of</strong> 10 m/s (voltage dip to 0.6 p.u. <strong>of</strong> the nominal voltage)<br />
is illustrated on Figure 6.<br />
2800<br />
2600<br />
2400<br />
2200<br />
2000<br />
1800<br />
1600<br />
1400<br />
1200<br />
Fault duration = 300 ms<br />
Fault duration = 100 ms<br />
DC-link voltage Vdc [V]<br />
1000<br />
0 0.1 0.2 0.3 0.4 0.5 0.6<br />
t [s]<br />
Figure 6: DC-link voltage <strong>of</strong> a DFIG <strong>for</strong> different <strong>fault</strong> durations<br />
In an unstable situation the DC-link voltage starts to<br />
increase significantly immediately after the <strong>fault</strong>. The<br />
other variables (active and reactive powers, mechanical<br />
speed <strong>of</strong> the machine, etc.) exhibit not so clear unstable<br />
behavior, although as it can be seen from Figure 7, active<br />
and reactive powers start to oscillate, and the mechanical<br />
speed begins to grow slowly.<br />
2<br />
0<br />
Active power [p.u.]<br />
-2<br />
0 0.1 0.2 0.3 0.4 0.5 0.6<br />
1<br />
0<br />
Reactive power [p.u.]<br />
-1<br />
0 0.1 0.2 0.3 0.4 0.5 0.6<br />
1.11<br />
1.1<br />
1.09<br />
Fault duration=300 ms<br />
Fault duration=100 ms<br />
Mechanical speed [p.u.]<br />
0 0.1 0.2 0.3 0.4 0.5 0.6<br />
t [s]<br />
Figure 7: Mechanical speed, active and reactive powers <strong>of</strong> a<br />
DFIG <strong>for</strong> different <strong>fault</strong> durations<br />
To determine the CCT <strong>of</strong> the DFIG the same approach<br />
as described in section 3.1 is used. The simulations<br />
are carried out <strong>for</strong> various wind speeds which lead<br />
to the results depicted in Figure 8.<br />
16th <strong>PSCC</strong>, Glasgow, Scotland, July 14-18, 2008 Page 3
u [p.u.]<br />
0.5<br />
0.45<br />
0.4<br />
0.35<br />
0.3<br />
0.25<br />
0.2<br />
0.15<br />
0.1<br />
Wind speed = 9 m/s<br />
Wind speed = 10 m/s<br />
0.05<br />
Wind speed = 11 m/s<br />
Wind speed = 12 m/s<br />
0<br />
0 0.05 0.1 0.15 0.2 0.25 0.3 0.35 0.4 0.45 0.5<br />
t [s]<br />
Figure 8: CCT <strong>of</strong> a DFIG as a function <strong>of</strong> the voltage dips<br />
Addition <strong>of</strong> the crowbar allows to prevent the growth<br />
<strong>of</strong> the DC-link voltage during a short-circuit and significantly<br />
increase the CCT, which becomes related to the<br />
large extent only with the mechanical part <strong>of</strong> wind turbine<br />
having a very large inertia. Switching between<br />
different control strategies in case <strong>of</strong> normal operation<br />
and <strong>fault</strong> conditions improves the shape <strong>of</strong> the DFIG<br />
transient response and prevents transient stability problems<br />
as illustrated in [6].<br />
4 CASE STUDY<br />
The frequency <strong>of</strong> disconnections, initiated by the undervoltage<br />
protection can be estimated by means <strong>of</strong> a<br />
voltage dip pr<strong>of</strong>ile. The dip pr<strong>of</strong>ile describes, <strong>for</strong> a certain<br />
location in the grid, the magnitude, duration and<br />
frequency <strong>of</strong> the dips. In a case study, the developed<br />
CCT-curves in combination with the voltage dip pr<strong>of</strong>ile<br />
are used to study the stability <strong>of</strong> the DG-units when<br />
disconnection by the undervoltage protection is prevented.<br />
The dip magnitude is determined by the network<br />
impedances and the type <strong>of</strong> <strong>fault</strong> [7]. When considering<br />
voltage dips caused by <strong>fault</strong>s, the <strong>fault</strong> clearing time <strong>of</strong><br />
the protection specifies the dip duration. The <strong>fault</strong> frequency<br />
determines the number <strong>of</strong> voltage dips.<br />
For the power system <strong>of</strong> the province Zuid Holland,<br />
the Netherlands, the voltage dip pr<strong>of</strong>ile at the point <strong>of</strong><br />
connection <strong>of</strong> the DG-units is assessed.<br />
4.1 Examined Grid<br />
The province <strong>of</strong> Zuid Holland has a 150 kV transmission<br />
grid, which is connected to the 380 kV grid at 3<br />
locations. The layout is given in Figure 9. From the 150<br />
kV nodes (HV/MV substations) the MV-networks are<br />
fed. Large generators are connected to the transmission<br />
grid.<br />
In the province <strong>of</strong> Zuid Holland there are three large<br />
areas having a high penetration <strong>of</strong> DG-units. In Table 2<br />
an overview <strong>of</strong> the location, type and amount <strong>of</strong> DG is<br />
given.<br />
Substation Type <strong>of</strong> DG S tot [MVA]<br />
Sub 3 Wind Turbines 70<br />
Sub 4 Wind Turbines 40<br />
Sub 6 CHP-plants 200<br />
Sub 18 CHP-plants 400<br />
Sub 23 CHP-plants 300<br />
Table 2: Location, type and amount <strong>of</strong> DG<br />
In the case-study substation 6 is taken as an example<br />
to study the voltage dip propagation <strong>through</strong> the transmission<br />
and distribution grid as well as the effect <strong>of</strong> the<br />
voltage dips on the DG-units. There<strong>for</strong>e the MV-grid<br />
fed by substation 6 is modeled in detail including DGunits.<br />
The MV-grid is schematically shown in Figure 10.<br />
The generic <strong>fault</strong> clearing times <strong>of</strong> the MV-grid<br />
shown in Figure 10 are listed in Table 3.<br />
Figure 10: Overview <strong>of</strong> MV-grid having large penetration <strong>of</strong><br />
DG-units<br />
Figure 9: Transmission grid <strong>of</strong> the province <strong>of</strong> Zuid Holland,<br />
the Netherlands<br />
Voltage level Protection Fault clearing time<br />
380 kV distance 150 ms<br />
150 kV distance 150 ms<br />
25 kV overcurrent 600 ms<br />
23 kV overcurrent 300 ms<br />
10 kV overcurrent 0 ms<br />
Table 3: Generic <strong>fault</strong> clearing times<br />
16th <strong>PSCC</strong>, Glasgow, Scotland, July 14-18, 2008 Page 4
4.2 Voltage Dips Pr<strong>of</strong>ile<br />
As mentioned earlier the <strong>fault</strong> frequency is based on<br />
the failure rate <strong>of</strong> the components in the system. Based<br />
on [8] <strong>for</strong> HV-lines and MV-cables respectively λ =<br />
0.54 [times per annum/100 km] and λ = 1.02 [times per<br />
annum/100 km] is used. In Table 4 the <strong>fault</strong> type distribution<br />
is given.<br />
Component 3 ph 1 ph 2 ph 2 ph-ground<br />
HV OH-line 30% 60% 5% 5%<br />
MV cable 30% 70% – –<br />
Table 4: Failure rate and <strong>fault</strong> distribution<br />
In PowerFactory a tool is available to calculate voltage<br />
dip tables. With the aid <strong>of</strong> this tool, the failure rate<br />
and <strong>fault</strong> distribution voltage dip pr<strong>of</strong>iles are constructed<br />
<strong>for</strong> a generator connection in the 10 kV grid <strong>of</strong><br />
Figure 10. The results are reported in two distinct ways:<br />
1. Dip pr<strong>of</strong>ile including <strong>fault</strong> type distribution.<br />
2. Dip pr<strong>of</strong>ile including voltage level distribution.<br />
The first pr<strong>of</strong>ile is depicted in Figure 11 and shows<br />
on the x-axis the depth <strong>of</strong> the dip (remains voltage level)<br />
experienced by the generator and on the y-axis the frequency<br />
<strong>of</strong> occurrence. The undervoltage protection<br />
measures the voltage between the phases so the voltage<br />
dip pr<strong>of</strong>iles are based on the line-line voltage. According<br />
to [7, 9] in case <strong>of</strong> a single phase to ground <strong>fault</strong>s the<br />
zero sequence voltage does not propagate <strong>through</strong> a Dy<br />
and Yd trans<strong>for</strong>mer. When Z0 ≫ Z1<br />
the sagged voltage<br />
remains high. All voltage levels smaller than 0.8 p.u.<br />
are caused by three phase <strong>fault</strong>s.<br />
1.4<br />
single phase to ground <strong>fault</strong>s and the dips do not really<br />
propagate <strong>through</strong> the Dy and Yd trans<strong>for</strong>mers.<br />
Times per year<br />
1.4<br />
1.2<br />
1<br />
0.8<br />
0.6<br />
0.4<br />
0.2<br />
0<br />
10 kV<br />
20 kV<br />
25.6 kV<br />
150 kV<br />
380 kV<br />
0.2 0.4 0.6 0.7 0.8 0.85 0.9 0.95<br />
U [p.u.]<br />
Figure 12: Voltage dip pr<strong>of</strong>ile based on different voltage<br />
levels at generator terminals<br />
5 RESULTS<br />
In this section the results <strong>of</strong> the case study are discussed.<br />
The aim <strong>of</strong> the case study is to demonstrate<br />
whether the DG-units can stay connected to the grid and<br />
maintain stable operation. There<strong>for</strong>e the worst case<br />
CCT-curve <strong>of</strong> the CHP-plant and the worst case CCTcurve<br />
<strong>of</strong> the wind turbine are depicted in Figure 13. To<br />
judge if the DG-units stay in stable operation, the duration<br />
<strong>of</strong> the dip has to be determined. This is done by<br />
combining the results <strong>of</strong> Figure 12 and the <strong>fault</strong> clearing<br />
time <strong>of</strong> the protection <strong>of</strong> the MV-grid (Table 3). It is<br />
assumed that all <strong>fault</strong>s are cleared by the primary protection.<br />
This leads to the red dots in Figure 13.<br />
1<br />
0.9<br />
Times per year<br />
1.2<br />
1<br />
0.8<br />
0.6<br />
3 phase<br />
2 phase<br />
2 phase-ground<br />
single phase-ground<br />
u [p.u.]<br />
0.8<br />
0.7<br />
0.6<br />
0.5<br />
0.4<br />
0.3<br />
0.4<br />
0.2<br />
0<br />
0.2 0.4 0.6 0.7 0.8 0.85 0.9 0.95<br />
U [p.u.]<br />
Figure 11: Voltage dip pr<strong>of</strong>ile based on <strong>fault</strong> distribution at<br />
generator terminals<br />
In Figure 12 the second dip pr<strong>of</strong>ile is depicted and<br />
shows the experienced voltage dip caused by disturbances<br />
at a different voltage level. In the figure it can be<br />
seen that voltage levels smaller than 0.8 p.u. are caused<br />
by <strong>fault</strong>s in the 25 and 20 kV grid. At the generator<br />
terminals dips caused by disturbances in the HV-grid are<br />
hardly noticed. As discussed above most <strong>of</strong> the <strong>fault</strong>s are<br />
0.2<br />
0.1<br />
CHP<br />
DFIG<br />
0<br />
0 0.1 0.2 0.3 0.4 0.5 0.6 0.7 0.8 0.9 1<br />
t [s]<br />
Figure 13: Comparison <strong>of</strong> <strong>fault</strong> clearing times and CCTcurves<br />
<strong>of</strong> DFIG and CHP-plant<br />
Most dots are above both CCT-curves and those dips<br />
do not lead to unstable operation <strong>of</strong> either the wind<br />
turbine or the CHP-plants. The dots under the CCTcurves<br />
are <strong>fault</strong>s in the 20 kV grid that have a clearing<br />
time, which is larger than the CCT <strong>of</strong> the DG-units. In<br />
this situation, keeping the DG-units connected lead to<br />
unstable operation. Preventing instability <strong>of</strong> the DGunits<br />
can be done by reducing the <strong>fault</strong> clearing time.<br />
16th <strong>PSCC</strong>, Glasgow, Scotland, July 14-18, 2008 Page 5
Reduction in <strong>fault</strong> clearing time can be reached by reducing<br />
time grading <strong>of</strong> two successive relays or applying<br />
differential protection.<br />
The nowadays undervoltage protection settings in the<br />
Netherlands are such that at voltage levels below 0.8<br />
p.u. all DG-units are disconnected. Comparing the current<br />
settings with the CCT-curves displayed in Figure<br />
13, it can be concluded that the settings <strong>of</strong> the undervoltage<br />
protection can be altered without instability <strong>of</strong><br />
the DG-units.<br />
Based on the data in Figure 12 with the current settings,<br />
the frequency <strong>of</strong> disconnection is 0.37 times per<br />
annum or 9.3 % <strong>of</strong> all the voltage dips (calculated by<br />
summing up all the frequencies <strong>of</strong> the voltage dips below<br />
0.8 p.u.). By applying the developed CCT-curves in<br />
the undervoltage protection the frequency <strong>of</strong> disconnection<br />
can be reduced to 0.02 times per annum or 0.5 % <strong>of</strong><br />
all the voltage dips. This figure holds <strong>for</strong> the wind turbine,<br />
while <strong>for</strong> the CHP-plant there are no disconnections<br />
at all. Thus, the availability <strong>of</strong> the DG-units can be<br />
increased significantly by adjusting the under-voltage<br />
protection in accordance with the CCT-curves.<br />
The <strong>fault</strong> <strong>ride</strong>-<strong>through</strong> capabilities <strong>of</strong> the wind turbine<br />
can be improved by adding a crowbar to the DFIG. The<br />
crowbar separates the rotor side converter from the rotor<br />
circuit. In [10] the operation <strong>of</strong> the crowbar is simulated<br />
and it is demonstrated that <strong>fault</strong> <strong>ride</strong> <strong>through</strong> during and<br />
after a deep voltage dip (0 V remains, 150 ms) is possible.<br />
6 CONCLUSION<br />
In this paper the <strong>ride</strong>-<strong>through</strong> behavior <strong>of</strong> a CHPplant<br />
and a DFIG-based wind turbine is studied. Based<br />
on the data <strong>of</strong> an existing power system including reliability<br />
data a voltage dip pr<strong>of</strong>ile at the generator terminals<br />
is established. This pr<strong>of</strong>ile is combined with the<br />
<strong>fault</strong> clearing times <strong>of</strong> the test system which have led to<br />
a plot where the depth and duration <strong>of</strong> the voltage dips<br />
are indicated. Using the single machine infinite network<br />
scheme the CCT-curves <strong>of</strong> the DG-units are derived.<br />
From stability point <strong>of</strong> view these curves show that it is<br />
not necessary to disconnect the DG-units at a voltage<br />
level <strong>of</strong> 0.8 p.u. (the present setting <strong>of</strong> DG undervoltage<br />
protection in the Netherlands), but at lower levels, which<br />
are dependent on the critical clearing times. These CCTcurves<br />
can be implemented in the undervoltage relay<br />
and prevent switching <strong>of</strong>f during a voltage dip caused by<br />
a <strong>fault</strong> in a HV- or neighboring MV-grid. In some cases<br />
disturbances in the 20 kV grid lead to unstable operation.<br />
This can be prevented by adjusting the <strong>fault</strong> clearing<br />
time or applying differential protection. For DFIG<br />
wind turbines transient stability can be significantly<br />
improved by introduction <strong>of</strong> crowbar protection and<br />
switching between different control strategies <strong>for</strong> normal<br />
operation and <strong>fault</strong> conditions.<br />
The method presented in this paper can be followed<br />
in all locations <strong>of</strong> the grid and prevent ambitious disconnection<br />
<strong>of</strong> DG.<br />
REFERENCES<br />
[1] B.M. Buchholz, “Dynamic Simulation <strong>of</strong> Renewable<br />
Energy Sources and Requirements on Fault Ride<br />
Through Behaviour”, Power Engineering Society<br />
General Meeting, Montreal, Canada, June, 2006<br />
[2] F.M. Gatta, F. Ilicento, S. Lauria and P. Masato,<br />
“Behaviour <strong>of</strong> Dispersed Generation in Distribution<br />
Networks During System Disturbances. Measures to<br />
prevent disconnection”, CIRED 17th International<br />
Conference on Electricity Distribution, Barcelona,<br />
May 2003<br />
[3] I. Erlich and U. Bachmann, “Grid Code Requirements<br />
Concerning Connection and Operation <strong>of</strong><br />
Wind Turbines in Germany”, IEEE Power Engineering<br />
Society General Meeting, San Francisco, Cali<strong>for</strong>nie,<br />
USA, 2005<br />
[4] G. Daniëls, “Betrieb von Mittelspannungsnetzen mit<br />
hoher Blockheizkraftwerkeinspeisung”, Band 39,<br />
dissertation Rheinisch-Westfälischen Technische<br />
Hochschule Aachen, 1996 (in German)<br />
[5] “SimPowerSystems User's Guide”, The Mathworks,<br />
2007<br />
[6] A.D. Hansen and G. Michalke, “Voltage grid support<br />
<strong>of</strong> DFIG wind turbines during grid <strong>fault</strong>s”,<br />
European Wind Energy Conference & Exhibition,<br />
Milan, Italy, May 2007<br />
[7] J.F.G. Cobben, “Power Quality: Implications at the<br />
Point <strong>of</strong> Connection”, PhD Thesis, ISBN: 978-90-<br />
386-1030-6, Eindhoven University <strong>of</strong> Technology,<br />
June 2007<br />
[8] R. Luiten et al, “Reliability <strong>of</strong> Electricity Networks<br />
in the Netherlands <strong>for</strong> 2006”, KEMA, May 2007 (in<br />
Dutch)<br />
[9] M.H.J. Bollen, “Understanding Power Quality Problems,<br />
Voltage Sags and Interruptions”, Piscataway,<br />
NJ: IEEE press, 1999<br />
[10]I. Erlich, H. Wrede and C. Feltes, “Dynamic Behavior<br />
<strong>of</strong> DFIG-Based Wind Turbines during Grid<br />
Faults”, PCC Power Conversion Conference, Nagoya,<br />
Japan, April, 2007<br />
16th <strong>PSCC</strong>, Glasgow, Scotland, July 14-18, 2008 Page 6