pdf file - Plasma Science and Fusion Center - MIT
pdf file - Plasma Science and Fusion Center - MIT
pdf file - Plasma Science and Fusion Center - MIT

Create successful ePaper yourself
Turn your PDF publications into a flip-book with our unique Google optimized e-Paper software.
1938 Phys. <strong>Plasma</strong>s, Vol. 8, No. 5, May 2001 Egedal et al.<br />
shown in Fig. 6D are obtained by evaluating the density<br />
along the poloidal location indicated by the dashed red line<br />
in Fig. 5D. The data used in creating the diagram in Fig.<br />
6D corresponds to data samples obtained at constant time<br />
interval t0.5 ms after the rf heating pulses.<br />
Similarly, the data used in creating the diagrams in Figs.<br />
7 was obtained with t0.3, 0.5 ms. The value of l 0<br />
B /B cusp for the magnetic configuration of Fig. 6 <strong>and</strong><br />
Figs. 7A <strong>and</strong> 7B is 0.3 m, whereas l 0 0.5 m for the<br />
magnetic configurations forming the basis for the data shown<br />
in Figs. 7C <strong>and</strong> 7D. In the diagram of Fig. 6D <strong>and</strong> the<br />
four diagrams in Fig. 7 the locations of the plasma boundaries<br />
are well defined <strong>and</strong> coincide with the location of the<br />
black dashed lines. These lines obtained through (t)<br />
tRE (t) represent the theoretical location of the plasma<br />
boundary assuming that the plasma is frozen into the poloidal<br />
magnetic flux. Hence, we find experimentally that the<br />
plasma is frozen into the poloidal magnetic flux. Due to the<br />
absence of a detectable toroidal current <strong>and</strong> an associate diffusion<br />
region, the poloidal magnetic field reconnect unhindered<br />
<strong>and</strong> arbitrarily fast. The rate of reconnection in the<br />
VTF experiment is solely determined by the operator by imposing<br />
a given value of the induced toroidal electric field.<br />
The poloidal drift speed, expressed in terms of the flux<br />
variable, d/dtRE , translates into a drift speed in real<br />
space given by v d E /B cusp , independent of the toroidal<br />
magnetic field. In the presence of a toroidal magnetic field,<br />
this drift speed is much larger than usual EB drift speed<br />
given by E /B inferred on the basis of the induced electric<br />
field where B is the total magnetic field.<br />
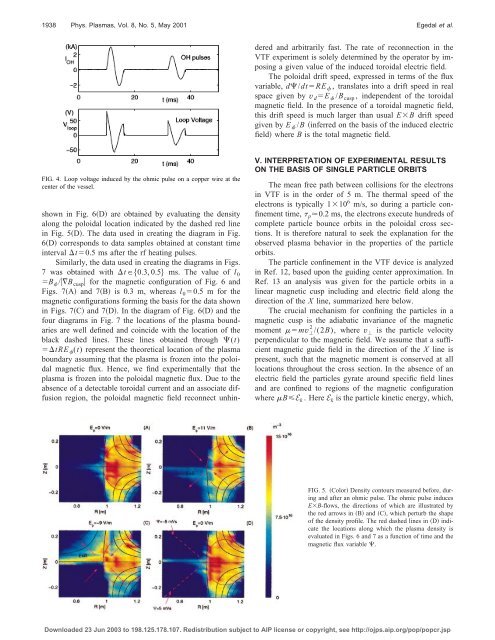
FIG. 4. Loop voltage induced by the ohmic pulse on a copper wire at the<br />
center of the vessel.<br />
V. INTERPRETATION OF EXPERIMENTAL RESULTS<br />
ON THE BASIS OF SINGLE PARTICLE ORBITS<br />
The mean free path between collisions for the electrons<br />
in VTF is in the order of 5 m. The thermal speed of the<br />
electrons is typically 110 6 m/s, so during a particle confinement<br />
time, p 0.2 ms, the electrons execute hundreds of<br />
complete particle bounce orbits in the poloidal cross sections.<br />
It is therefore natural to seek the explanation for the<br />
observed plasma behavior in the properties of the particle<br />
orbits.<br />
The particle confinement in the VTF device is analyzed<br />
in Ref. 12, based upon the guiding center approximation. In<br />
Ref. 13 an analysis was given for the particle orbits in a<br />
linear magnetic cusp including <strong>and</strong> electric field along the<br />
direction of the X line, summarized here below.<br />
The crucial mechanism for confining the particles in a<br />
magnetic cusp is the adiabatic invariance of the magnetic<br />
moment mv 2 /(2B), where v is the particle velocity<br />
perpendicular to the magnetic field. We assume that a sufficient<br />
magnetic guide field in the direction of the X line is<br />
present, such that the magnetic moment is conserved at all<br />
locations throughout the cross section. In the absence of an<br />
electric field the particles gyrate around specific field lines<br />
<strong>and</strong> are confined to regions of the magnetic configuration<br />
where BE k . Here E k is the particle kinetic energy, which,<br />
FIG. 5. Color Density contours measured before, during<br />
<strong>and</strong> after an ohmic pulse. The ohmic pulse induces<br />
EB-flows, the directions of which are illustrated by<br />
the red arrows in B <strong>and</strong> C, which perturb the shape<br />
of the density pro<strong>file</strong>. The red dashed lines in D indicate<br />
the locations along which the plasma density is<br />
evaluated in Figs. 6 <strong>and</strong> 7 as a function of time <strong>and</strong> the<br />
magnetic flux variable .<br />
Downloaded 23 Jun 2003 to 198.125.178.107. Redistribution subject to AIP license or copyright, see http://ojps.aip.org/pop/popcr.jsp