

Reliability Report -- 1999 - Pennsylvania Public Utility Commission
Reliability Report -- 1999 - Pennsylvania Public Utility Commission
Reliability Report -- 1999 - Pennsylvania Public Utility Commission

Create successful ePaper yourself
Turn your PDF publications into a flip-book with our unique Google optimized e-Paper software.
In 2010, the major cause of service outages was tree contact with 52.4 percent of interruptions affecting<br />
51.4 percent of customers for 78.0 percent of interruption minutes. The change to a more frequent<br />
(three-year) tree-trimming cycle is expected to help to contain the number of these types of<br />
interruptions. Equipment failure accounted for 19.1 percent of the outages, 21.5 percent of customers<br />
affected and 10.6 percent of interruption minutes. Animal contact was responsible for 11.1 percent of<br />
total outages, 5.0 percent of customers affected and 1.3 percent of interruption minutes. Figure 29<br />
shows the distribution of causes of service outages occurring during 2010 as a percentage of total<br />
outages. The trend in the number of outages by the top three major causes is shown in Figure 30.<br />
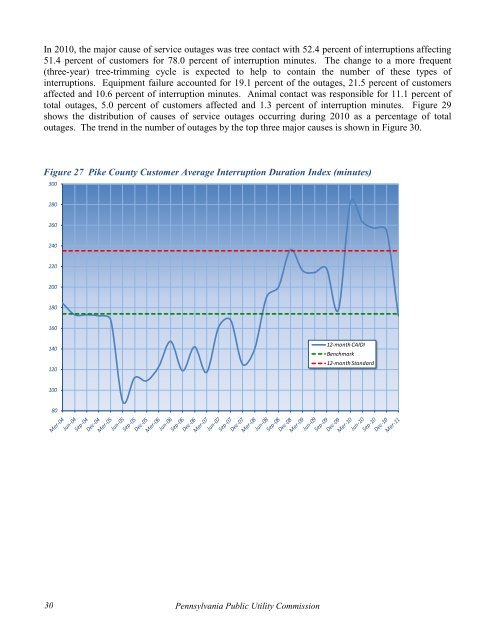
Figure 27 Pike County Customer Average Interruption Duration Index (minutes)<br />
300<br />
280<br />
260<br />
240<br />
220<br />
200<br />
180<br />
160<br />
140<br />
120<br />
12-month CAIDI<br />
Benchmark<br />
12-month Standard<br />
100<br />
80<br />
30<br />
<strong>Pennsylvania</strong> <strong>Public</strong> <strong>Utility</strong> <strong>Commission</strong>


