

Reliability Report -- 1999 - Pennsylvania Public Utility Commission
Reliability Report -- 1999 - Pennsylvania Public Utility Commission
Reliability Report -- 1999 - Pennsylvania Public Utility Commission

You also want an ePaper? Increase the reach of your titles
YUMPU automatically turns print PDFs into web optimized ePapers that Google loves.
PPL’s SAIFI increased from 0.89 in 2009 to 1.09 in 2010, which was a 22.5 percent increase in outage<br />
frequency and 7.9 percent better than the standard of 1.18. SAIFI had remained below the benchmark<br />
from June 2009 through June 2010, but is trending upward, attributable, in part, to storms that are not<br />
excludable. The SAIFI three-year average was 1.01, or 6.6 percent below the standard of 1.08. For the<br />
12-month average ending March 31, 2011, SAIFI was 1.16, or 1.5 percent below the standard. Figure<br />
32 depicts the trend in the frequency of service interruptions for the PPL system from March 2004<br />
through March 2011, compared to the established benchmark and standard for SAIFI.<br />
In 2010, equipment failure represented 27.8 percent of the interruptions, 32.1 percent of customers<br />
affected and 27.4 percent of interruptions minutes. PPL reported that a large portion of interruptions<br />
attributed to equipment failure were weather-related and are not considered to be indicators of<br />
equipment condition or performance. Non-trimming tree-related outages, generally caused by trees<br />
falling from outside of PPL’s rights-of-way, were the second-largest cause of customer outages<br />
representing 27.0 percent of incidents, 33.8 percent of customers affected and 48.4 percent of<br />
interruption minutes. Animal-related outages accounted for 23.6 percent of incidents, 5.3 percent of<br />
customers affected and 4.6 percent of interruption minutes. Figure 33 shows the distribution of causes<br />
of service outages occurring during 2010 as a percentage of total outages. The trend in the number of<br />
outages by the top three major causes is shown in Figure 34.<br />
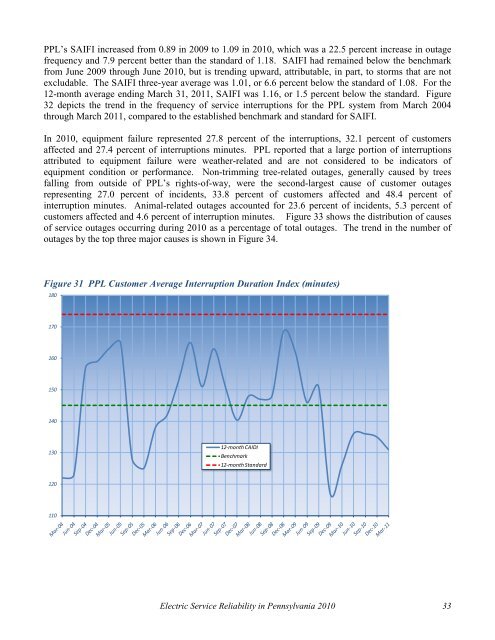
Figure 31 PPL Customer Average Interruption Duration Index (minutes)<br />
180<br />
170<br />
160<br />
150<br />
140<br />
130<br />
12-month CAIDI<br />
Benchmark<br />
12-month Standard<br />
120<br />
110<br />
Electric Service <strong>Reliability</strong> in <strong>Pennsylvania</strong> 2010 33


