2012 Annual Report - Racing NSW
2012 Annual Report - Racing NSW
2012 Annual Report - Racing NSW

You also want an ePaper? Increase the reach of your titles
YUMPU automatically turns print PDFs into web optimized ePapers that Google loves.
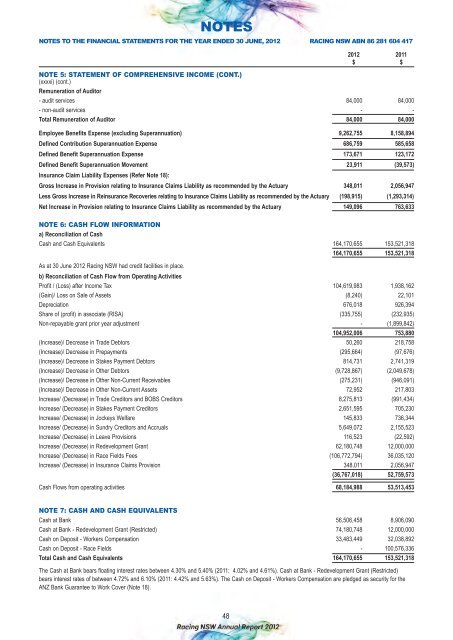
NOTES<br />
NOTES TO THE FINANCIAL STATEMENTS FOR THE YEAR ENDED 30 JUNE, <strong>2012</strong> RACING <strong>NSW</strong> ABN 86 281 604 417<br />
<strong>2012</strong> 2011<br />
$ $<br />
NOTE 5: STATEMENT OF COMPREHENSIVE INCOME (CONT.)<br />
(xxxxi) (cont.)<br />
Remuneration of Auditor<br />
- audit services 84,000 84,000<br />
- non-audit services - -<br />
Total Remuneration of Auditor 84,000 84,000<br />
Employee Benefits Expense (excluding Superannuation) 9,262,755 8,158,894<br />
Defined Contribution Superannuation Expense 686,759 585,658<br />
Defined Benefit Superannuation Expense 173,671 123,172<br />
Defined Benefit Superannuation Movement 23,911 (39,573)<br />
Insurance Claim Liability Expenses (Refer Note 18):<br />
Gross Increase in Provision relating to Insurance Claims Liability as recommended by the Actuary 348,011 2,056,947<br />
Less Gross Increase in Reinsurance Recoveries relating to Insurance Claims Liability as recommended by the Actuary (198,915) (1,293,314)<br />
Net Increase in Provision relating to Insurance Claims Liability as recommended by the Actuary 149,096 763,633<br />
NOTE 6: CASH FLOW INFORMATION<br />
a) Reconciliation of Cash<br />
Cash and Cash Equivalents 164,170,655 153,521,318<br />
164,170,655 153,521,318<br />
As at 30 June <strong>2012</strong> <strong>Racing</strong> <strong>NSW</strong> had credit facilities in place.<br />
b) Reconciliation of Cash Flow from Operating Activities<br />
Profit / (Loss) after Income Tax 104,619,983 1,938,162<br />
(Gain)/ Loss on Sale of Assets (8,240) 22,101<br />
Depreciation 676,018 926,394<br />
Share of (profit) in associate (RISA) (335,755) (232,935)<br />
Non-repayable grant prior year adjustment - (1,899,842)<br />
104,952,006 753,880<br />
(Increase)/ Decrease in Trade Debtors 50,260 218,758<br />
(Increase)/ Decrease in Prepayments (295,664) (97,676)<br />
(Increase)/ Decrease in Stakes Payment Debtors 814,731 2,741,319<br />
(Increase)/ Decrease in Other Debtors (9,728,867) (2,049,678)<br />
(Increase)/ Decrease in Other Non-Current Receivables (275,231) (946,091)<br />
(Increase)/ Decrease in Other Non-Current Assets 72,952 217,803<br />
Increase/ (Decrease) in Trade Creditors and BOBS Creditors 8,275,813 (991,434)<br />
Increase/ (Decrease) in Stakes Payment Creditors 2,651,595 705,230<br />
Increase/ (Decrease) in Jockeys Welfare 145,833 736,344<br />
Increase/ (Decrease) in Sundry Creditors and Accruals 5,649,072 2,155,523<br />
Increase/ (Decrease) in Leave Provisions 116,523 (22,592)<br />
Increase/ (Decrease) in Redevelopment Grant 62,180,748 12,000,000<br />
Increase/ (Decrease) in Race Fields Fees (106,772,794) 36,035,120<br />
Increase/ (Decrease) in Insurance Claims Provision 348,011 2,056,947<br />
(36,767,018) 52,759,573<br />
Cash Flows from operating activities 68,184,988 53,513,453<br />
NOTE 7: CASH AND CASH EQUIVALENTS<br />
Cash at Bank 56,506,458 8,906,090<br />
Cash at Bank - Redevelopment Grant (Restricted) 74,180,748 12,000,000<br />
Cash on Deposit - Workers Compensation 33,483,449 32,038,892<br />
Cash on Deposit - Race Fields - 100,576,336<br />
Total Cash and Cash Equivalents 164,170,655 153,521,318<br />
The Cash at Bank bears floating interest rates between 4.30% and 5.40% (2011: 4.02% and 4.61%). Cash at Bank - Redevelopment Grant (Restricted)<br />
bears interest rates of between 4.72% and 6.10% (2011: 4.42% and 5.63%). The Cash on Deposit - Workers Compensation are pledged as security for the<br />
ANZ Bank Guarantee to Work Cover (Note 18).<br />
48