Fatigue analysis of catenary contact wires for high speed trains
Fatigue analysis of catenary contact wires for high speed trains
Fatigue analysis of catenary contact wires for high speed trains

You also want an ePaper? Increase the reach of your titles
YUMPU automatically turns print PDFs into web optimized ePapers that Google loves.
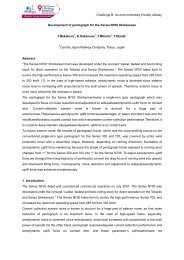
Challenge E: Bringing the territories closer together at <strong>high</strong>er <strong>speed</strong>s<br />
<strong>Fatigue</strong> <strong>analysis</strong> <strong>of</strong> <strong>catenary</strong> <strong>contact</strong> <strong>wires</strong> <strong>for</strong> <strong>high</strong> <strong>speed</strong> <strong>trains</strong><br />
J.P. Massat 1 , T.M.L. Nguyen-Tajan 1 , H. Maitournam 2 , E. Balmès 3 and A. Bobillot 4<br />
1 : Research Department, French Railways (SNCF), Paris, France<br />
2 : Laboratory <strong>for</strong> the Mechanics <strong>of</strong> Solids – Ecole Polytechnique<br />
3 : SDTools/Ecole Nationale Supérieure d’Arts et Métiers ParisTech<br />
4 : Engineering Department, French Railways (SNCF), Paris, France<br />
Corresponding author: Jean-Pierre Massat (jean-pierre.massat@sncf.fr), Direction de l’Innovation et<br />
de la Recherche, 45, rue de Londres, 75379, Paris Cedex 08, FRANCE<br />
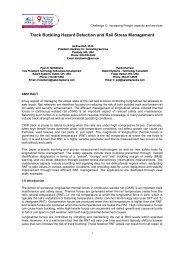
The fatigue fracture is one <strong>of</strong> the most critical failures which may occur on the <strong>high</strong> <strong>speed</strong><br />
network because it is undetectable and it has a huge impact on traffic disruption. The<br />
<strong>contact</strong> wire lifespan <strong>of</strong> a <strong>high</strong> <strong>speed</strong> line is estimated at more than 50 years and thus it is<br />
necessary to consider the risk <strong>of</strong> fatigue. The Railway Technical Research Institute in<br />
Japan studied this phenomenon <strong>for</strong> a long time and per<strong>for</strong>med experimental tests. Using<br />
these results and by comparing with failures occurred in France, a preliminary <strong>analysis</strong> is<br />
carried out to identify parameters which significantly influence the fatigue phenomenon.<br />
This <strong>analysis</strong> consists in using the numerical s<strong>of</strong>tware OSCAR © to evaluate the loads,<br />
per<strong>for</strong>m a fatigue assessment <strong>of</strong> the <strong>contact</strong> wire. The procedure, using a onedimensional<br />
and a three-dimensional model, is described in this article.<br />
Keywords: Overhead Contact Line (OCL), hard drawn copper <strong>contact</strong> wire, fatigue failure, Dang<br />
Van’s criterion, Finite Element volume mesh.<br />
1 Introduction<br />
Nowadays, the main criterion used to determine the <strong>contact</strong> wire replacement <strong>of</strong> the Overhead<br />
Contact Line (OCL) is wear but, on <strong>high</strong> <strong>speed</strong> lines, the measured wear rate is very small. In this<br />
way, the <strong>contact</strong> wire lifespan <strong>of</strong> a <strong>high</strong> <strong>speed</strong> line is estimated at more than 50 years and thus it is<br />
necessary to consider the risk <strong>of</strong> having other types <strong>of</strong> system failure.<br />
The fatigue fracture is one <strong>of</strong> the most critical failures which may occur on the <strong>high</strong> <strong>speed</strong> network<br />
because it is undetectable and it has a huge impact on traffic disruption, client discom<strong>for</strong>t (delays,<br />
<strong>speed</strong> slowdowns) and cost explosion. Un<strong>for</strong>tunately, conditions <strong>of</strong> use increase the risk <strong>of</strong> fatigue<br />
failure:<br />
• with overloaded traffic, each year more than 220 000 pantographs run under the <strong>catenary</strong><br />
between Paris and Lyon,<br />
• the tensile load applied to the <strong>contact</strong> wire is very <strong>high</strong> particularly on <strong>high</strong> <strong>speed</strong> lines and may<br />
increase in the future,<br />
• the damping ratio <strong>of</strong> the <strong>catenary</strong> is so low that a loading cycle is composed <strong>of</strong> several bending<br />
waves preceding and following the pantograph passage,<br />
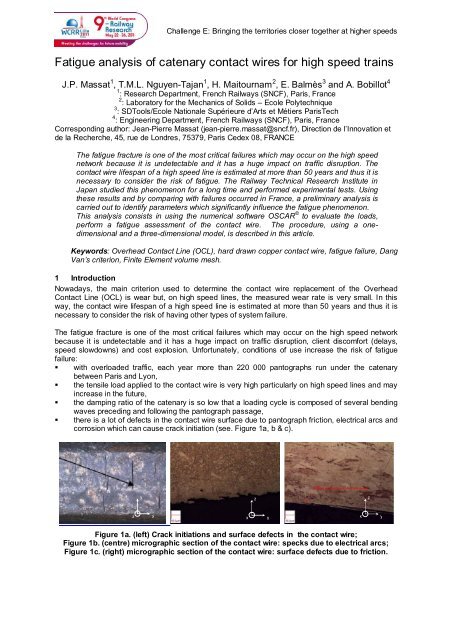
• there is a lot <strong>of</strong> defects in the <strong>contact</strong> wire surface due to pantograph friction, electrical arcs and<br />
corrosion which can cause crack initiation (see. Figure 1a, b & c).<br />
y<br />
z<br />
z<br />
z<br />
x<br />
x<br />
y<br />
x<br />
y<br />
Figure 1a. (left) Crack initiations and surface defects in the <strong>contact</strong> wire;<br />
Figure 1b. (centre) micrographic section <strong>of</strong> the <strong>contact</strong> wire: specks due to electrical arcs;<br />
Figure 1c. (right) micrographic section <strong>of</strong> the <strong>contact</strong> wire: surface defects due to friction.
Challenge E: Bringing the territories closer together at <strong>high</strong>er <strong>speed</strong>s<br />
In France, some fatigue failures have already occurred on the overhead <strong>contact</strong> line between Paris<br />
and Lyon. This overhead line was replaced after only 29 years <strong>of</strong> use because fatigue failures took<br />
place under the junction claws. This component, commonly used in maintenance on classical lines,<br />
appeared to be inadequate when used on <strong>high</strong> <strong>speed</strong> lines. Its heavy weight and its <strong>high</strong> stiffness<br />
produce important dynamic loads and arcing with the pantograph passage. A modification <strong>of</strong> the<br />
maintenance procedure limits the number <strong>of</strong> settled claws and their duration, but the fatigue could<br />
take place on other lines.<br />
Indeed, the French network <strong>speed</strong> rising tendency requires an increase <strong>of</strong> the mechanical tension in<br />
the <strong>contact</strong> wire and this parameter heightens the fatigue failure phenomenon.<br />
The RTRI 1 , one <strong>of</strong> the research departments <strong>of</strong> Japan railways, studied the fatigue failure <strong>of</strong> the<br />
<strong>contact</strong> wire <strong>for</strong> a long time, see [1], [2] and [3]. They developed a specific test bench and per<strong>for</strong>med<br />
inline tests in order to measure and study the stress cycles in the <strong>contact</strong> wire. A comparison <strong>of</strong> the<br />
different approaches is led over the partnership between RTRI and SNCF.<br />
In this paper, we show the numerical study developed by SNCF using experimental results <strong>of</strong> RTRI as<br />
reference. The numerical study was carried out using OSCAR ©2 , the pantograph-<strong>catenary</strong> dynamic<br />
interaction simulation s<strong>of</strong>tware developed at SNCF and based on Finite Elements (FE) method [4].<br />
This tool is used to compute dynamic loads in the <strong>catenary</strong> using 1D finite element and to deduce the<br />
zone <strong>of</strong> maximum uniaxial stresses along the <strong>catenary</strong>. A fully 3D <strong>contact</strong> wire model <strong>of</strong> this selected<br />
zone is then built to study the multiaxial stress history in the <strong>contact</strong> wire section [5].<br />
2 Preliminary <strong>analysis</strong><br />
In this section, results <strong>of</strong> inline fatigue failure obtained on the French network and on the test bench <strong>of</strong><br />
RTRI are compared. Using this preliminary <strong>analysis</strong>, it appears that the phenomena are complex and<br />
difficult to predict.<br />
Indeed, <strong>contact</strong> wire failure which occurred inline (next to a claw) are different from those obtained<br />
using the test bench <strong>of</strong> RTRI. In both cases, the fatigue failure process follows three stages: crack<br />
initiation, crack propagation and failure. This last step occurs when the material that has not been<br />
affected by the crack cannot withstand the applied stress. One can determine material failed by<br />
fatigue by examining the appearance <strong>of</strong> the fracture. A fatigue fracture will have two distinct regions;<br />
one being smooth or burnished as a result <strong>of</strong> the rubbing <strong>of</strong> the bottom and top <strong>of</strong> the crack; the<br />
second is granular, due to the rapid failure <strong>of</strong> the material. These visual clues may be seen in Figure 3<br />
and Figure 5a but these figures illustrate significant differences between test bench and inline failure.<br />
2.1 Contact wire fatigue fracture on test bench<br />
The RTRI research department built a specific test bench to study fatigue breakage phenomenon [2].<br />
This test bench described in the Figure 2 was designed to reproduce realistic operation conditions by<br />
using a sample <strong>of</strong> real <strong>contact</strong> wire, by adding a tensile load on the <strong>contact</strong> wire to obtain the relevant<br />
mean stress and by applying a representative bending stress controlled by de<strong>for</strong>mation.<br />
Considering the test is per<strong>for</strong>med on a sample <strong>of</strong> a real <strong>contact</strong> wire, without any machining and thus<br />
with a constant section, a three bending point bench was chosen to <strong>for</strong>ce the fatigue failure to take<br />
place under the oscillating roller as described in Figure 2. In this way, it is easier to stick sensors<br />
close to the crack initiation point.<br />
Figure 2. RTRI test bench <strong>for</strong> OCL <strong>contact</strong> wire study [2].<br />
1 Railway Technical Research Institute<br />
2 OSCAR : Outil de Simulation du CAptage pour la Reconnaissance des défauts
Challenge E: Bringing the territories closer together at <strong>high</strong>er <strong>speed</strong>s<br />
Some tests were made on this bench using samples <strong>of</strong> OCL <strong>contact</strong> wire provided by SNCF. This<br />
was a hard drawn copper <strong>contact</strong> wire used on <strong>high</strong> <strong>speed</strong> lines and its section was 150mm 2 . The<br />
tensile load applied was 19.6kN.<br />
Origin <strong>of</strong> fatigue crack<br />
<strong>Fatigue</strong> zone<br />
Failure zone<br />
Figure 3. <strong>Fatigue</strong> fracture obtained on the RTRI’s bench.<br />
The fatigue crack appearance is shown in Figure 3. The three steps <strong>of</strong> the fatigue process can be<br />
identified: crack initiation, crack propagation and failure. The origin <strong>of</strong> the fatigue crack occurred on<br />
the top <strong>of</strong> the <strong>contact</strong> wire. Indeed, a dark area corresponding to crack initiation begins on the upper<br />
edge <strong>of</strong> the wire and the crack propagates to failure by necking <strong>of</strong> the wire. One can note that these<br />
tests are reproducible and evolution <strong>of</strong> the fatigue fracture appearance remains independent <strong>of</strong> the<br />
bending strain amplitude.<br />
2.2 Inline fatigue failure <strong>analysis</strong><br />
The behaviour described above is different from that obtained inline though <strong>contact</strong> wire is similar.<br />
This may be explained because all inline fatigue failures on the French network occurred under a<br />
junction claw (see Figure 4).<br />
Figure 4. Photos <strong>of</strong> a junction claw.<br />
This component is used to connect two <strong>contact</strong> <strong>wires</strong> because <strong>of</strong> a breakage or to rein<strong>for</strong>ce a weak<br />
point <strong>of</strong> the wire. Its mass is greater than the apparent mass <strong>of</strong> the <strong>catenary</strong>. When the pantograph<br />
passes under this component, it sets <strong>of</strong>f a significant dynamic loading associated to <strong>high</strong> level <strong>of</strong><br />
stress.<br />
Figure 5a illustrates the <strong>contact</strong> wire fatigue fracture appearance obtained inline under a junction claw<br />
and Figure 5b shows that the <strong>contact</strong> wire rupture occurred at the boundary <strong>of</strong> the junction claw.<br />
However, the fatigue crack appearance is different from test bench: the origin <strong>of</strong> the crack failure took<br />
place under a junction claw on the lower edge <strong>of</strong> the <strong>contact</strong> wire. In other words, the crack initiation<br />
occurred on the sliding part.<br />
Necking<br />
Failure zone<br />
<strong>Fatigue</strong> zone<br />
Crack initiation
Challenge E: Bringing the territories closer together at <strong>high</strong>er <strong>speed</strong>s<br />
Figure 5a. Inline CW fatigue fracture appearance under a junction claw; Figure 5b. Side view <strong>of</strong><br />
a failure under a junction claw.<br />
In conclusion, the phenomena involved in the fatigue failure <strong>of</strong> the <strong>contact</strong> wire are very sensitive to<br />
environmental conditions. For instance under a junction claw, the stress fields are different:<br />
• First, the clamping <strong>for</strong>ce applied by the junction claw to the wire exceeds 2kN/cm that has the<br />
effect <strong>of</strong> locally, but significantly, increasing the mean stress.<br />
• Second, the dynamic stresses due to pantograph passage are strongly increased with the<br />
inertial effects added by the junction claw which generate a discontinuity <strong>of</strong> the apparent mass,<br />
The coupling <strong>of</strong> these phenomena makes the <strong>analysis</strong> <strong>of</strong> <strong>catenary</strong> fatigue complex.<br />
Since it is impossible to per<strong>for</strong>m tests on a bench with a junction claw, we attempted to simulate this<br />
phenomenon using a numerical model. Given the importance <strong>of</strong> having realistic stresses and the <strong>high</strong><br />
difficulty <strong>of</strong> simulating the dynamic interaction between pantograph and <strong>catenary</strong>, OSCAR © is used<br />
because it is already validated and certificated.<br />
3 OSCAR © : pantograph-<strong>catenary</strong> dynamic simulation<br />
In the present section, we will first explain the complexity <strong>of</strong> the overhead line physics (also see [6],<br />
[7]), and then, how they are handled in the OSCAR © simulation s<strong>of</strong>tware.<br />
Firstly, the dynamic behaviour <strong>of</strong> the two flexible structures (the pantograph and the <strong>catenary</strong>) in<br />
sliding <strong>contact</strong> is very different in spite <strong>of</strong> having comparable stiffness. On one hand, the overhead<br />
line is a very long structure <strong>of</strong> <strong>wires</strong>, strongly prestressed in which bending waves propagate and, on<br />
the other hand, the pantograph is an articulated frame excited on two sides, by the train and by the<br />
overhead line, subjected to a disturbed aerodynamic environment.<br />
Figure 6a. (left) Finite Element Catenary; Figure 6b. (right) Multibody pantograph.<br />
The sliding <strong>contact</strong> between these two flexible structures is the main difficulty in the modelling <strong>of</strong> the<br />
pantograph <strong>catenary</strong> dynamics. In OSCAR © , the overhead line is modelled using the Finite Element<br />
method and the <strong>contact</strong> with the pantograph is managed using the penalty method.<br />
Secondly, pantograph-overhead line dynamics is particularly sensitive to the <strong>catenary</strong> static state.<br />
The computed static state is used to initialise the dynamic calculation and has consequently a very<br />
large impact on results. A realistic static state is however very complex to compute since it is <strong>high</strong>ly<br />
non-linear. Indeed, the mechanical tension on the overhead line components involves <strong>high</strong> levels <strong>of</strong><br />
stress and geometrical deflexions. In OSCAR © , the final geometry is obtained through a strongly non<br />
linear procedure which consists <strong>of</strong> solving iteratively<br />
K q<br />
i qi<br />
Fi<br />
,<br />
where i is the iteration number, q is the displacement vector, K the stiffness matrix and F the <strong>for</strong>ce<br />
vector.<br />
This procedure uses a progressive loading considering both the mechanical tension and the gravity.<br />
At each iteration i, the stiffness matrix is updated to consider the stress evolution in the whole<br />
overhead line and the convergence <strong>of</strong> displacements is finally ensured.<br />
Prestressed beam <strong>for</strong>mulations are used in order to take into account the additional stiffness due to<br />
mechanical tension. The equation below shows that the tension T has a big impact on the stiffness<br />
elementary matrix:
Challenge E: Bringing the territories closer together at <strong>high</strong>er <strong>speed</strong>s<br />
1<br />
N<br />
T<br />
N<br />
1<br />
N<br />
N<br />
2<br />
N<br />
<br />
<br />
u u<br />
w w<br />
w w<br />
K <br />
<br />
<br />
j<br />
ES<br />
T<br />
EI<br />
3 2 2<br />
j<br />
L r<br />
r<br />
L r<br />
r<br />
<br />
L r<br />
r<br />
<br />
This step plays a major role in the calculation <strong>of</strong> the mean stress in the <strong>contact</strong> wire. A validated<br />
computation is mandatory to obtain good results.<br />
Other non-linearities appear in the system dynamics. First <strong>of</strong> all, the pantograph-<strong>catenary</strong> <strong>contact</strong> is<br />
unilateral, which can generate electrical arcs. The second non-linearity <strong>of</strong> the <strong>catenary</strong> is due to the<br />
droppers’ unilaterality, as illustrated in the figure below, where one can notice that droppers do<br />
slacken at the pantograph passage.<br />
Lastly, the overhead line is a wire structure <strong>of</strong> very big dimensions, strongly prestressed and very<br />
slightly damped. Bending waves propagate in the whole structure, reflect on different elements <strong>of</strong> the<br />
overhead line, and remain some minutes after the pantograph passage.<br />
Damping modelling quality thus plays an important role in the s<strong>of</strong>tware accuracy. OSCAR © uses a<br />
damping model based on Rayleigh hypothesis with different coefficients <strong>for</strong> each part <strong>of</strong> the overhead<br />
line (<strong>contact</strong> wire, messenger wire, droppers, steady arm, stitch wire):<br />
C <br />
<br />
i<br />
i<br />
i<br />
T<br />
M K<br />
where i is the index <strong>of</strong> the overhead line component group.<br />
i<br />
i<br />
1<br />
<br />
2<br />
N<br />
T<br />
<br />
350<br />
Measured <strong>contact</strong> <strong>for</strong>ce<br />
Simulated <strong>contact</strong> <strong>for</strong>ce<br />
300<br />
Contact <strong>for</strong>ce [N]<br />
250<br />
200<br />
150<br />
100<br />
50<br />
1.0528 1.0534 1.0539 1.0544 1.055 1.0555 1.0561 1.0566<br />
Position [m]<br />
Figure 7. Contact <strong>for</strong>ce correlation between simulation and measurements.<br />
Figure 7 presents the comparison between simulated <strong>contact</strong> <strong>for</strong>ce <strong>of</strong> OSCAR © (blue) and<br />
measurements (red). The good correlation <strong>of</strong> the both signals <strong>of</strong> <strong>contact</strong> <strong>for</strong>ce between the<br />
pantograph and the <strong>catenary</strong> confirms that loadings computed in OSCAR © can be used to study<br />
fatigue phenomena.<br />
x 10 5<br />
400<br />
350<br />
maximum<br />
claw<br />
Simulated <strong>contact</strong> <strong>for</strong>ce with clamp<br />
New version simulated <strong>contact</strong> <strong>for</strong>ce<br />
300<br />
Contact <strong>for</strong>ce [N]<br />
250<br />
200<br />
150<br />
100<br />
1.0534 1.0539 1.0544 1.055 1.0555 1.0561<br />
Position [m]<br />
x 10 5<br />
Figure 8. Illustration <strong>of</strong> the <strong>contact</strong> <strong>for</strong>ce fluctuations due to junction claw using simulation<br />
tools.<br />
The Figure 8 illustrates the strong effect <strong>of</strong> junction claws on pantograph <strong>catenary</strong> dynamics. Indeed,<br />
the two curves are calculated with exactly same models. Only a junction was added in the black<br />
curve. Big fluctuations due to claw can be observed with the maximum value and maximum amplitude<br />
<strong>of</strong> the <strong>contact</strong> <strong>for</strong>ce. This modifications begins be<strong>for</strong>e the passage <strong>of</strong> the pantograph under the claw,
Challenge E: Bringing the territories closer together at <strong>high</strong>er <strong>speed</strong>s<br />
this shows that it is mandatory to calculate stress cycle directly in OSCAR © because loading cycles<br />
are strongly related to operational conditions.<br />
4 <strong>Fatigue</strong> <strong>analysis</strong><br />
This section presents the whole procedure built to per<strong>for</strong>m a fatigue <strong>analysis</strong>.<br />
The loading path is a very sensitive parameter in fatigue study. For instance, the bending waves in<br />
<strong>catenary</strong> may influence the fatigue phenomenon. There<strong>for</strong>e, a new functionality to study stresses in<br />
the <strong>contact</strong> wire was included in OSCAR © because it provides very predictive loading path.<br />
It is necessary to study the multiaxial stresses because friction between the pantograph and the<br />
<strong>contact</strong> wire generates stresses upon plans xz and yz, the clamping <strong>for</strong>ce imposed by the junction<br />
claw may exceed 2kN/cm (the average stress in the <strong>contact</strong> wire is then heavily modified near this<br />
component) and last the junction claw applies a torsional stress caused by the swaying <strong>of</strong> the claw<br />
around the <strong>contact</strong> wire axis as drawn in the Figure 9.<br />
z<br />
x<br />
y<br />
Contact plan<br />
Figure 9. Swaying <strong>of</strong> the claw around the <strong>contact</strong> wire axis.<br />
There<strong>for</strong>e, it is necessary to work with a volume mesh <strong>of</strong> the <strong>contact</strong> wire to take into account all<br />
these phenomena. However, a volume mesh <strong>of</strong> the complete <strong>contact</strong> wire is impossible because the<br />
mesh refinement required here is very <strong>high</strong>.<br />
OSCAR © uses one-dimensional (1D) finite elements. Thus, as a first step, longitudinal stress is<br />
studied using the 1D model to identify where the greatest stress is obtained along the OCL <strong>contact</strong><br />
wire, <strong>for</strong> instance, near a support – where the stiffness is the most important – or rather at mid-span –<br />
where movements are important. This critical area in the <strong>catenary</strong> is studied using a volume mesh <strong>of</strong><br />
the <strong>contact</strong> wire, like a zoom (see Figure 10), in order to limit required resources.<br />
Figure 10. Zoom on <strong>contact</strong> wire using a volume mesh.<br />
The dynamic interaction between pantograph and <strong>catenary</strong> is computed using only the 1D mesh that<br />
is fully validated. The volume mesh is used to obtain a fully three-dimensional representation <strong>of</strong><br />
stresses corresponding to a multiaxial loading. The kinematics fields and strain fields from 1D<br />
calculation are imposed at boundaries and the <strong>contact</strong> <strong>for</strong>ce history is applied to the volume mesh to<br />
calculate multiaxial stresses.
Challenge E: Bringing the territories closer together at <strong>high</strong>er <strong>speed</strong>s<br />
Figure 11. Dropper claw and boundary conditions.<br />
For instance, the dropper claw requires an additional element corresponding to the dropper to take<br />
into account all boundary conditions as shown in the Figure 11.<br />
The <strong>contact</strong> wire wear increasing with the number <strong>of</strong> cycle (corresponding to pantograph passage),<br />
fatigue and wear are strongly coupled [3]. There<strong>for</strong>e, it is necessary to update the model because the<br />
mean stress, which is a critical parameter, changes with the wire section. First, the dynamic study<br />
made in OSCAR © takes into account the beam element properties changes due to mass and stiffness<br />
reduction. Second, the volume mesh is changed to obtain a realistic stress values.<br />
4.1 One dimensional <strong>analysis</strong><br />
The RTRI carried out inline tests to measure the bending strain amplitudes [2]. The strain wave<strong>for</strong>m,<br />
given in Figure 12, is composed <strong>of</strong> a steep peak due to pantograph passage, preceded and followed<br />
by smaller amplitudes waves. Sugahara and all estimated the effect <strong>of</strong> accompanying waves on the<br />
fatigue life by using a wave<strong>for</strong>m counting method described in [3].<br />
Figure 12. Contact wire bending stress amplitude measured inline in Japan [3].<br />
The measured average is null because sensors were stuck on the upper surface <strong>of</strong> the inline <strong>contact</strong><br />
wire. Thus the mean tensile strain exerted by the tensile load is not measured.<br />
A simulation using OSCAR © was done to compare numerical results to this measurement. To<br />
reproduce this test conditions in OSCAR © , the stress σ xx was calculated and the strain a was<br />
deduced as<br />
<br />
xx<br />
<br />
0<br />
a<br />
where σ 0 is the mean stress due to tension and E is the hard copper Young modulus.<br />
E<br />
OSCAR © being a finite element model using pretensionned Euler-Bernoulli beams and using<br />
generalized constraints, the longitudinal stress σ xx is given by<br />
N M M<br />
z y<br />
xx x, y,<br />
z,<br />
t y z E y<br />
z z<br />
y<br />
,<br />
S I I<br />
z<br />
at any time t and <strong>for</strong> each point <strong>of</strong> the <strong>contact</strong> wire section using the coordinates (y, z). In this way, as<br />
sensors were stuck on the upper surface <strong>of</strong> the <strong>contact</strong> wire, the study was per<strong>for</strong>med <strong>for</strong> the point C<br />
represented in Figure 13.<br />
y
Challenge E: Bringing the territories closer together at <strong>high</strong>er <strong>speed</strong>s<br />
C<br />
B<br />
z<br />
D<br />
y<br />
Wear<br />
A<br />
E<br />
Figure 13. Virtual <strong>contact</strong> wire section.<br />
The numerical result, illustrated in Figure 14, is different from measurements <strong>for</strong> waves which precede<br />
and follow the pantograph passage.<br />
It can be explained by differences <strong>of</strong> French and Japanese catenaries and pantographs or by different<br />
damping ratio in <strong>catenary</strong> or by differences <strong>of</strong> frequency bandpass between measurements and<br />
s<strong>of</strong>tware [8].<br />
Bending strain amplitude (x10 -6 )<br />
600<br />
400<br />
200<br />
0<br />
-200<br />
Time<br />
Figure 14. Contact wire bending stress amplitude computed with OSCAR © .<br />
Nevertheless, the maximum and minimum bending strain amplitudes due to peak are similar and thus<br />
these results are good enough to make a preliminary fatigue <strong>analysis</strong>.<br />
A criterion based on the Goodman's theory [9] is used, assuming an uniaxial loading. Although this<br />
assumption is not verified, it is applied in order to identify the most critical zone in the <strong>catenary</strong> as a<br />
preliminary study.<br />
To apply this criterion, the maximum value and the minimum value <strong>of</strong> the longitudinal stress is<br />
calculated <strong>for</strong> each node <strong>of</strong> the mesh, using respectively<br />
max<br />
x,<br />
y,<br />
z,<br />
t min x,<br />
y,<br />
z,<br />
t .<br />
and <br />
max<br />
t<br />
xx<br />
Secondly, the criterion is applied and the point P(x,y,z), corresponding to the maximum value <strong>of</strong><br />
a <br />
0.3 max<br />
max<br />
min<br />
is identified, with <br />
a<br />
x, y,<br />
z<br />
<br />
.<br />
2 3<br />
2<br />
The criterion can be expressed in a better known <strong>for</strong>m as:<br />
b<br />
a<br />
a m<br />
where a is the tensile strength and b is the fatigue limit.<br />
The result <strong>of</strong> this study, applied on French <strong>catenary</strong> and shown in Figure 15, illustrates that the<br />
<strong>high</strong>est values <strong>of</strong> the criterion are closed to support represented by vertical dotted lines on Figure 15.<br />
min<br />
t<br />
xx
Challenge E: Bringing the territories closer together at <strong>high</strong>er <strong>speed</strong>s<br />
criterion [MPa]<br />
50<br />
45<br />
40<br />
35<br />
30<br />
25<br />
20<br />
15<br />
310.5 360 409.5 459 513 567 621 675 729 783 837 886.5 940.5 994.5<br />
Position along the <strong>catenary</strong> section [m]<br />
Figure 15. <strong>Fatigue</strong> <strong>analysis</strong> using 1D criterion based on Goodman theory.<br />
As a conclusion, the main sensitive part <strong>of</strong> the <strong>catenary</strong>, regarding fatigue and using a 1D criterion, is<br />
close to supports.<br />
4.2 Three dimensional <strong>analysis</strong><br />
In this section, the 3D fatigue study is described. As it is explained be<strong>for</strong>e, the pantograph passage<br />
corresponds to one loading cycle and the related stress cycle is multiaxial because <strong>of</strong> the clamping<br />
<strong>for</strong>ce <strong>of</strong> claw junction and friction at the <strong>contact</strong> point. There<strong>for</strong>e, the multiaxial Dang Van's criterion<br />
[10], which is a generalization <strong>of</strong> the Goodman’s criterion to a multiaxial stress cycle, is used. It is<br />
written as<br />
If max t a p(<br />
t)<br />
there will not take place a crack initiation.<br />
t<br />
b<br />
• pt 1 <br />
<br />
t<br />
t<br />
<br />
t<br />
3<br />
11 22 33<br />
is the hydrostatic pressure<br />
• is the shear stress amplitude at mesoscopic scale<br />
• a and b are two material parameters determined from the endurance limits<br />
This criterion is generally represented in the ( t),p(t)diagram given in Figure 16.<br />
<br />
Loading path<br />
at point 1<br />
Loading path<br />
at point 2<br />
Material line (a, b)<br />
2<br />
Loading path<br />
at point 3<br />
1<br />
3<br />
p(t)<br />
Figure 16. Dang Van Diagram theory description.<br />
It is applied at each node <strong>of</strong> the volume mesh in order to identify which are critical <strong>for</strong> fatigue. All<br />
loading path are plotted in the diagram and if one loading path exceeds the threshold given by the<br />
material line (a, b), a crack inititation may occur. Otherwise, with none loading path over the material<br />
line, the component has a unlimited lifetime.
Challenge E: Bringing the territories closer together at <strong>high</strong>er <strong>speed</strong>s<br />
To apply the Dang Van’s criterion to <strong>catenary</strong>, it was necessary to build volume meshes <strong>for</strong> each<br />
configuration including different types <strong>of</strong> claws. In order to limit the size <strong>of</strong> claw meshes, their<br />
geometry was simplified and a mechanically equivalent component is meshed, as shown in Figure 17.<br />
Figure 17. Procedure to build volume mesh with a junction claw.<br />
The image at the bottom in Figure 17 represents isovalues <strong>of</strong> stress obtained in the <strong>contact</strong> wire,<br />
using FE <strong>analysis</strong>. The junction claw is considered as a non-de<strong>for</strong>ming component. The stress tensor<br />
obtained can be used to per<strong>for</strong>m a fatigue <strong>analysis</strong> by making a cumulative damage.<br />
5 Conclusion<br />
The proposed article deals with fatigue in the Overhead Contact Line (OCL) applied to a typical<br />
French <strong>catenary</strong>. This system failure is critical <strong>for</strong> railways operators. An <strong>analysis</strong> <strong>of</strong> the different<br />
parameters that significantly influence the fatigue phenomenon is carried out in this study.<br />
First, a preliminary <strong>analysis</strong> based on experimental results shows that involved phenomena are<br />
complex, particularly because <strong>of</strong> coupling <strong>of</strong> dynamics and wear, and because they are very sensitive<br />
to condition <strong>of</strong> use.<br />
Then, to ease understanding <strong>of</strong> these phenomena, a numerical study was made. The followed<br />
procedure is presented here. In order to use the very accurate results <strong>of</strong> dynamic interaction given by<br />
s<strong>of</strong>tware OSCAR © , new functionalities were developed to determine stresses fields in the <strong>catenary</strong>.<br />
The fatigue study is divided into two steps, first a 1D study is carried out to localise the critical area in<br />
<strong>catenary</strong> and then a volume mesh <strong>of</strong> the <strong>contact</strong> wire is built to particularly study junction claws, a<br />
component used in <strong>catenary</strong> maintenance which has triggered some incidents in France. Indeed, it is<br />
shown in this paper that the loading path is multiaxial and thus three dimensional models are<br />
necessary.<br />
Finally, an introduction to fatigue cycling based on the Dang Van’s criterion is presented.<br />
6 Acknowledgments<br />
This paper describes work undertaken in the context <strong>of</strong> the partnership between SNCF and RTRI.<br />
These fruitful exchanges have allowed discussions on methods and different approaches. We<br />
particularly emphasize the useful tests conducted by the RTRI to characterize the SNCF <strong>contact</strong> wire.<br />
Moreover, the authors thank S. Daouk <strong>for</strong> the helpful work achieved during his internship.
Challenge E: Bringing the territories closer together at <strong>high</strong>er <strong>speed</strong>s<br />
7 References<br />
[1] C. Yamashita, A. Sugahara, “Influence <strong>of</strong> Mean Stress on Contact Wire <strong>Fatigue</strong>”, QR <strong>of</strong> RTRI,<br />
Vol. 47, No. 1, Feb. 2006.<br />
[2] A. Sugahara, “Preventing <strong>Fatigue</strong> Breakage <strong>of</strong> Contact Wires”, Railway Technology<br />
Avalanche No. 24, September 19, 2008.<br />
[3] A. Sugahara, C. Yamashita, T. Usuki, “Applicability <strong>of</strong> Rain Flow Method to <strong>Fatigue</strong> Life Span<br />
Estimation <strong>of</strong> Overhead Contact Wire”, QR <strong>of</strong> RTRI, Vol. 51, No. 4, Nov. 2010.<br />
[4] L.M. Cléon, A. Bobillot, J.P. Mentel, E. Aziz: “OSCAR © : La caténaire en 3D”. In: Revue<br />
Générale des Chemins de Fer, Volume n° 155, November 2006.<br />
[5] S. Daouk, “Analyse en fatigue du fil de <strong>contact</strong> de la caténaire”, master report ENSTA/SNCF,<br />
2010<br />
[6] A. Bobillot, L.M. Cléon, A. Collina, O. Mohamed, R. Ghidorzi, “Pantograph-Catenary: a High-<br />
Speed European couple”. In: Proceedings <strong>of</strong> the World Congress on Railway Research, 2008.<br />
[7] J.P. Massat, “Modélisation du comportement dynamique du couple pantographe-caténaire.<br />
Application à la détection de défauts dans la caténaire”, doctoral thesis 2007.<br />
[8] J.P. Bianchi, E. Balmès, A. Bobillot, “Using modal damping <strong>for</strong> full model transient <strong>analysis</strong>.<br />
Application to pantograph/<strong>catenary</strong> vibration”, ISMA2010 Noise and Vibration Engineering<br />
conference 2010.<br />
[9] K. Dang Van and H. Maitournam, “<strong>Fatigue</strong> Polycyclique des Structures”, support de cours<br />
école polytechnique, Décembre 2008.<br />
[10] K. Dang Van and I. Papadoupoulos, Eds., “High-Cycle Metal <strong>Fatigue</strong> in the Context <strong>of</strong><br />
Mechanical Design”, CISM Courses and Lectures, No.392, Springer-Verglas, 1999.