art.9.potur 690-699 - farmacia
art.9.potur 690-699 - farmacia
art.9.potur 690-699 - farmacia

Create successful ePaper yourself
Turn your PDF publications into a flip-book with our unique Google optimized e-Paper software.
<strong>690</strong><br />
FARMACIA, 2011, Vol. 59, 5<br />
OPTIMIZATION BY EXPERIMENTAL DESIGN<br />
OF AN IMMEDIATE RELEASE TABLET<br />
FORMULATION COMPRISING METFORMIN<br />
AND GLIBENCLAMIDE<br />
POTUR ROXANA-GEORGIANA *1,2 , MOISUC LĂCRĂMIOARA 1 ,<br />
BOIŢĂ TUDOR 1 ; GAFIŢANU ELIZA 2 , POTUR MIRCEA-DAN 3<br />
1<br />
Pharmaceutical Development Department, Antibiotice S.A., Str. Valea<br />
Lupului nr. 1, 707410, Iaşi, Romania<br />
2<br />
Faculty of Pharmacy, University of Medicine and Pharmacy “Gr. T.<br />
Popa”, Str.Universitatii nr.16 700115 Iasi, Romania.<br />
3 Faculty of Automation and Computer Science, Technical University<br />
"Gheorghe Asachi" of Iasi, Str. Prof. Dr. Doc. Demetrius Mangeron,<br />
no. 27, cod 70005, Iasi, Romania<br />
* corresponding author: roxana.potur@yahoo.com<br />
Abstract<br />
The association of metformin and glibenclamide presents notable advantages<br />
with respect to the administration of the two active ingredients separately, because it<br />
significantly improves the compliance in older patients and in patients subjected to<br />
polytherapy with other drugs.<br />
The aim of this study consisted in developing a formulation of an immediate<br />
release tablet that contained 500 mg metformin and 2.5 mg glibenclamide and optimizing it<br />
in order to attain a similar dissolution profile to the innovator product (Glucovance ® ).<br />
The statistical method employed was Partial Least Squares multilinear<br />
regression, using Modde 9.0 Umetrics software. The tablets obtained according to the<br />
experimental plan were evaluated regarding the release of metformin hydrochloride and<br />
glibenclamide using validated HPLC methods.<br />
The results demonstrated that the optimal formulation corresponded to the<br />
specifications of the European Pharmacopoeia 6 th edition for immediate release coated<br />
tablets with a very similar dissolution profile to the innovator product (Glucovance ® ), f 2<br />
(similarity factor) showing values of 92.89 for the release of glibenclamide and of 90.98<br />
for the release of metformin.<br />
Rezumat<br />
Asocierea în terapie a metforminului cu glibenclamida prezintă avantaje notabile<br />
administrării separate a acestor doi agenţi antidiabetici, deoarece asigură îmbunătăţirea<br />
semnificativă a complianţei la pacienţii în vârstă şi la cei aflaţi sub tratament cu multiple<br />
medicamente.<br />
Scopul acestei cercetări constă în optimizarea formulării unor comprimate cu<br />
eliberare imediată ce conţin 500 mg metformin şi 2,5 mg glibenclamidă, în aşa fel încât să<br />
se obţină profile de eliberare ale substanţelor active similare cu cele corespunzătoare<br />
medicamentului inovator.
FARMACIA, 2011, Vol. 59, 5 691<br />
Metoda statistică de prelucrare a datelor a constat în regresia multilinară multiplă<br />
(Partial Least Squares), iar implementarea acesteia s-a realizat cu ajutorul softului Modde<br />
9.0 Umetrics Suedia.<br />
Rezultatele studiului s-au concretizat într-o formulă optimă ce corespunde<br />
criteriilor impuse de Farmacopeea Europeană editia a 6-a şi care prezintă o similaritate<br />
foarte bună cu medicamentul inovator (Glucovance ® ), în ceea ce priveşte profilele de<br />
eliberare in vitro pentru cei doi agenţi terapeutici.<br />
Keywords: metformin, glibenclamide, experimental design, tablets, dissolution<br />
profile<br />
Introduction<br />
The combined sulphonylureas and biguanides treatment assumes an<br />
important role in the therapy of type II diabetes, in that it allows an<br />
improved metabolic control in those patients in which biguanides or<br />
sulphonylureas alone have proved to be ineffective in time. Amongst the<br />
two categories of mentioned drugs, the most used for the treatment of type<br />
II diabetes are metformin and glibenclamide [5].<br />
The association of metformin and glibenclamide presents notable<br />
advantages with respect to the administration of the two active ingredients<br />
separately, since it significantly improves the compliance and, in addition, it<br />
reduces the risk of error in administration especially in older patients and in<br />
patients subjected to polytherapy with other drugs [4, 6]. The aim of this<br />
study consists in developing a formulation of an immediate release tablet<br />
that contains 500 mg metformin and 2.5 mg glibenclamide and optimizing it<br />
in order to attain a similar dissolution profile to the innovator product<br />
(Glucovance ® that contains 500mg metformin and 2.5mg glibenclamide).<br />
Whether it is to understand or to interpret a phenomenon as in a<br />
factor study, or to predict results under different conditions by response<br />
surface modelling, a mathematical model that is close enough in its<br />
behaviour to that of the real system is required. The models to use are<br />
polynomials of coded (normalised) variables, representing factors that are<br />
all transformed to the same scale and with constant coefficients. It is the<br />
unknown value of each coefficient that must be estimated with the best<br />
possible precision by experiments whose position in the experimental factor<br />
space is chosen according to the form of the mathematical model postulated.<br />
For this to be possible, the number of distinct experiments must be at least<br />
equal to the number of coefficients in the model. Calculating estimations of<br />
the coefficients cannot be performed manually. The method of Partial Least<br />
Squares multilinear regression employed during our study involves the use<br />
of a computer program [3].<br />
The experiments were carried out to determine the relationship (in<br />
the form of a mathematical model) among the formulation factors acting in
692<br />
FARMACIA, 2011, Vol. 59, 5<br />
the system and the response or properties of the same system (the system<br />
being the pharmaceutical product) [2].<br />
Materials and methods<br />
Materials<br />
Table I<br />
API’s (active pharmaceutical ingredients) and excipients used in<br />
formulation development<br />
Active ingredients and excipients<br />
Metformin hydrochloride<br />
Glibenclamide micronized<br />
Glibenclamide non-micronized<br />
Microcrystalline cellulose (Vivapur ® Type 101)<br />
Granulated lactitol monohydrate<br />
Croscarmellose sodium (Vivasol ® )<br />
Povidone (Plasdone ® S-630)<br />
Magnesium stearate (Kemilub ® EM-F-V)<br />
Manufacturer<br />
Microsin Romania<br />
USV India<br />
Cadila India<br />
JRS Pharma Germany<br />
Purac Biochem Holland<br />
JRS Pharma Germany<br />
ISP, Switzerland<br />
UNDESA, Spain<br />
Methods<br />
The starting formulation (Table II) has two general quantitative<br />
compositions depending on the average weight of the tablet : 600 mg or 620<br />
mg.<br />
Table II<br />
The general qualitative and quantitative composition for the starting formulation<br />
Starting<br />
formulation<br />
Metformin<br />
hydrochloride<br />
Glibenclamide<br />
micronized/ nonmicronized<br />
Povidone<br />
(intragranular)<br />
Microcrystalline<br />
cellulose /<br />
Lactitol<br />
monohiyrate<br />
Povidone<br />
(extragranular)<br />
Croscarmellose<br />
sodium<br />
Magnesium<br />
stearate<br />
Sum<br />
Var. I % 83.333 0.4166 3 5.45-10.45 0-3 2-4 0.8 100<br />
Var. II 80.645 0.4032 3 8.15-13.15 0-3 2-4 0.8 100<br />
Var. I mg/ 500 2.5 18 32.7-62.7 0-18 12-54 4.8 600<br />
Var. II tablet 500 2.5 18.6 50.536-81.536 0-18.6 4.8 4.96 620<br />
Micronized/non-micronized glibenclamide was geometrically<br />
dispersed into the granules of metformin comprising drug substance and<br />
Plasdone ® S-630. The granulation was performed using a two sigma arms<br />
homogenizer-granulator.<br />
The filler (Vivapur 101 ® /LactyTab ® ), the desintegrant (Vivasol ® )<br />
and the rest of the binder (Plasdone ® S-630) were added to the resulted mix.<br />
The homogenization of the active ingredients with the excipients took place<br />
into a V–type mixer at 15 rpm, for 10 minutes. The formulations were<br />
lubricated with 0.8% magnesium stearate. The final compositions were
FARMACIA, 2011, Vol. 59, 5 693<br />
compressed on an instrumented rotary press with a medium tabletting force.<br />
Biconvex round shape tablet tooling with 12.0± 0.5 mm diameter was used.<br />
Tablet (manufactured according to the experimental plan) physical<br />
properties were measured on 20 tablets for friability (Electrolab EF-2<br />
fraibilator), 10 tablets for hardness (Logan HDT 300 Hard.tester) and on 6<br />
tablets for disintegration (Erweka ZT 42). The tablets were evaluated for the<br />
release of metformin hydrochloride and glibenclamide using validated<br />
HPLC methods. Tablets dissolution was tested on: USP apparatus II paddles<br />
Electrolab TDT-08L (100 rpm). The dissolution medium consisted of 900<br />
mL of pH 7.4 phosphate buffer solution and polysorbate 80 0.03%, at a<br />
temperature of 37±0.5°C. The similarity factor (f 2 ) was calculated for the<br />
dissolution profiles in order to assure comparative evaluation with the<br />
innovator product Glucovance ® . After the identification of the optimal<br />
formulation for the tablets, we procedeed with the coating of the cores using<br />
a hydroxipropyl methyl cellulose (HPMC) film. The coating process was<br />
performed on O’Hara LabCoat drum and it resulted in a tablet weight gain<br />
of 4 %.<br />
The experimental plan was generated by using Modde 9.0 Umetrics<br />
software through the variation of five formulation factors (independent<br />
variables) on two levels. The independent variables (formulation factors)<br />
(Table III) were the following: filler (Microcrystalline cellulose / Lactitol<br />
monohydrate) – qualitative variable, desintegrant (2% / 4%) – quantitative<br />
multilevel variable, tablet average weight (600 mg / 620 mg) – quantitative<br />
multilevel variable, extragranulary added binder (0% / 3%) – quantitative<br />
multilevel variable, glibenclamide particle size (micronized / nonmicronized<br />
powder) –qualitative variable.<br />
Table III<br />
Independent variables and their levels of variation<br />
Independent variables Abbreviation Units Type Levels of variation<br />
Filler Fill - Qualitative<br />
Microcrystalline cellulose /<br />
Lactitol monohydrate<br />
Desintegrant Dis % Multilevel 2/4<br />
Tablet average weight Mass mg Multilevel 600/620<br />
Extragranulary added binder BindE % Multilevel 0/3<br />
Glibenclamide particle size GlibPS Qualitative<br />
Micronized / non-micronized<br />
powder<br />
The non-independent variables (quality attributes) (Table IV)<br />
were the following: friability (variation limits: 0-1 %), hardness (variation<br />
limits: 50-120 N), desintegration time (variation limits: 0-240 sec),<br />
dissolution profile similarity factor f 2 for the two API’s (variation limis: 30-<br />
100%, target value: 60 %) (F2G, F2M).
694<br />
FARMACIA, 2011, Vol. 59, 5<br />
Exp.<br />
No.<br />
Table IV<br />
Non-Independent variables and their admisibility limits<br />
Values<br />
Non-Independent variables Abbreviation Units Type<br />
Min. Target Max.<br />
Friability Fria % Regular 0 - 0.1<br />
Hardness Hard N Regular 50 - 120<br />
Desintegration time Dis sec Regular 0 - 240<br />
Dissolution profile similarity factor<br />
f 2 (glibenclamide)<br />
F2G % Regular 30 60 100<br />
(F2G)<br />
Dissolution profile similarity factor<br />
f 2 (metformin)<br />
(F2M)<br />
F2M % Regular 30 60 100<br />
The generated experimental plan contained 36 trials - core<br />
formulations, that were tested for their essential quality attributes: friabiliy,<br />
hardness, desintegration time and similarity of dissolution profile when<br />
compared with the innovator product (Table V).<br />
Results and discussion<br />
The reproductibility of the model was of at least 81.05 % for all the<br />
non-independent variables investigated.<br />
Table V<br />
Factorial Design for the Quality Profile of the Uncoated Tablets<br />
Exp.<br />
Name<br />
Run<br />
Order<br />
Fill Dis Mass BindE GlibPS Fria Hard Dis F2G F2M<br />
1 N1 18 MCC 101 2 600 0 Micronized 0.42 107 116 42.7 52.2<br />
2 N2 25 Lactitol 2 600 0 Micronized 0.72 75 100 46.3 54.3<br />
3 N3 5 MCC 101 4 600 0 Micronized 0.48 98 56 47.13 57.2<br />
4 N4 22 Lactitol 4 600 0 Micronized 0.89 65 43 56.2 63.5<br />
5 N5 15 MCC 101 2 620 0 Micronized 0.72 99 176 40.5 50.2<br />
6 N6 12 Lactitol 2 620 0 Micronized 0.92 72 156 44.5 52.3<br />
7 N7 32 MCC 101 4 620 0 Micronized 0.8 97 122 43 55.7<br />
8 N8 6 Lactitol 4 620 0 Micronized 0.98 69 102 52.2 61.7<br />
9 N9 3 MCC 101 2 600 3 Micronized 0.38 110 113 57.2 63.1<br />
10 N10 35 Lactitol 2 600 3 Micronized 0.67 82 97 58.1 62.2<br />
11 N11 4 MCC 101 4 600 3 Micronized 0.41 102 54 60.11 60.21<br />
12 N12 29 Lactitol 4 600 3 Micronized 0.75 70 40 71.2 62.3<br />
13 N13 13 MCC 101 2 620 3 Micronized 0.62 101 172 52.5 58.2<br />
14 N14 19 Lactitol 2 620 3 Micronized 0.86 80 150 57.5 61.3<br />
15 N15 10 MCC 101 4 620 3 Micronized 0.71 100 116 55 63.2<br />
16 N16 17 Lactitol 4 620 3 Micronized 0.91 73 96 65.3 65.3<br />
17 N17 23 MCC 101 2 600 0 Non-Micronized 0.4 103 117 38.6 50.2
FARMACIA, 2011, Vol. 59, 5 695<br />
Exp.<br />
No.<br />
Exp.<br />
Name<br />
Run<br />
Order<br />
Table V (continued)<br />
Fill Dis Mass BindE GlibPS Fria Hard Dis F2G F2M<br />
18 N18 26 Lactitol 2 600 0 Non-Micronized 0.73 78 97 41.3 52.7<br />
19 N19 14 MCC 101 4 600 0 Non-Micronized 0.52 97 57 42.5 54.3<br />
20 N20 24 Lactitol 4 600 0 Non-Micronized 0.85 67 45 52.3 60.5<br />
21 N21 33 MCC 101 2 620 0 Non-Micronized 0.78 100 188 48.9 51.2<br />
22 N22 20 Lactitol 2 620 0 Non-Micronized 0.9 76 162 51.6 56.7<br />
23 N23 27 MCC 101 4 620 0 Non-Micronized 0.82 96 127 52.7 63.5<br />
24 N24 34 Lactitol 4 620 0 Non-Micronized 0.97 70 107 63.5 67.8<br />
25 N25 9 MCC 101 2 600 3 Non-Micronized 0.37 109 114 54.2 63.2<br />
26 N26 11 Lactitol 2 600 3 Non-Micronized 0.65 86 93 56.1 65.25<br />
27 N27 30 MCC 101 4 600 3 Non-Micronized 0.45 103 58 58.13 60.25<br />
28 N28 8 Lactitol 4 600 3 Non-Micronized 0.76 71 41 62.3 68.5<br />
29 N29 31 MCC 101 2 620 3 Non-Micronized 0.65 104 179 53.2 55.5<br />
30 N30 16 Lactitol 2 620 3 Non-Micronized 0.83 85 159 65.3 67.3<br />
31 N31 1 MCC 101 4 620 3 Non-Micronized 0.78 101 120 69.3 68.2<br />
32 N32 21 Lactitol 4 620 3 Non-Micronized 0.92 83 99 70.1 69.7<br />
33 N33 28 MCC 101 2 600 0 Micronized 0.41 106 112 40.5 50.3<br />
34 N34 2 MCC 101 2 600 0 Micronized 0.42 107 116 52.6 52<br />
35 N35 7 MCC 101 2 600 0 Micronized 0.44 109 122 45.1 58.3<br />
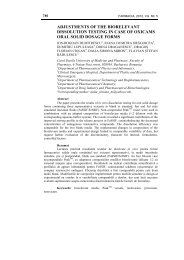
After performing data fitting the optimal formulation was identified<br />
using Contour Plot diagrams generated by Modde 9.0 (figure 1). The<br />
influence of the formulation factors on the quality profile of the uncoated<br />
tablets was tested.<br />
Figure 1<br />
Contour Plot diagram for prototype formulation 1
696<br />
FARMACIA, 2011, Vol. 59, 5<br />
Table VI<br />
Quality profile for the optimal formulation (uncoated tablets)<br />
Quality attribute<br />
Admisibility limits<br />
Friability, % max 0.5<br />
Hardness, N min 100<br />
Desintegration time, sec max 80<br />
F2 G 60<br />
F2 M 60<br />
Having as starting point the general formulation, by varying the<br />
formulation factors on two levels, the statistical program generated 8<br />
prototype formulations (Table VII).<br />
Table VII<br />
Prototype formulations (uncoated tablets) generated in the statistical investigation<br />
Prototype formulation 1 2 3 4 5 6 7 8<br />
Microcrystalline cellulose + + + + - - - -<br />
Lactitol monohiyrate - - - - + + + +<br />
Povidone (extragranular) + - + - + - + -<br />
Glibenclamide micronized + + - - + + - -<br />
Glibenclamide non-micronized - - + + - - + +<br />
From these 8 prototype formulations, only 1 and 3 met all the<br />
requirements specified by the quality profile.<br />
Table VIII<br />
Quality attributes for the optimal formulations (uncoated tablets)<br />
Prototype<br />
formulation<br />
Friability<br />
(%)<br />
Hardness<br />
(N)<br />
Disintegration<br />
time (sec)<br />
F2G (%)<br />
F2M(%)<br />
Optimal<br />
formulation<br />
1<br />
3<br />
Admisibility<br />
Meets the<br />
max 0.5 min 100 max 80 60 60<br />
limits<br />
requirements<br />
Tablet average<br />
weight<br />
600-606 600-620 600-604 600-602 600-614 600-604<br />
Desintegrant 2-4 2-4 3.6-4 3.8-4 2.6-4 3.8-4<br />
Admisibility<br />
Meets the<br />
max 0.5 min 100 max 80 60 60<br />
limits<br />
requirements<br />
Tablet average<br />
weight<br />
600-606 600-620 600-603 600-603 600-608 600-603<br />
Desintegrant 2-4 2-4 3-3.7 3.6-4 3.4-4 3.6-3.7<br />
The interpretation of the Contour plot diagrams generated for each<br />
prototype formulation resulted in two optimal formulations (Table IX).
FARMACIA, 2011, Vol. 59, 5 697<br />
Table IX<br />
Quantitative and qualitative composition for the two optimal formulations that<br />
corresponded to the quality profile<br />
Optimal formulation 1 Optimal formulation 2<br />
(%) (mg) (%) (mg)<br />
Metformin hydrochloride 83.333 500.0 83.333 500.0<br />
Glibenclamide micronized 0.417 2.5 - -<br />
Glibenclamide non-micronized - - 0.417 2.5<br />
Povidone (intragranular) 3.000 18.0 3.000 18.0<br />
Microcrystalline cellulose 5.450 32.7 5.660 34.5<br />
Povidone (extragranular) 3.000 18.0 3.000 18.0<br />
Croscarmellose sodium 4.000 24.0 3.700 22.2<br />
Magnesium stearate 0.800 4.8 0.800 4.8<br />
Purified water*<br />
Sum 100.000 600.0 100.000 600.0<br />
* used for the granulation of metformin hydrochloride<br />
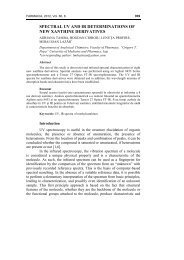
The results for the in vitro release of metformin hydrochloride and<br />
glibenclamide from the coated tablets are presented in Tables X and XI.<br />
Table X<br />
Percentages of metformin dissolved at four sampling times<br />
(coated tablets)<br />
Table XI<br />
Percentages of glibenclamide dissolved at four sampling times<br />
(coated tablets)
698<br />
FARMACIA, 2011, Vol. 59, 5<br />
The dissolution profiles corresponding to the two active principles<br />
for Optimal formulation 1 and 2 and for Glucovance® are depicted in figure<br />
2 and figure 3.<br />
100<br />
90<br />
% metformin hydrochloride released<br />
80<br />
70<br />
60<br />
50<br />
40<br />
30<br />
20<br />
10<br />
Optimal formulation # 1<br />
Optimal formulation # 2<br />
Glucovance®<br />
0<br />
0 15 30 45 60<br />
Time (minutes)<br />
Figure 2<br />
Metformin hydrochloride dissolution profile for Optimal formulation 1, 2 and<br />
Glucovance ®<br />
100<br />
90<br />
80<br />
% glibenclamide release<br />
70<br />
60<br />
50<br />
40<br />
30<br />
20<br />
10<br />
Optimal formulation # 1<br />
Optimal formulation # 2<br />
Glucovance®<br />
0<br />
0 15 30 45 60<br />
Time (minutes)<br />
Figure 3<br />
Glibenclamide dissolution profile for Optimal formulation 1, 2 and Glucovance ®
FARMACIA, 2011, Vol. 59, 5 <strong>699</strong><br />
Conclusions<br />
The results from the dissolution tests demonstrated that the two<br />
optimal formulations corresponded to the specifications of the European<br />
Pharmacopoeia 6th edition for immediate release coated tablets [1]. The<br />
dissolution profile of the optimal formulation 1 is very similar to the<br />
innovator product (Glucovance ® ), f 2 showing values of F2G = 92.89 and<br />
F2M = 90.98.<br />
The optimal formulation 2 presented lower values for the similarity<br />
factor corresponding to the two active principles: F2G = 65.42 and F2M =<br />
51.46.<br />
The pharmacotechnical attributes of the two optimal formulations<br />
(friability, hardness, dissolution time and dissolution profile similarity)<br />
coresponded to the target quality profile instituted for the final dosage form<br />
– uncoated tablets.<br />
References<br />
1. *** European Pharmacopoeia 6.0, European Directorate for the Quality of Medicines -<br />
Council of Europe (COE), January 2008.<br />
2. ***Overview: The Scope of Experimental Design. In: Gareth A., Didier M, Roger P.<br />
Pharmaceutical Experimental Design, New York, Basel: Marcel Dekker, 1999, 2.<br />
3. ***Statistical and Mathematical Tools Introduction to Multi-Linear Regression and<br />
Analysis of Variance. In: Gareth A., Didier M, Roger P. Pharmaceutical Experimental<br />
Design, New York, Basel: Marcel Dekker, 1999, 146.<br />
4. Gidwani S., Sharshikant P. Solid Oral Dosage Form of Metformin and Glyburide and the<br />
Method of Preparation Thereof, United States Patent Application Publication, 2004, US<br />
2004/0175421 A1, 1.<br />
5. Tosetti A., Guiducci M., Viti G. Pharmaceutical Compositions Comprising Metformin and<br />
Glibenclamide for the Treatment of Type II Diabetes Mellitus, United States Patent<br />
Application Publication, 2005, US2005/0053661 A1, 1-2.<br />
6. Cristina Georgiţă, Iulia Sora, Florin Albu, Crina Maria Monciu, Comparison of a LC/MS<br />
method with a LC/UV method for the determination of metformin in plasma samples,<br />
Farmacia, 2010, 58(2), 158-169.<br />
__________________________________<br />
Manuscript received: April 14 th 2010