art.17.tamba 939-946 - farmacia
art.17.tamba 939-946 - farmacia
art.17.tamba 939-946 - farmacia

You also want an ePaper? Increase the reach of your titles
YUMPU automatically turns print PDFs into web optimized ePapers that Google loves.
FARMACIA, 2012, Vol. 60, 6 <strong>939</strong><br />
SPECTRAL UV AND IR DETERMINATIONS OF<br />
NEW XANTHINE DERIVATIVES<br />
ADRIANA TAMBA, BOGDAN CIOROIU, LENUŢA PROFIRE,<br />
MIHAI IOAN LAZĂR *<br />
Department of Analytical Chimistry, Faculty of Pharmacy, “Grigore T.<br />
Popa” University of Medicine and Pharmacy, Iaşi<br />
*corresponding author: lmihaiioan@yahoo.com<br />
Abstract<br />
The aim of this study is ultraviolet and infrared spectral characterization of eight<br />
new xanthine derivatives. Spectral analysis was performed using an Agilent 8453 Series<br />
spectrophotometer and a Tensor 27 Optics FT-IR spectrophotometer. The UV and IR<br />
spectra for xanthine derivatives were obtained and in addition, the wavelength maxima of<br />
absorption bands and characteristics have been established.<br />
Rezumat<br />
Scopul acestei lucrări este caracterizarea spectrală în ultraviolet şi infraroşu a 8<br />
noi derivaţi xantinici. Analiza spectrofotometrică s-a realizat folosind un spectrofotometru<br />
Agilent seria 8453 şi un spectrofotometru Tensor 27 Opitcs FT-IR. S-au trasat curbele de<br />
absorbţie în UV şi IR pentru cei 8 derivaţi xantinici, stabilind maximele lungimilor de undă<br />
şi caracteristicile benzilor de absorbţie.<br />
Keywords: UV, IR spectra of methylxanthines<br />
Introduction<br />
UV spectroscopy is useful in the structure elucidation of organic<br />
molecules, the presence or absence of unsaturation, the presence of<br />
heteroatoms. From the location of peaks and combination of peaks, it can be<br />
concluded whether the compound is saturated or unsaturated, if heteroatoms<br />
are present or not [1,6].<br />
In the infrared spectroscopy, the vibration spectrum of a molecule<br />
is considered a unique physical property and is a characteristic of the<br />
molecule. As such, the infrared spectrum can be used as a fingerprint for<br />
identification by the comparison of the spectrum from an “unknown” with<br />
previously recorded reference spectra. This is the basis of computer-based<br />
spectral searching. In the absence of a suitable reference data, it is possible<br />
to perform a elementary interpretation of the spectrum from basic principles,<br />
leading to characterization, and possibly even identification of an unknown<br />
sample. This first principle approach is based on the fact that structural<br />
features of the molecule, whether they are the backbone of the molecule or<br />
the functional groups attached to the molecule, produce characteristic and
940<br />
FARMACIA, 2012, Vol. 60, 6<br />
reproducible absorptions in the spectrum. This information can indicate the<br />
backbone of the structure and whether the backbone consists of linear or<br />
branched chains. Furthermore, it is possible to determine if there are<br />
multiple bonds and/or aromatic rings in the structure. Finally, it is possible<br />
to deduce whether specific functional groups are present. If detected, one is<br />
also able to determine the local orientation of the group and its local<br />
environment and/or location in the structure.<br />
The qualitative aspects of infrared spectroscopy are one of the most<br />
powerful attributes of this various and versatile analytical technique. Over<br />
the years, many studies have been published in terms of the fundamental<br />
absorption frequencies (also known as group frequencies) which are the key<br />
to unlocking the structure–spectral relationships of the associated molecular<br />
vibrations [3,7].<br />
The infrared spectrum can provide information on the existence of<br />
most of the linear, branched or cyclic hydrocarbon structures, either directly<br />
or by inference. The introduction of unsaturation in the form of a double or<br />
triple bond has a profound impact on the chemistry of the molecule, and<br />
likewise it has a significant influence on the infrared spectrum. Similarly,<br />
the same is observed when an aromatic structure is present within a<br />
molecule [1].<br />
In this article, we present the IR spectral interpretation compared with UV-<br />
VIS molecular spectra of different xanthine compounds.<br />
Materials and Methods<br />
Chemicals and reagents<br />
Eight new different xanthine derivatives were used (Table I), HPLC<br />
grade methanol supplied by Merck KGaA was used for sample dissolution<br />
and appropriate dilution. Potassium bromide of spectroscopic purity was<br />
supplied by Merck KGaA, Germany.<br />
Instrument<br />
IR analyses were performed using a Tensor 27 Opitcs FT-IR<br />
spectrophotometer from Bruker, Germany, with a spectral range 7500-<br />
370cm -1 , using KBr beam splitter, resolution
FARMACIA, 2012, Vol. 60, 6 941<br />
Specac UK provided the tablet press used for sample preparation.<br />
UV-Vis spectra were recorded on an Agilent 8453 Series spectrophotometer<br />
with a spectral range of 190-1100nm, wavelength accuracy ±0.5nm,<br />
wavelength reproductibility – min ±0.02nm and a resolution of minimum<br />
1.6.<br />
Table I<br />
Chemical structure of analyzed compounds<br />
O<br />
N<br />
N<br />
N<br />
O<br />
N<br />
N<br />
CH 3<br />
N<br />
O<br />
N<br />
N<br />
CH 3<br />
N<br />
P1<br />
O<br />
H 2 C<br />
CH 3<br />
O<br />
N<br />
CH<br />
CH 2<br />
O<br />
HO<br />
NH<br />
P2<br />
O<br />
H 2 C<br />
N<br />
CH<br />
CH 2<br />
O<br />
HO<br />
Br<br />
NH<br />
O<br />
P3<br />
O<br />
H 2 C<br />
N<br />
CH<br />
CH 2<br />
O<br />
HO<br />
NO 2<br />
NH<br />
O<br />
N-{4-[3-(1,3-dimethyl-2,6-dioxo-<br />
1,2,3,6-tetrahydro-7H-purin-7-yl)-<br />
2-<br />
hydroxypropoxy]phenyl}acetamide<br />
N-{4-[3-(8-bromo-1,3-dimethyl-<br />
2,6-dioxo-1,2,3,6-tetrahydro-7H-<br />
purin-7-yl)-2-<br />
hydroxypropoxy]phenyl}acetamide<br />
N-{4-[3-(8-nitro-1,3-dimethyl-2,6-<br />
dioxo-1,2,3,6-tetrahydro-7H-purin-<br />
7-yl)-2-<br />
hydroxypropoxy]phenyl}acetamide<br />
O<br />
N<br />
N<br />
CH 3<br />
N<br />
O<br />
N<br />
N<br />
CH 3<br />
N<br />
O<br />
N<br />
N<br />
CH 3<br />
N<br />
P4<br />
O<br />
C H 2<br />
N<br />
CH<br />
CH 2<br />
O<br />
HO<br />
N<br />
N<br />
NH<br />
O<br />
P5<br />
O<br />
C H 2<br />
N<br />
CH<br />
CH 2<br />
O<br />
HO<br />
N<br />
NH<br />
O<br />
P6<br />
O<br />
C H 2<br />
N<br />
CH<br />
CH 2<br />
O<br />
HO<br />
N<br />
O<br />
NH<br />
O<br />
O<br />
N<br />
O<br />
N<br />
C H 2<br />
CH 3<br />
N<br />
HO<br />
N<br />
N<br />
N<br />
O<br />
CH<br />
CH 3<br />
CH 2<br />
O<br />
P7<br />
N-{4-[3-(8-5-methyl-2,4-dihydro-3H-pyrazol-3-one-<br />
1,3-dimethyl-2,6-dioxo-1,2,3,6-tetrahydro-7H-purin-7-<br />
yl)-2-hydroxypropoxy]phenyl}acetamide<br />
NH<br />
O<br />
O<br />
N<br />
O<br />
N<br />
C H 2<br />
CH 3<br />
N<br />
HO<br />
N<br />
N<br />
N<br />
CH<br />
CH 2<br />
O<br />
N-{4-[3-(8- 1H-imidazole-1,3-<br />
dimethyl-2,6-dioxo-1,2,3,6-<br />
tetrahydro-7H-purin-7-yl)-2-<br />
hydroxypropoxy]phenyl}acetamide<br />
N-{4-[3-(8-piperidin-1,3-dimethyl-<br />
2,6-dioxo-1,2,3,6-tetrahydro-7H-<br />
purin-7-yl)-2-<br />
hydroxypropoxy]phenyl}acetamide<br />
N-{4-[3-(8-morfolin-1,3-dimethyl-<br />
2,6-dioxo-1,2,3,6-tetrahydro-7H-<br />
purin-7-yl)-2-<br />
hydroxypropoxy]phenyl}acetamide<br />
P8<br />
N-{4-[3-(8-3,5-dimethyl-4,5-dihydro-1H-pyrazole-1,3-<br />
dimethyl-2,6-dioxo-1,2,3,6-tetrahydro-7H-purin-7-yl)-<br />
2-hydroxypropoxy]phenyl}acetamide<br />
Samples preparation<br />
For UV-VIS determinations, about 2 mg of each component were<br />
individually dissolved in HPLC grade methanol and diluted to 10mL.<br />
Ultrasonication was used for complete dissolution. Methanol was also used<br />
as blank solution.<br />
NH<br />
O
942<br />
FARMACIA, 2012, Vol. 60, 6<br />
For the IR analysis, samples were prepared according to European<br />
Pharmacopoeia 7 th edition [2]. Approximate 2mg of each component was<br />
triturated with 300-400mg potassium bromide.<br />
The obtained tablets were subjected to Fourier Transformed Infrared<br />
(FTIR) measurements. Recorded spectra were further processed to eliminate<br />
differences between the amplitudes of the baselines and to achieve<br />
normalization with respect to differences between the minimum and<br />
maximum of absorption.<br />
Results and Discussion<br />
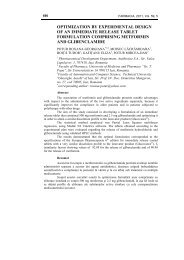
The UV spectra of the new xanthine compounds are shown in figure 1.<br />
2<br />
P1<br />
P2<br />
P3<br />
2<br />
2<br />
Absorbance (AU)<br />
Absorbance (AU)<br />
Absorbance (AU)<br />
0<br />
0<br />
0<br />
200 250 300 350<br />
175 200 225 250 275 300 325 350<br />
175 200 225 250 275 300 325 350<br />
2<br />
Wavelength (nm)<br />
Wavelength (nm)<br />
2<br />
Wavelength (nm)<br />
P4<br />
2 P5<br />
P6<br />
Absorbance (AU)<br />
Absorbance (AU)<br />
Absorbance (AU)<br />
0<br />
175 200 225 250 275 300 325 350<br />
Wavelength (nm)<br />
0<br />
175 200 225 250 275 300 325 350<br />
Wavelength (nm)<br />
0<br />
175 200 225 250 275 300 325 350<br />
Wavelength (nm)<br />
4<br />
4<br />
P7<br />
P8<br />
Absorbance (AU)<br />
2<br />
Absorbance (AU)<br />
2<br />
0<br />
175 200 225 250 275 300 325 350<br />
Wavelength (nm)<br />
0<br />
175 200 225 250 275 300 325 350<br />
Wavelength (nm)<br />
Figure 1<br />
UV-VIS spectra recorded on P1-P8 samples<br />
Sample P1 is the parent compound and displays an intense band at<br />
209 nm and a broad adsorption band at 253 nm, followed by a weak<br />
shoulder centered at 275 nm. The absorption band at 275 nm is typical for<br />
the chromophore found in most xanthine compounds (like caffeine,<br />
pentoxifylline, diprophylline, etofylline, theobromine, theophylline). The<br />
other chromophore in this molecule has a maximum at 253 nm, and is a<br />
anilide-type chromophore [3].<br />
Bromide compounds show absorption maximum in UV spectrum at<br />
210 nm. Thus, no significant modifications of the UV spectrum are
FARMACIA, 2012, Vol. 60, 6 943<br />
observed for sample P2. Still, small differences are observed with respect to<br />
the intensity of the bands. Specifically, the absorption band at 253 nm is less<br />
intense for sample P2, while the band at 275 nm suffers a bathochromic<br />
effect to 279 nm.<br />
The nitro chromophore group, present in the sample P3, should give<br />
an intense absorption band at 210 nm. In the case of compound P3, this<br />
overlaps with the band present at 209 nm in the parent molecule. The<br />
bathochromic shift is observed also in this sample (255 nm, 278 nm<br />
respectively), probably due to the presence of –NO 2 functional group.<br />
The UV spectra recorded on compound P4 resemblances with the<br />
one recorded for the parent compound. However, a hypsochromic shift is<br />
observed for the first two absorption bands (shift to 206 nm, respectively to<br />
247 nm), while the last absorption band shifts to 278 nm.<br />
Compound P5 shows an UV spectrum resembling with the ones<br />
recorded for compounds P7 and P8. Two absorption bands are observed for<br />
these samples at 206 nm and 210 nm, one band at 250 nm and one at 278<br />
nm characteristic to xanthine compounds.<br />
Sample P6 shows a different UV spectrum with two distinct<br />
absorption maximums at 220 nm, respectively 296 nm. The adsorption band<br />
centered at 220 nm has been previously found in morpholine. On the other<br />
hand, the UV absorption maximum at 275 nm in the parent molecule suffers<br />
a bathochromic shift (to 296 nm) that could be determined by the presence<br />
of morpholine-like chromophore group.<br />
IR identification<br />
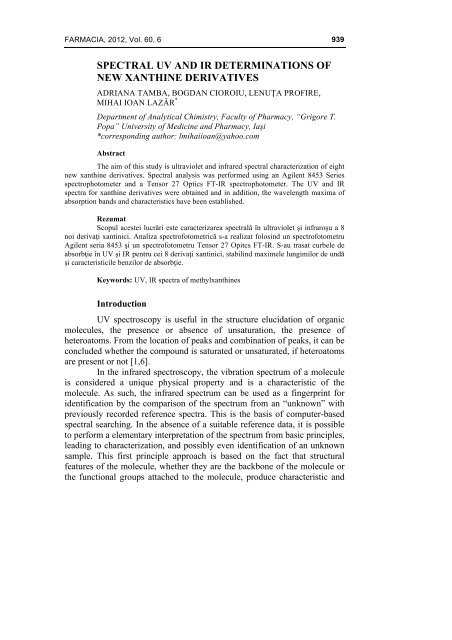
The IR spectra of the new xanthine compounds are shown in figure 2.<br />
Figure 2<br />
IR spectra recorded for the xanthine-compounds
944<br />
FARMACIA, 2012, Vol. 60, 6<br />
Generally, in the fingerprint region (1750-650cm -1 ), each spectrum<br />
of the 8 samples show absorption bands characteristic to the parent molecule<br />
represented by compound P1. All compounds display adsorption bands at<br />
1470-1430cm -1 and at 2960cm -1 characteristic to asymmetric C – H stretch<br />
of methyl groups. Weak absorption bands at 1380-1370cm -1 and at 2925cm -<br />
1 , respectively 2875-2855cm -1 characteristic to symmetric C – H stretch of<br />
methylene groups are also observed for all compounds. Moreover,<br />
adsorption bands are observed for all compounds at 1450cm -1 and 1480cm -1 ,<br />
assigned to C – H bend of the methylene groups. On the other hand, bands<br />
characteristic to the aromatic ring stretch are obvious in the region 1615-<br />
1450cm -1 for all compounds, along with absorption bands in the region<br />
3130-3070cm -1 characteristic to aromatic C – H stretch.<br />
The adsorption bands observed for all samples in the IR region<br />
1700-1600cm -1 are characteristic to C = O stretching present in amide<br />
compounds. All samples display this type of functional group, thus all<br />
spectra show this absorption bands.<br />
The C – O stretch of the tertiary alcohol group is observed in all<br />
spectra by the presence of the adsorption band at 1170cm -1 , while the<br />
adsorption bands observed in the region 1410-1310cm -1 , prove the O – H<br />
bend of the same functional group. In addition, the etheric functional group<br />
is highlighted in all spectra by the presence of the adsorption bands in the<br />
region 1140-1070cm -1 .<br />
The difference of band intensities in the fingerprint region is due to<br />
the bending vibrations out-of-plane of sp 2 C atoms involved in the C – H<br />
bond. The broad band observed in all compounds, with the exception of<br />
sample P6, in the region 3200-3300cm -1 is usually assigned to polymeric O<br />
– H stretching.<br />
The presence of the Br atom in the molecule of the compound P2 does not<br />
give rise to any new bands that could be assigned to C – Br vibration. This<br />
is because this bond vibrates generally in a region that is too crowded by<br />
other important group frequencies (700-600cm -1 for aliphatic C – Br stretch<br />
or 1500-1000cm -1 for aromatic C – Br stretch).<br />
Regarding the spectrum recorded for the sample P3, a sharp<br />
absorption band is observed at 1181cm -1 , generally assigned to symmetric<br />
stretch of NO 2 group in organic nitrates [2]. Other NO 2 vibration<br />
characteristic bands are impossible to distinguish because their absorptions<br />
occur within the crowded and highly overlapping region of the spectrum,<br />
mainly between 1300 and 1350cm -1 .<br />
For sample P4, most of the characteristic bands appear in the<br />
fingerprint IR region. Specifically, sample P4 should display adsorption
FARMACIA, 2012, Vol. 60, 6 945<br />
bands characteristic to C = N bond stretch, which usually occur in the IR<br />
region 1655-1640cm -1 [5]. Since this vibration occur already for all<br />
compounds due to the presence of this imide in the parent molecule, no new<br />
absorption bands are observed in the IR spectrum recorded on sample P4.<br />
Still, a medium intensity absorption band is observed at 1256cm -1 . This<br />
band is generally assigned to C – N stretching vibration in amine<br />
compounds.<br />
The IR spectrum recorded on sample P6 displays a new absorption<br />
band at 1110cm -1 , typically attributed to O – C stretching present in oxygen<br />
compounds (other than carboxylic acids, esters, anhydrides, ketones), like<br />
morpholine. In addition, the IR bands observed in the region 3200-2800cm -1<br />
are characteristic to morpholine. Moreover this spectrum shows two weak<br />
absorption bands at 901cm -1 and 1220cm -1 , that have been previously<br />
attributed to epoxy or oxirane rings [4]. These bands are usually more<br />
characteristic in the Raman spectrum.<br />
Conclusions<br />
The the majority of the recorded spectra (excepting sample P6) show<br />
three absorption bands at 209, 253, 275nm. The intense band at 209nm most<br />
likely comes from the presence of the aliphatic chain in the molecule of all<br />
xanthine compounds.<br />
Taken individually, infrared spectra should display few differences,<br />
by the presence or absence of absorption bands characteristic to the<br />
functional groups. Also, in the high wave number region, a broad shoulder<br />
is observed for compounds P2, P5, P7 and P8 in the region 3550-3340cm -1<br />
which is attributed to monomeric O – H stretch of the hydroxyl group. This<br />
effect most likely appears due to the water adsorbed on the surface of the<br />
molecule, since no thermal treatment was applied to the samples before IR<br />
measurements subjecting.<br />
References<br />
1. Wartewiga S., Neubert R.H.H., Pharmaceutical applications of Mid-IR and Raman<br />
spectroscopy, Adv Drug Deliver Rev 2005;57(8):1144–1170.<br />
2. European Pharmacopoeia, 7 th edition, method 2.2.24.<br />
3. Dibern H.W., Müller R.M., Wirbitzki E., UV and IR spectra, pharmaceutical substances<br />
(UV and IR) and pharmaceutical and cosmetic excipients (IR). Aulendorf: Editio Canto<br />
Verlag, 2002.<br />
4. Coates J., Interpretation of infrared spectra, a practical approach. In: Meyers R.A.<br />
Encyclopedia of analytical chemistry. Chichester: John Wiley & Sons Ltd, 2000, 10815–<br />
10837.<br />
5. Asif M., Asthana C., 2,4-Di substituted-5-imino-1,3,4-thiadiazole derivatives: synthesis and<br />
biological evaluation of antiinflammatory activities. Int J Chem Tech Res 2009;1(4):1200–<br />
1205.
<strong>946</strong><br />
FARMACIA, 2012, Vol. 60, 6<br />
6. Lazar M.I., Lazar D., Corciova A., Spectroscopic UV-Vis, IR and chromatographic HPLC<br />
analysis of some synthesis cromanones with sulphur and nitrogen., Farmacia, 2008, LVI(4),<br />
428-432<br />
7. Rău G., Mogoşanu G.D., Stănciulescu C.E., Synthesis and characterization of some novel<br />
azoderivatives, Farmacia, 2009, 57(5), 648-658.<br />
__________________________________<br />
Manuscript received: December 12 th 2011