Additional information
Additional information
Additional information

Create successful ePaper yourself
Turn your PDF publications into a flip-book with our unique Google optimized e-Paper software.
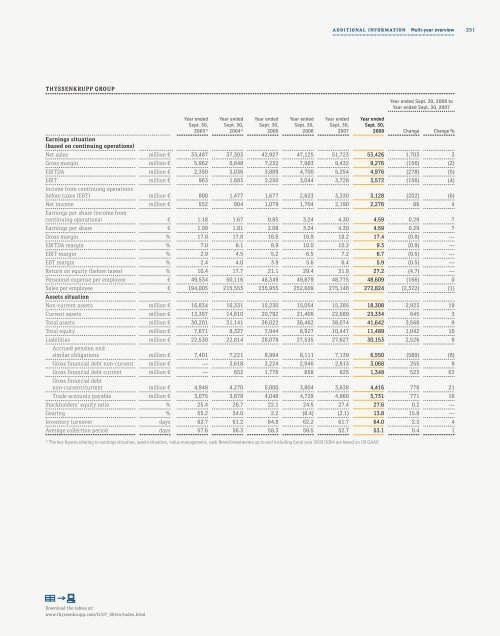
ThyssenKrupp Group<br />
earnings situation<br />
(based on continuing operations)<br />
Year ended<br />
Sept. 30,<br />
2003 1)<br />
Year ended<br />
Sept. 30,<br />
2004 1)<br />
Year ended<br />
Sept. 30,<br />
2005<br />
Year ended<br />
Sept. 30,<br />
2006<br />
AdditionAl informAtion Multi-year overview<br />
Year ended<br />
Sept. 30,<br />
2007<br />
Year ended Sept. 30, 2008 to<br />
Year ended Sept. 30, 2007<br />
Year ended<br />
Sept. 30,<br />
2008 Change Change %<br />
Net sales million € 33,487 37,303 42,927 47,125 51,723 53,426 1,703 3<br />
Gross margin million € 5,962 6,648 7,232 7,983 9,432 9,276 (156) (2)<br />
EBITDA million € 2,350 3,036 3,809 4,700 5,254 4,976 (278) (5)<br />
EBIT million € 963 1,683 2,250 3,044 3,728 3,572 (156) (4)<br />
Income from continuing operations<br />
before taxes (EBT) million € 800 1,477 1,677 2,623 3,330 3,128 (202) (6)<br />
Net income million € 552 904 1,079 1,704 2,190 2,276 86 4<br />
Earnings per share (income from<br />
continuing operations) € 1.18 1.67 0.85 3.24 4.30 4.59 0.29 7<br />
Earnings per share € 1.09 1.81 2.08 3.24 4.30 4.59 0.29 7<br />
Gross margin % 17.8 17.8 16.8 16.9 18.2 17.4 (0.8) —<br />
EBITDA margin % 7.0 8.1 8.9 10.0 10.2 9.3 (0.9) —<br />
EBIT margin % 2.9 4.5 5.2 6.5 7.2 6.7 (0.5) —<br />
EBT margin % 2.4 4.0 3.9 5.6 6.4 5.9 (0.5) —<br />
Return on equity (before taxes) % 10.4 17.7 21.1 29.4 31.9 27.2 (4.7) —<br />
Personnel expense per employee € 49,534 50,116 48,349 49,879 48,775 48,609 (166) 0<br />
Sales per employee € 194,005 215,553 235,955 252,609 275,146 272,824 (2,322) (1)<br />
Assets situation<br />
Non-current assets million € 16,834 16,331 15,230 15,054 15,385 18,308 2,923 19<br />
Current assets million € 13,367 14,810 20,792 21,408 22,689 23,334 645 3<br />
Total assets million € 30,201 31,141 36,022 36,462 38,074 41,642 3,568 9<br />
Total equity million € 7,671 8,327 7,944 8,927 10,447 11,489 1,042 10<br />
Liabilities million € 22,530 22,814 28,078 27,535 27,627 30,153 2,526 9<br />
Accrued pension and<br />
similar obligations million € 7,401 7,221 8,994 8,111 7,139 6,550 (589) (8)<br />
Gross financial debt non-current million € — 3,618 3,224 2,946 2,813 3,068 255 9<br />
Gross financial debt current million € — 652 1,776 858 825 1,348 523 63<br />
Gross financial debt<br />
non-current/current million € 4,948 4,270 5,000 3,804 3,638 4,416 778 21<br />
Trade accounts payable million € 3,075 3,678 4,048 4,729 4,960 5,731 771 16<br />
Stockholders’ equity ratio % 25.4 26.7 22.1 24.5 27.4 27.6 0.2 —<br />
Gearing % 55.2 34.0 2.2 (8.4) (2.1) 13.8 15.9 —<br />
Inventory turnover days 62.7 61.2 64.8 62.2 61.7 64.0 2.3 4<br />
Average collection period days 57.6 56.3 58.3 56.5 52.7 53.1 0.4 1<br />
1) The key figures relating to earnings situation, assets situation, value management, cash flows/investments up to and including fiscal year 2003/2004 are based on US GAAP.<br />
Download the tables at:<br />
www.thyssenkrupp.com/fr/07_08/en/index.html<br />
251