Automotive Power Generation and Control - IEEE Xplore
Automotive Power Generation and Control - IEEE Xplore
Automotive Power Generation and Control - IEEE Xplore

Create successful ePaper yourself
Turn your PDF publications into a flip-book with our unique Google optimized e-Paper software.
PERREAULT AND CALISKAN: AUTOMOTIVE POWER GENERATION AND CONTROL 625<br />
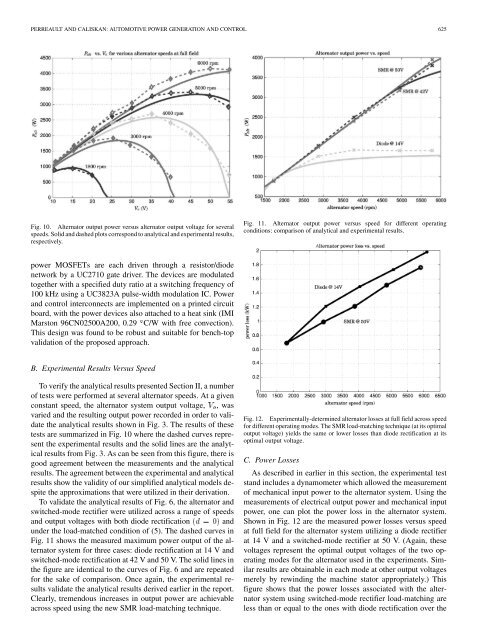
Fig. 10. Alternator output power versus alternator output voltage for several<br />
speeds. Solid <strong>and</strong> dashed plots correspond to analytical <strong>and</strong> experimental results,<br />
respectively.<br />
Fig. 11. Alternator output power versus speed for different operating<br />
conditions: comparison of analytical <strong>and</strong> experimental results.<br />
power MOSFETs are each driven through a resistor/diode<br />
network by a UC2710 gate driver. The devices are modulated<br />
together with a specified duty ratio at a switching frequency of<br />
100 kHz using a UC3823A pulse-width modulation IC. <strong>Power</strong><br />
<strong>and</strong> control interconnects are implemented on a printed circuit<br />
board, with the power devices also attached to a heat sink (IMI<br />
Marston 96CN02500A200, 0.29 C/W with free convection).<br />
This design was found to be robust <strong>and</strong> suitable for bench-top<br />
validation of the proposed approach.<br />
B. Experimental Results Versus Speed<br />
To verify the analytical results presented Section II, a number<br />
of tests were performed at several alternator speeds. At a given<br />
constant speed, the alternator system output voltage, ,was<br />
varied <strong>and</strong> the resulting output power recorded in order to validate<br />
the analytical results shown in Fig. 3. The results of these<br />
tests are summarized in Fig. 10 where the dashed curves represent<br />
the experimental results <strong>and</strong> the solid lines are the analytical<br />
results from Fig. 3. As can be seen from this figure, there is<br />
good agreement between the measurements <strong>and</strong> the analytical<br />
results. The agreement between the experimental <strong>and</strong> analytical<br />
results show the validity of our simplified analytical models despite<br />
the approximations that were utilized in their derivation.<br />
To validate the analytical results of Fig. 6, the alternator <strong>and</strong><br />
switched-mode rectifier were utilized across a range of speeds<br />
<strong>and</strong> output voltages with both diode rectification <strong>and</strong><br />
under the load-matched condition of (5). The dashed curves in<br />
Fig. 11 shows the measured maximum power output of the alternator<br />
system for three cases: diode rectification at 14 V <strong>and</strong><br />
switched-mode rectification at 42 V <strong>and</strong> 50 V. The solid lines in<br />
the figure are identical to the curves of Fig. 6 <strong>and</strong> are repeated<br />
for the sake of comparison. Once again, the experimental results<br />
validate the analytical results derived earlier in the report.<br />
Clearly, tremendous increases in output power are achievable<br />
across speed using the new SMR load-matching technique.<br />
Fig. 12. Experimentally-determined alternator losses at full field across speed<br />
for different operating modes. The SMR load-matching technique (at its optimal<br />
output voltage) yields the same or lower losses than diode rectification at its<br />
optimal output voltage.<br />
C. <strong>Power</strong> Losses<br />
As described in earlier in this section, the experimental test<br />
st<strong>and</strong> includes a dynamometer which allowed the measurement<br />
of mechanical input power to the alternator system. Using the<br />
measurements of electrical output power <strong>and</strong> mechanical input<br />
power, one can plot the power loss in the alternator system.<br />
Shown in Fig. 12 are the measured power losses versus speed<br />
at full field for the alternator system utilizing a diode rectifier<br />
at 14 V <strong>and</strong> a switched-mode rectifier at 50 V. (Again, these<br />
voltages represent the optimal output voltages of the two operating<br />
modes for the alternator used in the experiments. Similar<br />
results are obtainable in each mode at other output voltages<br />
merely by rewinding the machine stator appropriately.) This<br />
figure shows that the power losses associated with the alternator<br />
system using switched-mode rectifier load-matching are<br />
less than or equal to the ones with diode rectification over the