
You also want an ePaper? Increase the reach of your titles
YUMPU automatically turns print PDFs into web optimized ePapers that Google loves.
Advanced Biology Laboratory Exercise<br />
Unit 2: Cells<br />
CLASSROOM COPY<br />
<strong>Diffusion</strong> <strong>and</strong> <strong>Osmosis</strong> Lab<br />
Activity A: <strong>Diffusion</strong><br />
Objectives<br />
Use dialysis tubing to model diffusion across the cell membrane.<br />
Investigate the influence of solute concentration on osmosis<br />
Background to Activity A<br />
In the last unit, you learned about the molecules that are necessary to sustain life. In Unit 2 you will see how cells use<br />
these molecules to carrying out homeostasis, metabolism <strong>and</strong> protein production. In order for cells to use<br />
macromolecules, they must have a way to get the molecules into the cell. All molecules enter the cell through the cell<br />
membrane.<br />
The cell membrane is a cell’s interface with its surroundings. In one sense, this membrane must function as a barrier: it<br />
must keep together in one bundle the enzymes, DNA, <strong>and</strong> metabolic pathways that make life possible. The cell membrane<br />
must also function as a gateway: waste products must be discharged through it <strong>and</strong> essential materials (oxygen, water,<br />
carbohydrates, proteins, etc.) must enter through it. A membrane that allows some molecules to pass through while<br />
blocking the passage of others is said to be semipermeable. Molecules pass through the cell-membrane either through<br />
processes that require the cell to expend energy (active-transport), or through processes driven by the kinetic (thermal)<br />
energy of molecules (passive transport).<br />
In these lab activities, you will investigate the passage of materials through a semipermeable membrane by passive<br />
transport. The membrane you will use, dialysis tubing, is semipermeable because it has submicroscopic holes through it.<br />
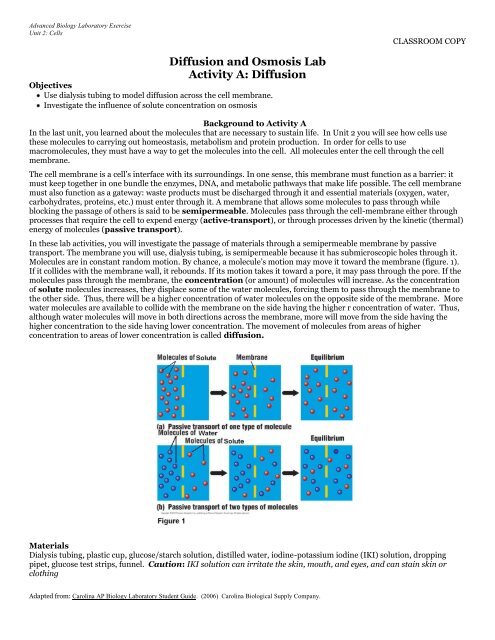
Molecules are in constant r<strong>and</strong>om motion. By chance, a molecule’s motion may move it toward the membrane (figure. 1).<br />
If it collides with the membrane wall, it rebounds. If its motion takes it toward a pore, it may pass through the pore. If the<br />
molecules pass through the membrane, the concentration (or amount) of molecules will increase. As the concentration<br />
of solute molecules increases, they displace some of the water molecules, forcing them to pass through the membrane to<br />
the other side. Thus, there will be a higher concentration of water molecules on the opposite side of the membrane. More<br />
water molecules are available to collide with the membrane on the side having the higher r concentration of water. Thus,<br />
although water molecules will move in both directions across the membrane, more will move from the side having the<br />
higher concentration to the side having lower concentration. The movement of molecules from areas of higher<br />
concentration to areas of lower concentration is called diffusion.<br />
Materials<br />
Dialysis tubing, plastic cup, glucose/starch solution, distilled water, iodine-potassium iodine (IKI) solution, dropping<br />
pipet, glucose test strips, funnel. Caution: IKI solution can irritate the skin, mouth, <strong>and</strong> eyes, <strong>and</strong> can stain skin or<br />
clothing<br />
Adapted from: Carolina AP Biology Laboratory Student Guide. (2006) Carolina Biological Supply Company.
Introduction<br />
In Activity A, you will explore the diffusion of different molecules through dialysis tubing, a semipermeable membrane.<br />
When iodine-potassium iodide (IKI) reacts with starch, it becomes part of the starch molecule <strong>and</strong> is removed from<br />
solution. We can easily observe this chemical reaction because the starch solution changes from a milky white color to<br />
blue-purple when it reacts with the IKI.<br />
Pre-Lab Questions<br />
1. What would a color change indicate when you combine the starch <strong>and</strong> iodine in step 3?<br />
2. Make a prediction: After 30 minutes has passed, do you expect to observe a color change in the cup or inside of the<br />
dialysis tubing? If so, predict what color the solutions will be.<br />
Inside of the cup:___________________________________________________________________<br />
Inside of the dialysis bag:______________________________________________________________<br />
Procedure<br />
Setting up a Control Test<br />
1. Pour 5 mL of distilled water into the test tube labeled IKI. Add approximately 5 mL of IKI solution to the water <strong>and</strong><br />
mix well. Record the solution color in Table 1.<br />
2. Pour 5 mL of distilled water into the test tube labeled Starch. Add approximately 5 mL of Starch solution to the<br />
water <strong>and</strong> mix well. Record the solution color in Table 1.<br />
3. Pour 5 mL of distilled water into the test tube labeled Starch + IKI. Add approximately 5 mL of Starch solution to<br />
the water <strong>and</strong> mix well. Add approximately 5 mL of IKI solution to the water <strong>and</strong> mix well. Record the solution<br />
color in Table 1.<br />
<strong>Diffusion</strong> Test<br />
4. Obtain a piece of dialysis tubing that has been soaked in water. The tubing should be soft <strong>and</strong> pliable. Roll the<br />
tubing between your thumb <strong>and</strong> index finger to open it. Close one end of the tube by knotting it or tying it off with<br />
string. This will form a bag.<br />
5. Using a small funnel, pour 15 mL of glucose/starch solution in the dialysis bag. Smooth out the top of the bag,<br />
running it between your thumb <strong>and</strong> index finger to expel the air. Tie off the open end of the bag. Leave enough<br />
room in the bag to allow for expansion. Record the initial color of the solution in the bag in table 2.<br />
6. Pour 160-170 mL of distilled water into a plastic cup. Add approximately 4 mL of IKI solution to the water <strong>and</strong> mix<br />
well. Record the intial color of the solution in the cup in table 2<br />
7. Immerse the dialysis bag in the solution in the cup. Make sure that the portion of the bag that contains the<br />
glucose/starch solution is completely covered by the solution in the cup at all times.<br />
8. Record the color of the solution in the cup in Table 2.<br />
9. Wait 30 minutes. While waiting, read through <strong>and</strong> discuss the analysis questions with your partner.<br />
Data & Observations, Activity A<br />
Table 1: Control Test<br />
Color of Solution<br />
IKI Starch Starch + IKI<br />
Table 2: <strong>Diffusion</strong> Test<br />
Initial Color of Solution<br />
Inside the Dialysis Tubing<br />
Inside the Cup<br />
Final Color of Solution<br />
Analysis of Results, Activity A<br />
1. Indicate on Figure 2 the initial locations (inside or outside of the bag) of all the kinds of molecules that are available<br />
for diffusion through the dialysis membrane.
2. What were the final colors of the solutions in the dialysis tubing <strong>and</strong> in the cup? Label the final locations of each<br />
molecule on Figure 2.<br />
3. Based on your observations of IKI <strong>and</strong> starch solutions, what conclusions can you draw about the solution in the<br />
dialysis tubing <strong>and</strong> in the cup?<br />
4. Compare your results with your predictions. Do you find any conflicts that would cause you to revise your<br />
predictions? If so, explain.<br />
5. What molecules were present during this activity? Does this activity account for all of the molecules that you listed ?<br />
If not, what data could have been collected to show the net direction of diffusion of this unaccounted for molecule or<br />
molecules?<br />
6. What does your data tell you about the sizes of the molecules relative to the pore size of the dialysis tubing?<br />
<strong>Diffusion</strong> <strong>and</strong> <strong>Osmosis</strong> Lab<br />
Activity B: <strong>Osmosis</strong><br />
Objectives<br />
Investigate the concept of water potential in relation to water movement into or out of plant cells<br />
Background to Activity B<br />
The diffusion of water molecules across a semipermeable membrane is termed osmosis. A process that depends upon<br />
r<strong>and</strong>om motion might seem inefficient, but so many water molecules are involved <strong>and</strong> they move so fast. It is estimated<br />
that a red blood cell floating in blood plasma gains an amount of water equal to 125 times its own volume every second. It<br />
also loses the same amount of water each second, all by osmosis. This occurs because the concentration of solutes in the<br />
blood plasma is the same as the concentration of solutes in red blood cells. Solutions that have the same solute<br />
concentration are isotonic. If we took a sample of whole blood <strong>and</strong> added salt to the plasma, increasing its solute<br />
concentration, the plasma becomes hypertonic to the solution in the red blood cells, <strong>and</strong> the cells lose water <strong>and</strong> shrink.<br />
If we add water to the blood plasma, decreasing its solute concentration, the plasma becomes hypotonic to the solution<br />
in the red blood cells. The cells gain water, swell, <strong>and</strong> may even burst.<br />
Materials<br />
Dialysis tubing, plastic cups, distilled water, funnel, sucrose solutions, balance, calculator (optional).<br />
Introduction<br />
In Activity B, you will investigate the influence (if any) of solute concentration on the net movement of water molecules<br />
through a semipermeable membrane. The solute you will use is sucrose (cane or table sugar) in the following molar<br />
concentrations:<br />
0.0 M (distilled water), 0.2 M, 0.4 M, 0.6 M, 0.8 M, & 1.0 M
Pre-Lab Questions<br />
1. Write a hypothesis that this experiment is designed to test.<br />
2. What are you measuring in this experiment?<br />
3. List at least three variables or factors (other that the one listed in your answer to #2) that could influence the outcome<br />
of this experiment. Briefly describe the method of control used for each of these variables.<br />
Variables Influencing Results<br />
Method of Control<br />
1. Ex: variations in tube size <strong>and</strong> mass Calculating the change in mass excludes the mass of the<br />
tubing from the results.<br />
2.<br />
3.<br />
Procedure<br />
Complete the following steps for each sucrose solution that you are assigned to test.<br />
1. Pour ~15o mL of distilled water into a plastic cup. Label the cup with the concentration of sucrose that you will test.<br />
2. Obtain a piece of dialysis tubing that has been soaked in water. The tubing should be soft <strong>and</strong> pliable. Roll the tubing<br />
between your thumb <strong>and</strong> index finger to open it. Close one end of the tube by knotting it or tying it off with a piece of<br />
string. This will form a bag.<br />
3. Using a small funnel, pour ~15 mL of sucrose solution into the dialysis bag. Smooth out the top of the bag, running it<br />
between your thumb <strong>and</strong> index finger to expel the air. Tie off the open end of the bag. Leave enough room in the bag<br />
to allow for expansion.<br />
4. Dry the bag gently with a paper towel <strong>and</strong> then determine its mass. Record this as the initial mass in Table 2.<br />
5. Immerse the dialysis bag in the water in the cup. Make sure that the portion of the bag that contains the sucrose<br />
solution is completely covered by the water in the cup at all times. Wait 30 minutes before continuing to the next step.<br />
6. After 30 minutes, remove the bag from the cup <strong>and</strong> dry it gently with a paper towel. (It should be as dry as it was<br />
before you measured the initial mass.) Mass the bag <strong>and</strong> record the final mass in Table 2. Finally, determine the<br />
change in mass of the bag <strong>and</strong> record this data in Table 3.<br />
Data<br />
Table 3: <strong>Osmosis</strong> Activity<br />
Contents in<br />
Dialysis Bag<br />
0.0 M sucrose<br />
(distilled water)<br />
0.2 M sucrose<br />
0.4 M sucrose<br />
0.6 M sucrose<br />
0.8 M sucrose<br />
1.0 M sucrose<br />
Initial Mass<br />
(g)<br />
Final Mass (g)<br />
Change in<br />
Mass (g)<br />
Your %<br />
ΔMass<br />
Class Average<br />
of % ΔMass<br />
Analysis of Results, Activity B<br />
Answer the following questions on a separate piece of paper.<br />
1. Calculate the percent change in mass (% ΔMass) using the following formula (show your work!).<br />
Record your results in Table 3.<br />
Mass<br />
% Mass x100<br />
Mass<br />
initial
2. Obtain <strong>and</strong> record the class averages for change in mass <strong>and</strong> percent change in mass in Table 3.<br />
3. What does the change in mass indicate?<br />
4. Graph the percent change in mass for your group data <strong>and</strong> the class averages. Title the graph <strong>and</strong> supply<br />
the following information:<br />
a. The independent variable is _____________________________________.<br />
b. The dependent variable is _______________________________________.<br />
Plot the independent variable on the x-axis, <strong>and</strong> the dependent variable on the y-axis.<br />
8. Explain any differences between the graph for your group <strong>and</strong> the graph of the class average.<br />
9. On the basis of your data <strong>and</strong> graph, has this experiment adequately tested the variable you listed under<br />
#5?<br />
10. Do your results support your hypothesis, refute it, or require that you modify it? Explain.<br />
11. On the basis of your results, write a statement that expresses the relationship of solute concentration <strong>and</strong><br />
direction of net movement of water molecules in osmosis.<br />
12. In which, if any, of the experimental setups were the solutions in the bag <strong>and</strong> outside of the bag isotonic<br />
to each other?<br />
13. If the experimental setup specified that only distilled water be used to fill the dialysis bag <strong>and</strong> that the<br />
sucrose solutions be used to fill the cup, how would that change your results?<br />
14. When you drink a glass of water, most of it is absorbed by osmosis through cells lining your small<br />
intestine. Drinking seawater can actually dehydrate the body. How?