News from Rohde&Schwarz - Rohde & Schwarz
News from Rohde&Schwarz - Rohde & Schwarz
News from Rohde&Schwarz - Rohde & Schwarz

Create successful ePaper yourself
Turn your PDF publications into a flip-book with our unique Google optimized e-Paper software.
Application notes<br />
level reductions down to –126 dB<br />
(referred to entire level and 4 kHz<br />
measurement bandwidth).<br />
From FIG 3 it can be seen that the<br />
spectral characteristic of a DAB transmitter<br />
would have to be recorded with<br />
a dynamic range of at least 110 dB<br />
to verify compliance with the critical<br />
mask. This is not possible with currently<br />
available test receivers or analyzers<br />
alone. The limits of measurement techniques<br />
also show for DVB-T. In the presence<br />
of a multicarrier signal, test<br />
receivers too are susceptible to intermodulation,<br />
so the maximum used level<br />
must not exceed about 50 dBµV for<br />
this measurement (provided that a<br />
measurement filter with 4 kHz bandwidth<br />
is available). With this useful<br />
level, emissions of –27 dBµV would<br />
have to be measured accurately at a<br />
frequency offset of 12 MHz <strong>from</strong> the<br />
DVB-T center.<br />
To measure the vestigial sideband<br />
characteristic of DAB and DVB-T transmitters,<br />
the signal is fed through a<br />
notch filter, which rejects the used<br />
channel as effectively as possible while<br />
letting the adjacent channel pass. In<br />
this way the test receiver is protected<br />
against overloading by the strong used<br />
signal while maintaining its full sensitivity<br />
in the range of interest of vestigial<br />
sideband emissions. The notch filter<br />
must be tunable. The attenuation<br />
along the frequency band to be represented<br />
must be added to the measured<br />
signal to obtain the true, unfiltered<br />
signal. The tracking generator<br />
of the analyzer is needed to accurately<br />
determine the filter response curve.<br />
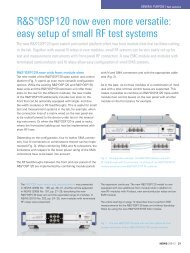
FIG 5 illustrates the test setup. The<br />
example in the box right demonstrates<br />
how easy such measurements can be.<br />
Summary<br />
The combination of Spectrum Monitoring<br />
System ARGUS-IT with instruments<br />
FSE, FSIQ or ESI makes it very easy to<br />
carry out all the above measurements<br />
on DAB/DVB-T signals required for<br />
interference handling and evaluation<br />
of the RF signal characteristic.<br />
Jörg Pfitzner<br />
Measurements made easy with<br />
ArgusMon software<br />
Vestigial sideband emissions of DVB transmitter<br />
above used channel (FIG 6)<br />
First the notch filter is manually tuned so<br />
that the passband begins at the cutoff frequency<br />
to be represented (depending on<br />
the edge to be measured). A tunable highpass<br />
or lowpass filter or a bandpass filter<br />
may also be used.<br />
The only values you have to enter in the<br />
ArgusMon software are those for the frequency<br />
band to be displayed (682 MHz<br />
to 692 MHz). The program automatically<br />
takes the other values like center frequency<br />
(680 MHz) and bandwidth (7.61 MHz)<br />
<strong>from</strong> the results of measurement in the used<br />
channel.<br />
Once the measurement is started, everything<br />
else is automatic. First the filter response<br />
curve, then the level characteristic of the<br />
filtered signal are measured across the band<br />
of interest, and the values of the two curves<br />
are added. The result is a graphical presentation<br />
of the true – ie unfiltered – signal<br />
characteristic. The relevant limit line normalized<br />
to the level is inserted into the diagram<br />
so that you see at a glance whether<br />
or not the transmitter complies with the stipulated<br />
mask.<br />
Signal<br />
2<br />
1 Switching matrix<br />
Filter<br />
RF<br />
input<br />
Receiver<br />
Tracking<br />
generator<br />
FIG 5<br />
Block diagram of<br />
setup for measuring<br />
DAB/DVB vestigial<br />
sideband emissions<br />
90 dBµV<br />
DVB signal characteristic<br />
70 dBµV<br />
50 dBµV<br />
30 dBµV<br />
10 dBµV<br />
–10 dBµV<br />
–30 dBµV<br />
Level/4 kHz<br />
Limit line<br />
682 MHz 684 MHz 686 MHz 688 MHz 690 MHz 692 MHz<br />
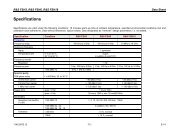
REFERENCES<br />
[1] Wolf D. Seidl: Spectrum monitoring the ITU<br />
way. <strong>News</strong> <strong>from</strong> <strong>Rohde</strong> & <strong>Schwarz</strong> (1997)<br />
No. 153, pp 26–27<br />
[2] Michael Lehmann; Dr Manfred Schukat:<br />
Coverage measurement and monitoring systems<br />
for DAB-T and DVB-T. <strong>News</strong> <strong>from</strong><br />
FIG 6<br />
Result of vestigial<br />
<strong>Rohde</strong> & <strong>Schwarz</strong> (1999) No. 162,<br />
sideband measurement<br />
with wide<br />
pp 22–24<br />
dynamic range Reader service card 164/05<br />
<strong>News</strong> <strong>from</strong> <strong>Rohde</strong> & <strong>Schwarz</strong> Number 164 (1999/IV) 19