"Rightsizing Europe" - The European car crisis and ... - Roland Berger
"Rightsizing Europe" - The European car crisis and ... - Roland Berger
"Rightsizing Europe" - The European car crisis and ... - Roland Berger
You also want an ePaper? Increase the reach of your titles
YUMPU automatically turns print PDFs into web optimized ePapers that Google loves.
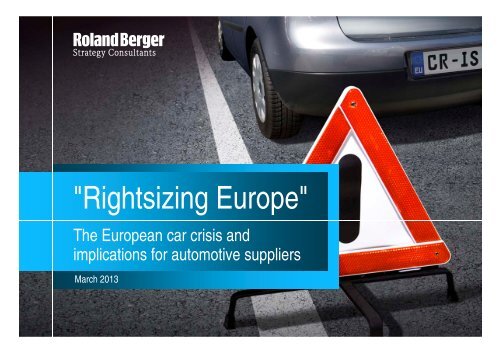
"<strong>Rightsizing</strong> Europe"<br />
<strong>The</strong> <strong>European</strong> <strong>car</strong> <strong>crisis</strong> <strong>and</strong><br />
implications for automotive suppliers<br />
March 2013<br />
1
Contents<br />
A B C<br />
Market outlook Supplier implications Need for action<br />
Development of global <strong>and</strong><br />
<strong>European</strong> <strong>car</strong> markets in the<br />
next few years<br />
"<strong>Rightsizing</strong>" <strong>European</strong><br />
structures is becoming a top<br />
priority<br />
Key levers for suppliers to<br />
sustainably improve<br />
profitability<br />
2
A. Market outlook: Development of global <strong>and</strong><br />
<strong>European</strong> <strong>car</strong> markets in the next few years<br />
Rol<strong>and</strong>_<strong>Berger</strong>_Automotive_Supplier_Europe_20130328.pptx<br />
3
Global <strong>car</strong> sales: Strong recovery since the 2008 <strong>crisis</strong>. Continued<br />
growth expected after 2013<br />
Global sales of passenger vehicles 1) [million vehicles]<br />
FORECAST<br />
H1 (Jan-Jun) H2 (Jul-Dec)<br />
69.5<br />
34.4<br />
35.2<br />
-5.0%<br />
-11.7%<br />
+1.6%<br />
66.0<br />
30.3<br />
35.7<br />
-3.3%<br />
+10.3%<br />
-14.9%<br />
63.8<br />
33.5<br />
30.4<br />
+13.5%<br />
+9.0%<br />
+18.5%<br />
72.5<br />
36.5<br />
36.0<br />
+4.4%<br />
+3.4%<br />
+5.3%<br />
75.6<br />
37.7<br />
37.9<br />
+5.2%<br />
+4.1%<br />
+6.2%<br />
79.5<br />
39.2<br />
40.3<br />
+3.0%<br />
+3.1%<br />
+3.0%<br />
81.9<br />
40.5<br />
41.5<br />
+6.0%<br />
+5.7%<br />
+6.3%<br />
86.9<br />
42.8<br />
44.1<br />
+5.9%<br />
+5.8%<br />
+5.9%<br />
92.0<br />
45.3<br />
46.7<br />
+4.6%<br />
+4.5%<br />
+4.7%<br />
96.2<br />
47.3<br />
48.9<br />
2007<br />
2008<br />
2009<br />
2010<br />
2011<br />
2012<br />
2013<br />
2014<br />
2015<br />
2016<br />
1) Incl. light commercial vehicles<br />
Source: IHS; Rol<strong>and</strong> <strong>Berger</strong><br />
4
Regional growth rates: Western Europe will see another weak year<br />
in 2013<br />
Global sales of passenger vehicles 1,2)<br />
NAFTA Western Europe China<br />
9%<br />
12%<br />
5%<br />
3%<br />
3%<br />
2%<br />
0%<br />
4%<br />
6%<br />
3%<br />
4%<br />
7%<br />
9%<br />
11%<br />
9%<br />
7%<br />
-9%<br />
-3%<br />
2011<br />
2012<br />
2013<br />
2014<br />
2015<br />
2016<br />
2011<br />
2012<br />
2013<br />
2014<br />
2015<br />
2016<br />
2011<br />
2012<br />
2013<br />
2014<br />
2015<br />
2016<br />
South America WORLD Japan/Korea<br />
19%<br />
10%<br />
5%<br />
0%<br />
6%<br />
6%<br />
6%<br />
4%<br />
5%<br />
3%<br />
6%<br />
6%<br />
5%<br />
-12%<br />
-8%<br />
1%<br />
0%<br />
-2%<br />
2011<br />
2012<br />
2013<br />
2014<br />
2015<br />
2016<br />
2011<br />
2012<br />
2013<br />
2014<br />
2015<br />
2016<br />
2011<br />
2012<br />
2013<br />
2014<br />
2015<br />
2016<br />
1) Incl. light commercial vehicles 2) Year-on-year growth rate = Forecast<br />
Source: IHS; Rol<strong>and</strong> <strong>Berger</strong><br />
5
Western Europe: Market volumes stagnating at "<strong>crisis</strong> level" – 2008<br />
production levels will not be reached in the next few years<br />
Medium-term outlook for passenger vehicles 1) in Western Europe [million vehicles]<br />
Sales<br />
Production<br />
16.9<br />
15.4<br />
16.0<br />
14.4<br />
15.0<br />
14.5<br />
14.4<br />
13.2<br />
12.8<br />
13.4<br />
14.2<br />
14.5<br />
11.8<br />
13.2<br />
13.6<br />
12.4<br />
12.1<br />
12.4<br />
12.7<br />
12.9<br />
'07<br />
'08<br />
'09<br />
'10<br />
'11<br />
'12<br />
'13<br />
'14<br />
'15<br />
'16<br />
'07<br />
'08<br />
'09<br />
'10<br />
'11<br />
'12<br />
'13<br />
'14<br />
'15<br />
'16<br />
1) Including light commercial vehicles<br />
Source: IHS; Rol<strong>and</strong> <strong>Berger</strong><br />
6
Western Europe: Global importance of W. Europe as a production<br />
hub is declining due to falling local sales <strong>and</strong> OEM globalization<br />
Development of WE passenger vehicle production structure… [million vehicles; %]<br />
… as a proportion<br />
of global<br />
production [%]<br />
➨ Declining global<br />
importance of<br />
Western Europe<br />
23<br />
21<br />
12<br />
2007<br />
25<br />
19<br />
15<br />
2013<br />
27<br />
18<br />
13<br />
2016<br />
China<br />
North America<br />
Western<br />
Europe<br />
… by OEM<br />
origin [%]<br />
➨ Share of German<br />
OEMs rising<br />
significantly<br />
35<br />
27<br />
19<br />
11<br />
2007<br />
48<br />
24<br />
13<br />
8<br />
7<br />
2013<br />
47<br />
23<br />
15<br />
9<br />
2016<br />
German<br />
French<br />
US<br />
Other <strong>European</strong><br />
Asian<br />
… by size<br />
segment<br />
➨ Only minor<br />
changes in size<br />
structure<br />
16.0<br />
1%<br />
14%<br />
23%<br />
35%<br />
26%<br />
1%<br />
2007<br />
12.9<br />
0%<br />
14%<br />
23%<br />
40%<br />
3% 20%<br />
2016<br />
HVAN<br />
E/F<br />
D<br />
C<br />
B<br />
A<br />
… by price<br />
segment<br />
➨ Decline in<br />
production of<br />
entry-level <strong>car</strong>s<br />
16.0<br />
27%<br />
23%<br />
50%<br />
2007<br />
12.9<br />
39%<br />
23%<br />
38%<br />
2016<br />
Premium<br />
Mid<br />
Entry<br />
1) Including light commercial vehicles<br />
Source: IHS; Rol<strong>and</strong> <strong>Berger</strong><br />
7
OEM profitability: <strong>The</strong> difficult market has already impacted OEM<br />
margins. German br<strong>and</strong>s show strong performance<br />
EBIT margin of OEMs 1) [%]<br />
4.5<br />
5.3<br />
5.0<br />
5.2<br />
4.0<br />
4.4<br />
4.8<br />
5.2<br />
5.8<br />
~5.5<br />
0.1<br />
-0.6<br />
’01<br />
’02<br />
’03<br />
’04 ’05 ’06 ’07 ’08 ’09 ’10 ’11 '12E<br />
1) n = 14 (BMW, Daimler, Fiat, Ford, General Motors, Honda, Hyundai, Mazda, Nissan, PSA, Renault, Suzuki, Toyota, Volkswagen)<br />
Source: Thomson; FactSet; OEMs' annual/half-yearly reports; Rol<strong>and</strong> <strong>Berger</strong> analysis<br />
8
B. Supplier implications: "<strong>Rightsizing</strong>" <strong>European</strong> structures is<br />
becoming a top priority<br />
Rol<strong>and</strong>_<strong>Berger</strong>_Automotive_Supplier_Europe_20130328.pptx<br />
9
Supplier profitability: After the all-time high in 2010, the profitability<br />
of the global auto supplier industry is now declining again<br />
Key performance indicators of automotive suppliers<br />
Revenue growth [2000=100] EBIT margin [%]<br />
141<br />
154<br />
148<br />
~180<br />
~175<br />
167<br />
150<br />
6.1<br />
6.6<br />
6.1 6.1<br />
5.8<br />
5.2 5.0<br />
6.9<br />
6.6<br />
~6.0<br />
~5.5-6.0<br />
117<br />
129<br />
125<br />
3.3<br />
100<br />
106<br />
2.3<br />
1.8<br />
'02<br />
'03<br />
'04<br />
'05<br />
'06<br />
'07<br />
'08<br />
'09<br />
'10<br />
'11<br />
'12 1)<br />
13 1)<br />
'00<br />
'01<br />
'02<br />
'03<br />
'04<br />
'05<br />
'06<br />
'07<br />
'08<br />
'09<br />
'10<br />
'11 '12 1)<br />
13 1)<br />
1) Estimate – Calculation of final 2012 data currently in progress<br />
Source: Rol<strong>and</strong> <strong>Berger</strong>/Lazard Global Automotive Supplier Database<br />
10
Regional differences: <strong>The</strong> main drivers of this decline are suppliers<br />
headquartered in Europe<br />
EBIT margins in the automotive supply industry by HQ location 1) [%]<br />
Europe<br />
NAFTA Japan China Korea<br />
10.3<br />
~9-10<br />
~9-10<br />
7.0 7.1<br />
~5-6<br />
5.6<br />
6.3 ~6<br />
6.5<br />
~6<br />
5.1<br />
9.8<br />
6.5<br />
9.3<br />
'07 '11'12 2) '07 '11'12 2) '07 '11'12 2)<br />
'07<br />
'11'12 2)<br />
'07<br />
'11'12 2)<br />
Trend 2012 vs. 2011<br />
1) n = approx. 600 suppliers, 2012 estimated 2) Estimate – Calculation of final 2012 data currently in progress<br />
Source: Rol<strong>and</strong> <strong>Berger</strong>/Lazard Global Automotive Supplier Database<br />
11
Looking forward: Local market development <strong>and</strong> OEMs' globalization<br />
initiatives are two of the top issues for <strong>European</strong> supplier CEOs<br />
Supplier CEO radar screen for 2013 <strong>and</strong> beyond (as of March 2013)<br />
3 COMPETITION 4 LEGISLATION<br />
1<br />
CAR<br />
BUYERS<br />
Demotorization<br />
2 OEMS<br />
Stagnation of triad<br />
markets<br />
Rising star<br />
OEMs<br />
Volatility in<br />
dem<strong>and</strong><br />
Terms &<br />
conditions<br />
Additional<br />
price pressure<br />
Market<br />
volumes 2013<br />
Europe<br />
Selective<br />
consolidation<br />
Global<br />
localization<br />
Emerging<br />
market<br />
suppliers<br />
Emerging<br />
market<br />
investors<br />
Zero casualties<br />
Further pressure to<br />
reduce <strong>car</strong>bon<br />
emissions<br />
Connected<br />
vehicle<br />
Factor cost<br />
inflation<br />
2013<br />
Rising energy<br />
costs<br />
Insolvencies in<br />
supplier base<br />
Oil price<br />
increase<br />
Availability<br />
of skilled<br />
workforce<br />
Volatility of equity<br />
Credit capital markets<br />
shortage<br />
Basle 3<br />
5 FACTOR<br />
MARKETS<br />
Investor view of<br />
automotive industry<br />
6<br />
CAPITAL<br />
MARKETS<br />
Topics with particular impact on Western Europe<br />
Excluding product segment-specific technology <strong>and</strong> operational issues<br />
Source: Rol<strong>and</strong> <strong>Berger</strong><br />
12
Consequence: Given the disappointing market situation, many auto<br />
suppliers are currently "rightsizing" their operations in Europe<br />
SUPPLIER'S REACTION<br />
Market<br />
situation<br />
Production R&D SG&A<br />
> Weak <strong>European</strong><br />
<strong>car</strong> sales<br />
(medium term)<br />
> Global<br />
localization of<br />
<strong>European</strong> OEMs<br />
➨ Reduced <strong>car</strong><br />
production<br />
levels in W.<br />
Europe<br />
> Adjustment of<br />
direct labor<br />
capacity<br />
> Adjustment of<br />
indirect labor<br />
capacity in line<br />
with direct labor<br />
> Relocation of<br />
R&D capacity<br />
to growth<br />
markets (closer<br />
to local OEM<br />
R&D/production)<br />
> Adjustment of<br />
<strong>European</strong> R&D<br />
capacity<br />
> Adjustment of<br />
SG&A headcount<br />
more or<br />
less in line with<br />
reduced<br />
production<br />
capacity (to<br />
keep a constant<br />
SG&A cost<br />
ratio)<br />
> Lower supplier<br />
headcount in<br />
Western<br />
Europe, while<br />
total (global)<br />
headcount<br />
continues to<br />
grow<br />
Source: Rol<strong>and</strong> <strong>Berger</strong><br />
13
Headcount impact: As a result, approximately 10% of the total<br />
750,000 Western <strong>European</strong> automotive supplier jobs could be at risk<br />
Estimated impact on automotive supplier employment in Western Europe<br />
Western Europe<br />
automotive supplier<br />
employment 2012<br />
~750,000<br />
High-level job split<br />
100%<br />
~10% SG&A<br />
~10% R&D<br />
~80% Operations<br />
Medium-term<br />
"misalignment"<br />
SG&A <strong>and</strong> R&D<br />
~5-7%<br />
> Adjustment to reduced<br />
"volume grid"<br />
> Adjustment due to relocation of<br />
activities<br />
OPERATIONS<br />
~10-13%<br />
> Adjustment to reduce current<br />
avg. supplier overcapacity (5-<br />
10%) <strong>and</strong> to reflect efficiency<br />
gains in the next 3-4 years in a<br />
more or less constant market<br />
MEDIUM-TERM<br />
IMPACT (3-4 yrs.)<br />
Employees at risk<br />
~85,000<br />
~75,000<br />
~65,000<br />
> Highest<br />
"relative"<br />
impact:<br />
FR, IT, ES<br />
> Highest<br />
"absolute"<br />
impact (due<br />
to large<br />
number of<br />
locations):<br />
GER<br />
Source: Eurostat; VDA; ACEA; Rol<strong>and</strong> <strong>Berger</strong> simulation<br />
14
C. Need for action: Key levers for suppliers to sustainably<br />
improve profitability<br />
Rol<strong>and</strong>_<strong>Berger</strong>_Automotive_Supplier_Europe_20130328.pptx<br />
15
Need for action: Nine key levers suppliers can apply to combat<br />
declining or stagnating margins in Europe<br />
"Rightsize<br />
Europe"<br />
R&D Purchasing Production Overhead/<br />
crossfunctional<br />
>Improve<br />
R&D<br />
efficiency<br />
> Adjust plant<br />
footprint<br />
> Optimize<br />
overheads<br />
Lower<br />
breakeven<br />
point in<br />
Europe<br />
"Operational<br />
excellence "<br />
>Improve<br />
project<br />
management<br />
organization<br />
> Achieve<br />
purchasing<br />
excellence<br />
> Anchor cost<br />
engineering<br />
> Cut stocks<br />
> Achieve<br />
logistics<br />
excellence<br />
> Achieve<br />
working<br />
capital<br />
excellence<br />
Increased<br />
operational<br />
efficiency<br />
Source: Rol<strong>and</strong> <strong>Berger</strong><br />
16
Nine key levers suppliers can apply to combat declining or<br />
stagnating margins in Europe (1/3)<br />
IMPROVE R&D<br />
EFFICIENCY<br />
ADJUST PLANT<br />
FOOTPRINT<br />
SMART OVERHEAD<br />
COST REDUCTION<br />
LEVER<br />
OBJECTIVE<br />
10-15% reduction in R&D<br />
resources (with constant<br />
output)<br />
Increase flexibility, efficiency <strong>and</strong><br />
long-term utilization of <strong>European</strong><br />
plant setup<br />
15-20% improvement in<br />
overhead efficiency<br />
ROLAND<br />
BERGER<br />
APPROACH<br />
> Identify actual costs <strong>and</strong><br />
resources in R&D<br />
> Set a target figure for costs <strong>and</strong><br />
resources based on benchmarks<br />
> Carry out strengths/weaknesses<br />
analysis, comparing with best<br />
practice<br />
> Use the RB lever tree <strong>and</strong> derive<br />
necessary actions (e.g.<br />
organizational setup, R&D<br />
footprint, resource allocation,<br />
controlling/KPIs)<br />
> Gain a clear picture of the current<br />
footprint in terms of setup <strong>and</strong><br />
technical/personnel scalability<br />
> Identify improvement measures<br />
within plants <strong>and</strong> the production<br />
network<br />
> Assess the financial feasibility of<br />
measures – focus on "true<br />
effects/synergies"<br />
> Derive implementation plan <strong>and</strong><br />
closely manage layoffs while achieving<br />
per capita cost improvements<br />
> Ensure transparency regarding<br />
the company's current overhead<br />
costs <strong>and</strong> headcount<br />
> Derive an efficiency target for<br />
each functional area/company<br />
on the basis of benchmarks (we<br />
have a benchmark database<br />
covering approx. 200 suppliers)<br />
> Develop appropriate bottom-up<br />
actions in workshops<br />
Source: Rol<strong>and</strong> <strong>Berger</strong><br />
17
Nine key levers suppliers can apply to combat declining or<br />
stagnating margins in Europe (2/3)<br />
IMPROVE PROJECT<br />
MGMT. ORGANIZATION<br />
PURCHASING<br />
EXCELLENCE<br />
ANCHOR COST<br />
ENGINEERING<br />
LEVER<br />
OBJECTIVE<br />
Clear improvement in<br />
efficiency <strong>and</strong> effectiveness<br />
of project management<br />
Best practice achieved in<br />
purchasing organization <strong>and</strong><br />
processes<br />
Reduction of procurement costs<br />
through better integration of<br />
development <strong>and</strong> purchasing<br />
ROLAND<br />
BERGER<br />
APPROACH<br />
> Describe existing project<br />
management organization<br />
(especially interface between<br />
development <strong>and</strong> sales)<br />
> Carry out strengths/weaknesses<br />
analysis, comparing with best<br />
practice<br />
> Draw up a conceptual objective in<br />
cross-functional workshops,<br />
especially for competencies <strong>and</strong><br />
responsibilities at interfaces<br />
> Prepare an action plan<br />
> Identify <strong>and</strong> evaluate the actual<br />
situation in purchasing using 10<br />
st<strong>and</strong>ardized criteria (e.g.<br />
organizational setup, processes,<br />
tools, committees, employee<br />
quality, controlling/KPIs)<br />
> Carry out detailed comparison<br />
with best-practice examples<br />
from the supplier industry<br />
> Derive a conceptual objective<br />
for purchasing <strong>and</strong> produce an<br />
action plan<br />
> Draw up a company-specific<br />
conceptual objective for cost<br />
engineering<br />
> Develop detailed components of<br />
cost engineering (organizational<br />
setup, processes, methods <strong>and</strong><br />
tools, KPIs, staffing, etc.)<br />
> In parallel, apply in 2-3 specific<br />
pilot projects<br />
> Draw up an implementation<br />
roadmap (incl. communication)<br />
Source: Rol<strong>and</strong> <strong>Berger</strong><br />
18
Nine key levers suppliers can apply to combat declining or<br />
stagnating margins in Europe (3/3)<br />
REDUCE<br />
INVENTORY<br />
ACHIEVE LOGISTICS<br />
EXCELLENCE<br />
ACHIEVE WORKING<br />
CAPITAL EXCELLENCE<br />
LEVER<br />
OBJECTIVE<br />
Reduction of inventory by approx.<br />
20% along the entire value chain<br />
Reduction of logistics<br />
costs <strong>and</strong> improvement<br />
of performance<br />
Lasting reduction of 15-20%<br />
in net working capital (NWC)<br />
ROLAND<br />
BERGER<br />
APPROACH<br />
> Identify potential reduction on the<br />
basis of a structural analysis, benchmarking<br />
<strong>and</strong> discussion of best<br />
practice levers (e.g. base stock/nonmovers,<br />
buffer stock, stock planning)<br />
> Hold 2-3 cross-functional workshops<br />
per location (incl. aftermarket)<br />
> Implement identified levers/actions<br />
immediately<br />
> Anchor long term through structural<br />
actions (incentives, processes, best<br />
practice transfer, etc.)<br />
> Identify current logistics<br />
performance using st<strong>and</strong>ard<br />
questionnaires <strong>and</strong> data analysis<br />
> Audit critical locations using<br />
best practice checklists <strong>and</strong><br />
define improvement actions<br />
> Derive a st<strong>and</strong>ard logistics<br />
concept for global rollout<br />
> Create transparency regarding the<br />
structure <strong>and</strong> drivers of NWC<br />
> Draw up short-term actions for all<br />
areas of NWC (receivables,<br />
liabilities, stocks) based on the RB<br />
lever toolbox<br />
> Methods: Benchmarking, inventory<br />
structure analysis, optimization of<br />
payment terms, receivables mgmt.<br />
> Ensure sustainability through<br />
systematic NWC management<br />
Source: Rol<strong>and</strong> <strong>Berger</strong><br />
19
Rol<strong>and</strong>_<strong>Berger</strong>_Automotive_Supplier_Europe_20130328.pptx


