Offshore wind toward 2020 - On the pathway to cost ... - Roland Berger
Offshore wind toward 2020 - On the pathway to cost ... - Roland Berger
Offshore wind toward 2020 - On the pathway to cost ... - Roland Berger

Create successful ePaper yourself
Turn your PDF publications into a flip-book with our unique Google optimized e-Paper software.
2013_RBSC_<strong>Offshore</strong>_Wind_Study.pptx<br />
1<br />
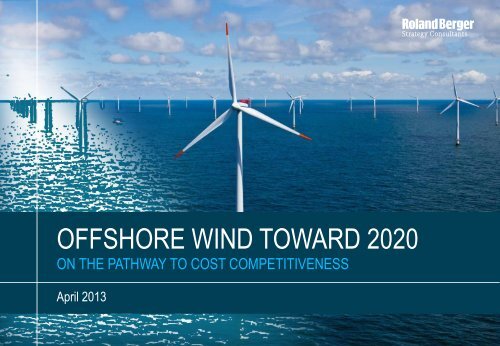
OFFSHORE WIND TOWARD <strong>2020</strong><br />
ON THE PATHWAY TO COST COMPETITIVENESS<br />
April 2013
Contents<br />
A<br />
B<br />
C<br />
<strong>Offshore</strong> market volume of EUR 130 bn by <strong>2020</strong><br />
Agenda <strong>2020</strong> – Markets – Trends – Competition Page 3<br />
Value chain evaluation for offshore<br />
Project development – Turbines – Foundation – Grid – Vessels – O&M Page 8<br />
<strong>Offshore</strong> potential <strong>to</strong> meet LCoE targets<br />
Utilities – Inves<strong>to</strong>rs – Cost competitiveness – Saving potential – LCoE Page 16<br />
D Conclusion<br />
<strong>Offshore</strong> on <strong>the</strong> <strong>pathway</strong> <strong>to</strong> <strong>cost</strong> competitiveness Page 22<br />
© 2013 <strong>Roland</strong> <strong>Berger</strong> Strategy Consultants GmbH<br />
2013_RBSC_<strong>Offshore</strong>_Wind_Study.pptx<br />
2
2013_RBSC_<strong>Offshore</strong>_Wind_Study.pptx<br />
3<br />
<strong>Offshore</strong> market volume of EUR 130 bn by <strong>2020</strong><br />
A. Agenda <strong>2020</strong> – Market – Trends – Competition
A. <strong>Offshore</strong> market volume of EUR 130 bn by <strong>2020</strong><br />
<strong>Offshore</strong> <strong>wind</strong> energy is an essential element in<br />
meeting ambitious European climate and energy targets<br />
Renewables agenda<br />
EUROPEAN TARGETS <strong>2020</strong><br />
35%<br />
of electricity<br />
from renewables<br />
Acceptance<br />
12%<br />
of electricity<br />
from <strong>wind</strong> energy<br />
Technology<br />
Power<br />
generation<br />
40GW<br />
installed<br />
offshore capacity<br />
Security of supply<br />
& sustainability<br />
Economics<br />
Politics &<br />
regulation<br />
ADVANTAGES OF OFFSHORE WIND<br />
Wind energy is <strong>the</strong> most mature renewable energy<br />
technology in operation<br />
There is limited growth potential for onshore <strong>wind</strong> due <strong>to</strong><br />
high population density in Europe<br />
<strong>Offshore</strong> <strong>wind</strong> provides higher and steadier energy yields –<br />
on average about 4,000 full load hours<br />
<strong>Offshore</strong> <strong>wind</strong> is a very young technology that offers fur<strong>the</strong>r<br />
potential for substantial <strong>cost</strong> reductions<br />
Several European countries rely strongly on offshore<br />
<strong>wind</strong> <strong>to</strong> fulfill <strong>the</strong>ir energy and climate targets<br />
OFFSHORE WIND IS A KEY PILLAR<br />
OF THE EUROPEAN ENERGY TRANSITION<br />
Source: European Commission; EWEA; BWE; <strong>Roland</strong> <strong>Berger</strong><br />
2013_RBSC_<strong>Offshore</strong>_Wind_Study.pptx<br />
4
A. <strong>Offshore</strong> market volume of EUR 130 bn by <strong>2020</strong><br />
<strong>Offshore</strong> <strong>wind</strong> energy will soon become a large sec<strong>to</strong>r –<br />
Global investments of EUR 130 bn by <strong>2020</strong><br />
Global offshore market<br />
North America<br />
Capacity<br />
[MW p.a.]<br />
0.0<br />
2013<br />
300<br />
2016<br />
500<br />
<strong>2020</strong><br />
<strong>Offshore</strong> projects<br />
Investment<br />
[EUR bn p.a.]<br />
0.0<br />
2013<br />
1.1<br />
2016<br />
1.6<br />
<strong>2020</strong><br />
Plans for offshore<br />
Source: EER; BTM; Global Data; <strong>Roland</strong> <strong>Berger</strong><br />
No activity<br />
Rationale: Investment <strong>cost</strong>s per MW: 2013: EUR 3.9 m, 2016: EUR 3.6 m, <strong>2020</strong>: EUR 3.2 m<br />
Europe<br />
Capacity<br />
[MW p.a.]<br />
4,500<br />
1,8002,600<br />
2013<br />
2016<br />
Asia Pacific<br />
Capacity<br />
[MW p.a.]<br />
400<br />
900<br />
<strong>2020</strong><br />
1,500<br />
Investment<br />
[EUR bn p.a.]<br />
7.0<br />
2013<br />
3.2<br />
9.4<br />
2016<br />
Investment<br />
[EUR bn p.a.]<br />
1.6<br />
4.8<br />
2013 2016 <strong>2020</strong> 2013 2016 <strong>2020</strong><br />
14.4<br />
<strong>2020</strong><br />
COMMENTS<br />
> Europe has ambitious<br />
growth rates and annual<br />
additions of 4.5 GW or<br />
EUR 14.4 bn in <strong>2020</strong><br />
> Asia Pacific will catch<br />
up, with annual additions<br />
of 1.5 GW or EUR 4.8 bn<br />
in <strong>2020</strong><br />
> North America follows,<br />
with lower levels<br />
> ROW shows no relevant<br />
investment in offshore<br />
through <strong>2020</strong><br />
> Risks <strong>to</strong> global<br />
development arise from<br />
challenges such as a<br />
lack of grid connections<br />
and <strong>the</strong> need <strong>to</strong> reduce<br />
<strong>the</strong> <strong>cost</strong> of energy<br />
2013_RBSC_<strong>Offshore</strong>_Wind_Study.pptx<br />
5
A. <strong>Offshore</strong> market volume of EUR 130 bn by <strong>2020</strong><br />
The next generation of offshore <strong>wind</strong> farms will be<br />
constructed fur<strong>the</strong>r away from <strong>the</strong> shore in deeper water<br />
Trends in offshore<br />
OFFSHORE WIND FARMS<br />
TRENDS<br />
Distance<br />
<strong>to</strong> shore<br />
[km]<br />
120<br />
100<br />
80<br />
60<br />
40<br />
20<br />
0 10 20 30 40 50<br />
In operation Under construction Approved<br />
Average<br />
farm size<br />
[MW ] 200 300 340<br />
Water<br />
depth<br />
[m]<br />
I<br />
II<br />
III<br />
FURTHER<br />
> Trend <strong><strong>to</strong>ward</strong> building <strong>wind</strong><br />
farms fur<strong>the</strong>r from shore<br />
> Environmental laws (GER)<br />
and limited space close <strong>to</strong><br />
shore are a driver for<br />
greater distance<br />
DEEPER<br />
> Greater distance <strong>to</strong> shore<br />
usually leads <strong>to</strong> deeper water<br />
at site<br />
> Deeper water requires new<br />
foundation solutions<br />
LARGER<br />
> Larger <strong>wind</strong> farms allow<br />
improved fixed <strong>cost</strong> allocation<br />
> Average size of approved<br />
projects is at 340 MW<br />
Source: EWEA; <strong>Roland</strong> <strong>Berger</strong><br />
2013_RBSC_<strong>Offshore</strong>_Wind_Study.pptx<br />
6
Source: EWEA; EER; manufacturers; press; <strong>Roland</strong> <strong>Berger</strong><br />
2013_RBSC_<strong>Offshore</strong>_Wind_Study.pptx<br />
7<br />
A. <strong>Offshore</strong> market volume of EUR 130 bn by <strong>2020</strong><br />
<strong>Offshore</strong> turbine manufacturing will enter a phase<br />
of intense competition – Threat of future overcapacity<br />
Competition between <strong>wind</strong> turbine manufacturers<br />
NEW ENTRANTS ESTABLISHED PLAYERS DOMINANT PLAYERS<br />
74<br />
533 698<br />
100 WTG<br />
= Number of installed offshore <strong>wind</strong> turbine genera<strong>to</strong>rs (WTG)<br />
6<br />
14<br />
17<br />
18<br />
34<br />
COMMENTS<br />
> Large number of new<br />
market entrants in <strong>the</strong> last<br />
two years<br />
> Big industrial players such<br />
as Als<strong>to</strong>m, Hyundai,<br />
Mitsubishi and Samsung<br />
see offshore <strong>wind</strong> as<br />
attractive<br />
> Competition will increase<br />
significantly due <strong>to</strong> <strong>the</strong> large<br />
number of new entrants<br />
> Siemens and Vestas are<br />
<strong>the</strong> dominant players, with<br />
more than 500 turbines<br />
installed<br />
> Production overcapacity<br />
expected in <strong>the</strong> years<br />
<strong>to</strong> come
2013_RBSC_<strong>Offshore</strong>_Wind_Study.pptx<br />
8<br />
B.<br />
Value chain evaluation for offshore<br />
Project development – Turbines – Foundation – Grid – Vessels – O&M
B. Value chain evaluation for offshore<br />
<strong>Offshore</strong> projects show significant potential for<br />
improvement across <strong>the</strong> entire project value chain<br />
Value chain for offshore projects<br />
1<br />
PROJECT DEVELOPMENT<br />
2<br />
WIND TURBINE<br />
4 GRID 5<br />
CONNECTION<br />
LOGISTICS &<br />
INSTALLATION<br />
6<br />
OPERATION &<br />
MAINTENANCE<br />
3<br />
SUPPORT STRUCTURE<br />
Source: <strong>Roland</strong> <strong>Berger</strong><br />
2013_RBSC_<strong>Offshore</strong>_Wind_Study.pptx<br />
9
B. Value chain evaluation for offshore<br />
<strong>Offshore</strong> project development takes 7-10 years –<br />
Growing professionalism expected <strong>to</strong> reduce delays<br />
Project development<br />
Initial<br />
planning<br />
> Identify<br />
suitable area<br />
> Evaluate <strong>wind</strong><br />
potential<br />
> Evaluate<br />
ground surface<br />
> Develop <strong>wind</strong><br />
farm layout<br />
Permission<br />
> Apply <strong>to</strong> <strong>the</strong><br />
responsible<br />
public authority<br />
> Conduct<br />
required<br />
environmental<br />
studies<br />
Supplier<br />
management<br />
> Identify suppliers<br />
> Negotiate terms<br />
> Allocate interface<br />
risks<br />
> Develop<br />
installation and<br />
logistics concepts<br />
> Develop O&M<br />
concept<br />
Financing<br />
> Optimize<br />
project<br />
structure<br />
> Prepare info<br />
memo and<br />
financial model<br />
for inves<strong>to</strong>rs<br />
and banks<br />
> Approach<br />
banks and<br />
inves<strong>to</strong>rs<br />
> Financial close<br />
Installation &<br />
construction<br />
> Align suppliers'<br />
timeframes with<br />
logistics<br />
concept<br />
> Manage and<br />
mitigate<br />
interface risks<br />
> Ensure timely<br />
commissioning<br />
Operations &<br />
maintenance<br />
> Assure high<br />
level of turbine<br />
availability<br />
> Regular service<br />
and quick<br />
troubleshooting<br />
> Enable<br />
component<br />
change<br />
> Ensure <strong>cost</strong><br />
effectiveness of<br />
O&M concept<br />
1-3 years 2-4 years 2-3 years 1-3 years 1-2 years 20+ years<br />
Avg. of 7-10 years 1)<br />
COMMENTS<br />
> Interface risks for inves<strong>to</strong>rs<br />
– EPC contracts for offshore <strong>wind</strong><br />
projects are not available<br />
– Multi-contracting has major<br />
interface risks for inves<strong>to</strong>rs<br />
> Improvement methods<br />
– Build strategic partnerships with<br />
a small number of partners<br />
– Streng<strong>the</strong>n controls<br />
– Hire experienced personnel<br />
from developers<br />
> Growing professionalism<br />
– Market entry by large players<br />
such as construction companies<br />
and utilities leads <strong>to</strong> growing<br />
professionalism in project<br />
development<br />
1) Years per phase not strictly cumulative as some phases overlap<br />
Source: <strong>Roland</strong> <strong>Berger</strong><br />
2013_RBSC_<strong>Offshore</strong>_Wind_Study.pptx<br />
10
B. Value chain evaluation for offshore<br />
Larger turbines will improve <strong>to</strong>tal CAPEX, capacity<br />
fac<strong>to</strong>rs and O&M <strong>cost</strong>s – "Big is beautiful" as LCoE falls<br />
Wind turbines – Size and LCoE<br />
Distance <strong>to</strong> shore [km]<br />
100<br />
80<br />
60<br />
40<br />
20<br />
2030<br />
<strong>2020</strong><br />
10,000<br />
turbines<br />
2012<br />
Jackets<br />
& o<strong>the</strong>rs<br />
2-3 MW<br />
1,500<br />
turbines<br />
Monopiles<br />
4-7 MW<br />
Source: Expert interviews; <strong>Roland</strong> <strong>Berger</strong><br />
Floating<br />
8-10 MW<br />
20 40 60 80 100<br />
Water depth [m]<br />
LEVELIZED COST OF ENERGY (LCoE), OFFSHORE WIND<br />
DRIVER<br />
CAPEX<br />
[EUR m/MW]<br />
Capacity fac<strong>to</strong>r<br />
[%]<br />
Turbine<br />
Balance<br />
of plant<br />
O&M <strong>cost</strong>s<br />
[EUR '000/MW/year]<br />
3 MW<br />
turbines<br />
1.35<br />
2.55<br />
6 MW<br />
turbine<br />
1.55<br />
2.10<br />
IMPROVEMENT<br />
+15%<br />
-18%<br />
-6%<br />
43 48 +12%<br />
140 120 -14%<br />
LCoE 1)<br />
13.4 11.1 -17%<br />
[EUR ct/kwh]<br />
1) Idealized model calculation for newly installed turbines on global average<br />
2013_RBSC_<strong>Offshore</strong>_Wind_Study.pptx<br />
11
WATER DEPTH<br />
B. Value chain evaluation for offshore<br />
Monopiles remain <strong>the</strong> dominant foundation concept,<br />
but trend <strong><strong>to</strong>ward</strong> deeper water is shifting growth <strong>to</strong> jackets<br />
Foundation concepts<br />
MARKET SHARE<br />
FOUNDATION<br />
DEPTH [m]<br />
CUM 2012<br />
TREND <strong>2020</strong><br />
COMMENTS<br />
Gravity-based<br />
foundations<br />
(GBF)<br />
35 m<br />
Floating<br />
> 50<br />
B. Value chain evaluation for offshore<br />
HVDC connections cause delays and <strong>cost</strong> overruns in<br />
Germany – Similar issues may occur in o<strong>the</strong>r markets<br />
Grid connection – Example: Germany<br />
HVDC GRID CLUSTER<br />
BOTTLENECK<br />
HVDC cluster<br />
AC grid connection<br />
I<br />
<strong>Offshore</strong> converter stations<br />
> <strong>On</strong>ly three suppliers: ABB, Siemens, Als<strong>to</strong>m<br />
> Delivery time up from 30 <strong>to</strong> 50 months<br />
II<br />
<strong>Offshore</strong> HVDC cables and cable laying<br />
> <strong>On</strong>ly a few suppliers. Shortages may occur<br />
III<br />
I<br />
AC cable<br />
HVDC cable<br />
II<br />
IV<br />
HVDC converter platform<br />
<strong>Offshore</strong> substation<br />
III<br />
IV<br />
Installation vessels for converter stations<br />
> <strong>On</strong>ly a few vessels can install converter stations >10,000 t<br />
Transmission system opera<strong>to</strong>r (TSO)<br />
> TenneT <strong>to</strong> provide grid connection for all projects in <strong>the</strong><br />
German North Sea (CAPEX approx. EUR 1 bn per GW)<br />
SOLUTIONS IN GERMANY<br />
> Distribution of liability <strong>cost</strong>s <strong>to</strong> electricity cus<strong>to</strong>mers<br />
> Involvement of public institutions and financial inves<strong>to</strong>rs<br />
> Politically backed master plan for offshore grid infrastructure<br />
> Standards for converter stations<br />
Source: Wind-Kraft Journal; TenneT; <strong>Roland</strong> <strong>Berger</strong><br />
2013_RBSC_<strong>Offshore</strong>_Wind_Study.pptx<br />
13
B. Value chain evaluation for offshore<br />
New vessels specifically designed for offshore <strong>wind</strong> will<br />
reduce installation times and <strong>cost</strong>s – Bottleneck resolved<br />
Installation vessels<br />
JACK-UP VESSELS<br />
Application<br />
> <strong>Offshore</strong> <strong>wind</strong> farms are constructed<br />
by jack-up vessels<br />
> Mostly, jack-ups load material in<br />
harbors, carry it <strong>to</strong> site and install it<br />
His<strong>to</strong>ry<br />
> Vessels from offshore oil & gas<br />
industry deployed for first <strong>wind</strong> farm<br />
installations<br />
> Major bottleneck around 2008 for<br />
offshore <strong>wind</strong> installation vessels<br />
> Some 15 new vessels are being built<br />
that are tailored <strong>to</strong> <strong>the</strong> needs of<br />
offshore <strong>wind</strong> energy<br />
DEVELOPMENT<br />
Vessel demand and supply<br />
13<br />
8<br />
23<br />
10<br />
2011 2012<br />
Demand<br />
26<br />
21<br />
24<br />
26<br />
2013 2014 2015<br />
Supply (existing + ordered)<br />
Vessel KPI Trend Benchmark<br />
Deck space [m 2 ] 4,300<br />
Capacity [<strong>to</strong>ns] 8,400<br />
Speed [knots] 13.5<br />
Water depth [m] >45<br />
EXAMPLE: NEW VESSEL<br />
> New generation of installation vessels<br />
specifically designed for offshore <strong>wind</strong><br />
> New vessels such as<br />
<strong>the</strong> "Innovation"<br />
– Are larger in size<br />
(148 m x 42 m)<br />
– Have greater deck<br />
space and s<strong>to</strong>rage capacity<br />
(8,000 t; e.g. 7x6 MW WTG or 12x3<br />
MW WTG, 4 jackets or 7 monopiles)<br />
– Are faster<br />
– Can work in deeper water (50 m)<br />
– Have improved jacking speed<br />
> Faster <strong>wind</strong> turbine installation will<br />
reduce <strong>the</strong> <strong>to</strong>tal <strong>cost</strong> of ownership<br />
NEW GENERATION OF VESSELS<br />
IMPROVED VESSEL PERFORMANCE<br />
REDUCED COSTS<br />
Source: GeoSea; <strong>Roland</strong> <strong>Berger</strong><br />
2013_RBSC_<strong>Offshore</strong>_Wind_Study.pptx<br />
14
B. Value chain evaluation for offshore<br />
O&M concepts for <strong>the</strong> next generation of <strong>wind</strong> farms<br />
are not yet mature – O&M is a key value driver<br />
Operation & maintenance (O&M)<br />
IMPORTANCE OF O&M<br />
KEY O&M VARIABLES<br />
IMPROVEMENT LEVERS<br />
> Efficient, proven O&M concepts are<br />
still not available<br />
> Excellence in O&M is critical <strong>to</strong> a<br />
profitable offshore <strong>wind</strong> business<br />
>O&M approx. 28% of lifetime <strong>cost</strong>s<br />
>10% O&M <strong>cost</strong> reduction delivers<br />
+4% EBIT or +30 bps IRR 1)<br />
>1% increase in availability delivers<br />
+2% EBIT or +15 bps IRR 1)<br />
> O&M offers potential for continuous<br />
improvement over project lifetime<br />
I<br />
II<br />
III<br />
Location of service station<br />
> Station for service personnel onshore<br />
or offshore on service platform<br />
Logistics <strong>to</strong> and on site<br />
> Service vessel concept and potential<br />
use of helicopter<br />
Availability of crane or jack-up<br />
> Adequate access <strong>to</strong> vessels for<br />
replacing large components<br />
> Increased rated power of WTGs reduces<br />
O&M <strong>cost</strong>s per kWh<br />
> Increased reliability of turbines and<br />
components reduces unplanned service<br />
activities<br />
> Geographical clustering of offshore <strong>wind</strong><br />
farms creates synergies<br />
> Increased in-house O&M activity by<br />
utilities will partly or fully replace O&M<br />
turbine manufacturers<br />
Coastline<br />
Distance <strong>to</strong> shore is <strong>the</strong> key parameter for <strong>the</strong> design of O&M concepts<br />
Seabed<br />
Wave height<br />
Water<br />
depth<br />
1) bps = basis points; IRR = internal rate of return<br />
Source: E.ON; DONG; EnBW; <strong>Roland</strong> <strong>Berger</strong><br />
2013_RBSC_<strong>Offshore</strong>_Wind_Study.pptx<br />
15
2013_RBSC_<strong>Offshore</strong>_Wind_Study.pptx<br />
16<br />
C.<br />
<strong>Offshore</strong> potential <strong>to</strong> meet LCoE targets<br />
Utilities – Inves<strong>to</strong>rs – Cost competitiveness – Saving potential – Costs of energy
C. <strong>Offshore</strong> potential <strong>to</strong> meet LCoE targets<br />
Utilities are dominant in farm ownership and operation –<br />
Financial inves<strong>to</strong>rs required <strong>to</strong> finance <strong>the</strong> pipelines<br />
Utilities by capacity and investment model<br />
OFFSHORE CAPACITY [MW]<br />
PIPELINE [MW, EUR]<br />
INVESTMENT MODELS<br />
470<br />
840<br />
800<br />
4,700<br />
2,900<br />
3,400<br />
17 bn<br />
10 bn<br />
12 bn<br />
1<br />
STANDALONE<br />
> <strong>On</strong>e utility owns, develops and operates project<br />
> Utility has full control, but bears all risks<br />
Examples: RWE Innogy 1 (RWE), Amrumbank<br />
West (E.ON), Horns Rev2 (DONG)<br />
160<br />
140<br />
90<br />
7,500<br />
6,000<br />
6,000<br />
27 bn<br />
22 bn<br />
22 bn<br />
2<br />
LEAD INVESTOR<br />
> Leading utility with one or more minority inves<strong>to</strong>rs<br />
> Utility shares risk and reduces equity requirements<br />
Examples: DanTysk (Vattenfall, SWM), Baltic 1<br />
(EnBW, municipal utilities)<br />
25<br />
3<br />
0<br />
1,100<br />
1,000<br />
6,600<br />
4 bn<br />
4 bn<br />
24 bn<br />
3<br />
JOINT VENTURE<br />
> A group of equal players join forces<br />
> Project development by joint venture company<br />
Examples: Egmond aan Zee (Vattenfall, Shell),<br />
Borkum West II (Trainel), C-Power (RWE, EDF,<br />
o<strong>the</strong>rs)<br />
Status as of September 2012; estimated average investment volume for pipeline: EUR 3.6 m per MW<br />
Source: Company websites; 4C<strong>Offshore</strong>; <strong>Roland</strong> <strong>Berger</strong><br />
2013_RBSC_<strong>Offshore</strong>_Wind_Study.pptx<br />
17
C. <strong>Offshore</strong> potential <strong>to</strong> meet LCoE targets<br />
New investment models with better risk-return ratios<br />
required <strong>to</strong> attract more financial inves<strong>to</strong>rs<br />
Inves<strong>to</strong>rs in offshore <strong>wind</strong><br />
WINDFARM OWNERSHIP [%]<br />
Financial inves<strong>to</strong>rs<br />
IPP and<br />
strategic<br />
inves<strong>to</strong>rs<br />
19<br />
11<br />
Approx. 3,600 MW<br />
Source: Company websites; <strong>Roland</strong> <strong>Berger</strong><br />
70<br />
Utilities<br />
Wind farms are owned by utilities, IPPs and strategic<br />
inves<strong>to</strong>rs with a focus on <strong>wind</strong> energy –<br />
only a few "pure" financial inves<strong>to</strong>rs<br />
Trend: Utilities include financial inves<strong>to</strong>rs as minority<br />
inves<strong>to</strong>rs <strong>to</strong> reduce <strong>the</strong>ir own capital expenditure (e.g.<br />
DONG). Interest also expressed by German inves<strong>to</strong>rs such<br />
as Allianz and Munich Re<br />
RISK-RETURN RATIO<br />
RETURN<br />
(IRR)<br />
High<br />
Low<br />
High<br />
PROJECT RISKS<br />
Risk-return ratio unfavorable<br />
> Compared <strong>to</strong> o<strong>the</strong>r options, offshore risks are not<br />
adequately covered by return potential<br />
Three actions <strong>to</strong> improve attractiveness of offshore<br />
> Reduce risk by raising industry professionalism<br />
> Increase profitability by lowering LCoE<br />
> Introduce new investment models (e.g. utility & financial<br />
inves<strong>to</strong>r)<br />
Low<br />
2013_RBSC_<strong>Offshore</strong>_Wind_Study.pptx<br />
18
Share in generation mix<br />
C. <strong>Offshore</strong> potential <strong>to</strong> meet LCoE targets<br />
<strong>Offshore</strong> needs <strong>to</strong> raise its <strong>cost</strong> competitiveness <strong>to</strong><br />
ensure sustainability – Substantial LCoE reduction expected<br />
LCoE 2012 European generation mix [EUR ct/kWh]<br />
25<br />
20<br />
15<br />
10<br />
5<br />
0<br />
Nuclear<br />
Competitive<br />
<strong>cost</strong> level<br />
3-4 4-6<br />
4-6<br />
3-5<br />
5-7<br />
Hard coal<br />
Natural gas<br />
Hydro<br />
Lignite<br />
<strong>On</strong>shore<br />
Note: Competitive <strong>cost</strong> level as a non-weighted average of non-renewable energy sources is 4.9 ct/KWh<br />
6-8<br />
Source: Bloomberg New Energy Finance; IEA; <strong>Roland</strong> <strong>Berger</strong><br />
Biomass<br />
6-12<br />
<strong>Offshore</strong><br />
11-18<br />
<strong>Offshore</strong> target:<br />
9 ct/kWh by <strong>2020</strong><br />
PV<br />
15-21<br />
CSP<br />
18-26<br />
0 5 15 20 LCoE<br />
RECENT STATEMENTS<br />
" A <strong>cost</strong> reduction of 20-30% in<br />
offshore by 2017 is realistic"<br />
(DONG Energy)<br />
" Our LCoE target for all <strong>wind</strong><br />
energy is 5-9 EUR ct/kWh in<br />
<strong>the</strong> medium term"<br />
(Siemens Wind Power)<br />
" Our target: 40% reduction of<br />
offshore CAPEX by 2015"<br />
(E.ON Climate & Renewables)<br />
LCoE REDUCTION<br />
2013_RBSC_<strong>Offshore</strong>_Wind_Study.pptx<br />
19
C. <strong>Offshore</strong> potential <strong>to</strong> meet LCoE targets<br />
WTG <strong>cost</strong>s are 25% of lifetime <strong>cost</strong>s – Project elements<br />
offer fur<strong>the</strong>r potential <strong>to</strong> realize a sustainable <strong>cost</strong> out<br />
Cost & saving potential<br />
390<br />
COST STRUCTURE ['000 EUR/MW]<br />
25% 18% 11% 11% 7% 72% 28% 100%<br />
1,350<br />
WTG<br />
960<br />
620<br />
Foundation Installation<br />
580<br />
Electrics Project<br />
development<br />
3,900<br />
CAPEX<br />
1,500<br />
O&M 1)<br />
5,400<br />
Lifetime<br />
<strong>cost</strong>s<br />
(LTC)<br />
SAVING POTENTIAL<br />
> New turbine technology and innovative<br />
design options (e.g. 2 blade option,<br />
drive train solution, <strong>to</strong>wer concepts)<br />
> Innovative design concepts and use of<br />
standards for serial production<br />
(e.g. new jacket structures)<br />
> Optimized logistics and new installation<br />
concepts (e.g. footprint optimization,<br />
new vessel concepts)<br />
> Standards for converter platforms and<br />
inclusion of new inves<strong>to</strong>rs for grid<br />
connection (e.g. Anbaric & TenneT)<br />
> Increased control of project and<br />
reduction of interface risks (e.g. EPC<br />
models/partnership model)<br />
> Innovative O&M concepts and joint use<br />
of offshore service stations (e.g. SLAs,<br />
asset management strategies)<br />
1) Discounted over 20 years<br />
Source: IHS EER; Project Finance; Erneuerbare Energien; Handelsblatt; <strong>Roland</strong> <strong>Berger</strong><br />
High potential for <strong>cost</strong> reduction<br />
Low potential for <strong>cost</strong> reduction<br />
2013_RBSC_<strong>Offshore</strong>_Wind_Study.pptx<br />
20
C. <strong>Offshore</strong> potential <strong>to</strong> meet LCoE targets<br />
LCoE target of 11 ct/kWh is achievable by 2016<br />
and 9 ct/kWh are targeted by <strong>2020</strong><br />
LCoE forecast<br />
LCoE 1)<br />
offshore<br />
Prerequisites<br />
WTG SIZE<br />
FOUNDATION<br />
O&M<br />
ct/kWh<br />
15<br />
10<br />
5<br />
0<br />
13<br />
Average rated power of<br />
newly installed WTG: 3 MW<br />
Currently available<br />
foundation types<br />
-17%<br />
11<br />
-19%<br />
2012 2016 <strong>2020</strong><br />
Limited experience with<br />
far-shore O&M<br />
Average rated power of<br />
newly installed WTG: 6 MW<br />
Initial savings from improved<br />
foundation concepts<br />
Far-shore experience leads<br />
<strong>to</strong> reduced O&M <strong>cost</strong>s<br />
9<br />
Average rated power of<br />
newly installed WTG: 8 MW<br />
Serial production effects for<br />
selected foundation types<br />
Mature O&M concepts with<br />
minimized <strong>cost</strong> structures<br />
COMMENTS<br />
> Cost level of 9 ct/kWh<br />
should be reached for<br />
new additions in <strong>2020</strong><br />
> <strong>Offshore</strong> will not match<br />
<strong>the</strong> competitive <strong>cost</strong><br />
levels of conventional<br />
energy by <strong>2020</strong><br />
> <strong>Offshore</strong> is on <strong>the</strong><br />
<strong>pathway</strong> <strong>to</strong> <strong>cost</strong><br />
competitiveness, but<br />
fur<strong>the</strong>r time-consuming<br />
efforts are required<br />
> Political support and a<br />
joint industry effort will<br />
be essential for<br />
offshore <strong>to</strong> meet <strong>the</strong><br />
prerequisites and reach<br />
<strong>the</strong> targets<br />
Project development/o<strong>the</strong>r OPEX: O&M, insurance, management<br />
1) Idealized LCoE model calculation for newly installed WTGs on global average<br />
Source: <strong>Roland</strong> <strong>Berger</strong><br />
CAPEX: WTG, foundation, installation, electrics<br />
2013_RBSC_<strong>Offshore</strong>_Wind_Study.pptx<br />
21
2013_RBSC_<strong>Offshore</strong>_Wind_Study.pptx<br />
22<br />
D.<br />
Conclusion<br />
<strong>Offshore</strong> on <strong>the</strong> <strong>pathway</strong> <strong>to</strong> <strong>cost</strong> competitiveness
D. Conclusion<br />
<strong>Offshore</strong> is setting a course <strong><strong>to</strong>ward</strong> product and<br />
operational excellence – Targets are ambitious<br />
<strong>Offshore</strong> – Conclusion<br />
MARKET STABILITY<br />
<strong>Offshore</strong> is a policy-driven market and<br />
depends on public support schemes<br />
Ensure reliability of regulation and<br />
stability of political support<br />
LCoE COMPETITIVENESS<br />
<strong>Offshore</strong> needs <strong>to</strong> become independent of<br />
public support mechanisms (e.g. Renewable<br />
Energy Act) <strong>to</strong> maintain political support<br />
Reduce LCoE <strong>to</strong> 11 ct/kWh by 2016<br />
and 9 ct/kWh by <strong>2020</strong><br />
TECHNOLOGY<br />
<strong>Offshore</strong> is still at an early stage and<br />
combines technologies from different<br />
industries – optimized integration possible<br />
Maintain Europe's technology<br />
leadership and boost innovation<br />
OEM COMPETITION<br />
2012<br />
13<br />
ct/kWh<br />
RISK-RETURN RATIO<br />
New players are entering <strong>the</strong> market and<br />
competition will increase significantly<br />
2016<br />
11<br />
ct/kWh<br />
Achievable margins do not yet<br />
compensate for potential risks<br />
Achieve <strong>cost</strong> competitiveness driven<br />
by product excellence<br />
<strong>2020</strong><br />
9<br />
ct/kWh<br />
Improve risk-return ratio and develop<br />
new investment models<br />
Source: <strong>Roland</strong> <strong>Berger</strong><br />
2013_RBSC_<strong>Offshore</strong>_Wind_Study.pptx<br />
23
D. Conclusion<br />
<strong>Offshore</strong> is on <strong>the</strong> <strong>pathway</strong> <strong>to</strong> <strong>cost</strong> competitiveness –<br />
Joint efforts are required in this young industry sec<strong>to</strong>r<br />
<strong>Offshore</strong> – The journey <strong>to</strong> maturity<br />
<strong>Offshore</strong> maturity cycle<br />
Joint efforts <strong>to</strong> achieve <strong>cost</strong> competitiveness<br />
OFFSHORE<br />
MATURITY<br />
Turbine<br />
manufacturers<br />
Foundation<br />
suppliers<br />
Grid<br />
suppliers<br />
Construction<br />
companies<br />
Utilities/<br />
opera<strong>to</strong>rs<br />
Banks/<br />
inves<strong>to</strong>rs<br />
> Focus on innovation <strong>to</strong> achieve product excellence<br />
> Optimize processes <strong>to</strong> enable a rigorous <strong>cost</strong> out<br />
> Explore new technologies and foundation concepts<br />
> Drive standardization efforts <strong>to</strong> achieve scale effects<br />
> Develop solutions <strong>to</strong> guarantee timely grid connection<br />
> Include new inves<strong>to</strong>rs on a project basis<br />
> Reduce interface risks through partnership models<br />
> Develop EPC models <strong>to</strong> offer turnkey solutions<br />
> Increase control over project development<br />
> Incentivize OEMs and suppliers <strong>to</strong> drive out <strong>cost</strong>s<br />
> Develop investment models with larger utilities<br />
> Attract new inves<strong>to</strong>r groups <strong>to</strong> <strong>the</strong> sec<strong>to</strong>r<br />
Source: <strong>Roland</strong> <strong>Berger</strong><br />
2013_RBSC_<strong>Offshore</strong>_Wind_Study.pptx<br />
24
2013_RBSC_<strong>Offshore</strong>_Wind_Study.pptx<br />
25