internal cooling for the blow molding industry - Blow Moulding Controls
internal cooling for the blow molding industry - Blow Moulding Controls
internal cooling for the blow molding industry - Blow Moulding Controls

Create successful ePaper yourself
Turn your PDF publications into a flip-book with our unique Google optimized e-Paper software.
The third test (right side of <strong>the</strong> illustration) was per<strong>for</strong>med with <strong>the</strong> same chilled water temperature in <strong>the</strong> mold and <strong>the</strong> same compressed<br />
air temperature but <strong>the</strong> <strong>cooling</strong> time was cut down to 5.2 seconds. The total cycle time dropped down accordingly to 8.2 seconds. The<br />
overall temperature level was just a little under <strong>the</strong> values measured in <strong>the</strong> conventional process and <strong>the</strong> temperature of both <strong>the</strong> inner<br />
and <strong>the</strong> outer surfaces was identical but just a little higher. The temperature distribution across <strong>the</strong> wall showed a peak in <strong>the</strong> middle of<br />
<strong>the</strong> wall.<br />
The production in <strong>the</strong> first test was at a rate of 327 bottles per hour but in <strong>the</strong> last test <strong>the</strong> production rate increased by 33% to 440 bottles<br />
per hour.<br />
Samples were collected in all tests and <strong>the</strong> bottle dimensions were set in a comparison which clearly showed that <strong>the</strong> best dimension<br />
stability was achieved during <strong>the</strong> second test followed by <strong>the</strong> samples of <strong>the</strong> third test and <strong>the</strong> samples collected during <strong>the</strong> conventional<br />
process with stagnant air were behind.<br />
Load tests and drop tests were per<strong>for</strong>med and here <strong>the</strong> results were identical with those of <strong>the</strong> dimension tests.<br />
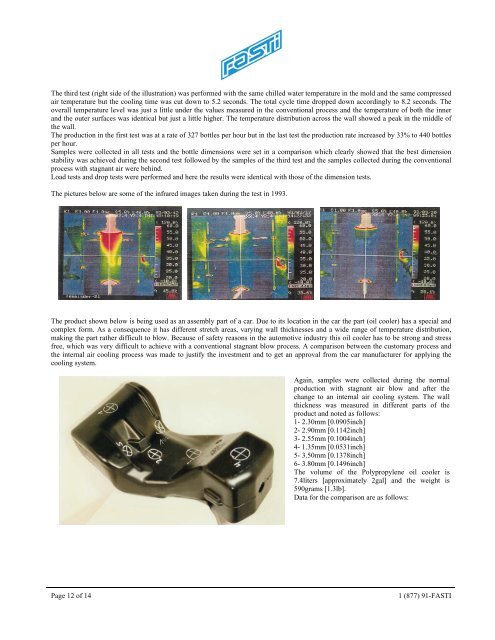
The pictures below are some of <strong>the</strong> infrared images taken during <strong>the</strong> test in 1993.<br />
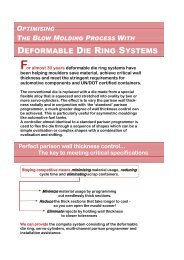
The product shown below is being used as an assembly part of a car. Due to its location in <strong>the</strong> car <strong>the</strong> part (oil cooler) has a special and<br />
complex <strong>for</strong>m. As a consequence it has different stretch areas, varying wall thicknesses and a wide range of temperature distribution,<br />
making <strong>the</strong> part ra<strong>the</strong>r difficult to <strong>blow</strong>. Because of safety reasons in <strong>the</strong> automotive <strong>industry</strong> this oil cooler has to be strong and stress<br />
free, which was very difficult to achieve with a conventional stagnant <strong>blow</strong> process. A comparison between <strong>the</strong> customary process and<br />
<strong>the</strong> <strong>internal</strong> air <strong>cooling</strong> process was made to justify <strong>the</strong> investment and to get an approval from <strong>the</strong> car manufacturer <strong>for</strong> applying <strong>the</strong><br />
<strong>cooling</strong> system.<br />
Again, samples were collected during <strong>the</strong> normal<br />
production with stagnant air <strong>blow</strong> and after <strong>the</strong><br />
change to an <strong>internal</strong> air <strong>cooling</strong> system. The wall<br />
thickness was measured in different parts of <strong>the</strong><br />
product and noted as follows:<br />
1- 2.30mm [0.0905inch]<br />
2- 2.90mm [0.1142inch]<br />
3- 2.55mm [0.1004inch]<br />
4- 1.35mm [0.0531inch]<br />
5- 3.50mm [0.1378inch]<br />
6- 3.80mm [0.1496inch]<br />
The volume of <strong>the</strong> Polypropylene oil cooler is<br />
7.4liters [approximately 2gal] and <strong>the</strong> weight is<br />
590grams [1.3lb].<br />
Data <strong>for</strong> <strong>the</strong> comparison are as follows:<br />
Page 12 of 14<br />
1 (877) 91-FASTI