MarketView Chicago Downtown Office Q3/2005 - Crain's Chicago ...
MarketView Chicago Downtown Office Q3/2005 - Crain's Chicago ...
MarketView Chicago Downtown Office Q3/2005 - Crain's Chicago ...

Create successful ePaper yourself
Turn your PDF publications into a flip-book with our unique Google optimized e-Paper software.
<strong>MarketView</strong><br />
<strong>Chicago</strong> <strong>Downtown</strong> <strong>Office</strong><br />
““Dominating the<br />
leasing activity are<br />
law firms and<br />
professional<br />
services firms,<br />
which are the only<br />
industries keeping<br />
the vacancy rate<br />
from rising<br />
significantly.”<br />
QUICK STATS<br />
Vacancy 15.7%<br />
Lease Rates<br />
$29.05 G<br />
Net Absorption* (586,154)<br />
Construction<br />
Current<br />
1.32 msf<br />
“<br />
Change from last<br />
Yr.<br />
Qtr.<br />
* The arrows are trend indicators over the specified time period and do not<br />
represent a positive or negative value. (e.g., absorption could be negative,<br />
but still represent a positive trend over a specified period.)<br />
HOT TOPICS<br />
• A lack of new space<br />
requirements or<br />
expansions contributed to<br />
an increased vacancy rate<br />
of 15.7%, up from 15.5%<br />
at second quarter.<br />
• Year-to-date net<br />
absorption registered<br />
negative 254,664 square<br />
feet at the quarter-lower<br />
when compared to the<br />
same period last year.<br />
• Boeing Co. is under<br />
contract to purchase its<br />
riverfront headquarters at<br />
100 N. Riverside Plaza for<br />
$165 million.<br />
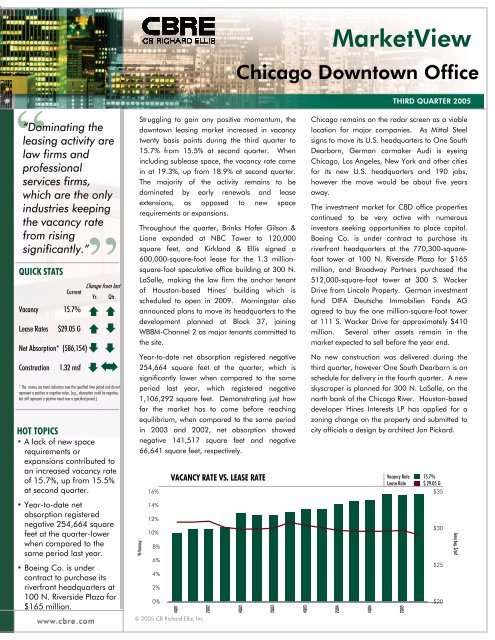
Struggling to gain any positive momentum, the<br />
downtown leasing market increased in vacancy<br />
twenty basis points during the third quarter to<br />
15.7% from 15.5% at second quarter. When<br />
including sublease space, the vacancy rate came<br />
in at 19.3%, up from 18.9% at second quarter.<br />
The majority of the activity remains to be<br />
dominated by early renewals and lease<br />
extensions, as opposed to new space<br />
requirements or expansions.<br />
Throughout the quarter, Brinks Hofer Gilson &<br />
Lione expanded at NBC Tower to 120,000<br />
square feet, and Kirkland & Ellis signed a<br />
600,000-square-foot lease for the 1.3 millionsquare-foot<br />
speculative office building at 300 N.<br />
LaSalle, making the law firm the anchor tenant<br />
of Houston-based Hines’ building which is<br />
scheduled to open in 2009. Morningstar also<br />
announced plans to move its headquarters to the<br />
development planned at Block 37, joining<br />
WBBM-Channel 2 as major tenants committed to<br />
the site.<br />
Year-to-date net absorption registered negative<br />
254,664 square feet at the quarter, which is<br />
significantly lower when compared to the same<br />
period last year, which registered negative<br />
1,106,292 square feet. Demonstrating just how<br />
far the market has to come before reaching<br />
equilibrium, when compared to the same period<br />
in 2003 and 2002, net absorption showed<br />
negative 141,517 square feet and negative<br />
66,641 square feet, respectively.<br />
% Vacancy<br />
16%<br />
14%<br />
12%<br />
10%<br />
8%<br />
6%<br />
4%<br />
2%<br />
0%<br />
© <strong>2005</strong> CB Richard Ellis, Inc.<br />
THIRD QUARTER <strong>2005</strong><br />
<strong>Chicago</strong> remains on the radar screen as a viable<br />
location for major companies. As Mittal Steel<br />
signs to move its U.S. headquarters to One South<br />
Dearborn, German carmaker Audi is eyeing<br />
<strong>Chicago</strong>, Los Angeles, New York and other cities<br />
for its new U.S. headquarters and 190 jobs,<br />
however the move would be about five years<br />
away.<br />
The investment market for CBD office properties<br />
continued to be very active with numerous<br />
investors seeking opportunities to place capital.<br />
Boeing Co. is under contract to purchase its<br />
riverfront headquarters at the 770,300-squarefoot<br />
tower at 100 N. Riverside Plaza for $165<br />
million, and Broadway Partners purchased the<br />
512,000-square-foot tower at 300 S. Wacker<br />
Drive from Lincoln Property. German investment<br />
fund DIFA Deutsche Immobilien Fonds AG<br />
agreed to buy the one million-square-foot tower<br />
at 111 S. Wacker Drive for approximately $410<br />
million. Several other assets remain in the<br />
market expected to sell before the year end.<br />
No new construction was delivered during the<br />
third quarter, however One South Dearborn is on<br />
schedule for delivery in the fourth quarter. A new<br />
skyscraper is planned for 300 N. LaSalle, on the<br />
north bank of the <strong>Chicago</strong> River. Houston-based<br />
developer Hines Interests LP has applied for a<br />
zoning change on the property and submitted to<br />
city officials a design by architect Jon Pickard.<br />
VACANCY RATE VS. LEASE RATE Vacancy Rate 15.7%<br />
Lease Rate $ 29.05 G<br />
4Q01<br />
2Q02<br />
4Q02<br />
2Q03<br />
4Q03<br />
2Q04<br />
4Q04<br />
2Q05<br />
$35<br />
$30<br />
$25<br />
$20<br />
Gross Avg. $/psf
CB Richard Ellis | <strong>Chicago</strong> <strong>Downtown</strong> <strong>Office</strong> | 3Q <strong>2005</strong><br />
Market<br />
Rentable<br />
Area<br />
Direct<br />
Vacancy<br />
Rate %<br />
Net<br />
Absorption<br />
SF<br />
Under<br />
Construction SF<br />
Average Asking<br />
Net Lease Rate $<br />
SF/YR<br />
Overall Vacancy<br />
Rate%*<br />
West Loop 39,913,855 16.3% 9,976 470,000 21.1%<br />
Class A 26,172,378 15.2% (1,027) 470,000 $15-$28 20.2%<br />
Class B 9,394,268 19.0% 99,511 — $7-$14 24.5%<br />
Class C 4,347,209 17.5% (88,508) — $6-$12 18.9%<br />
Central Loop 40,763,262 13.8% (270,977) 850,000 16.7%<br />
Class A 15,255,623 15.6% (106,008) 850,000 $12-$28 20.6%<br />
Class B 16,627,236 10.5% 89,452 — $7-$13 12.6%<br />
Class C 8,880,403 16.9% (254,421) — $5-$10 17.5%<br />
East Loop 21,652,474 18.6% (305,398) — 21.5%<br />
Class A 5,930,836 22.6% (242,852) — $11-$21 28.1%<br />
Class B 10,082,835 20.6% (14,235) — $7-$14 23.0%<br />
Class C 5,638,803 10.8% (48,311) — $5-$10 11.7%<br />
North Michigan 11,860,446 11.8% (62,118) — 14.4%<br />
Class A 4,357,168 13.7% (20,748) — $11-$21 16.6%<br />
Class B 6,685,711 11.3% 7,665 — $8-$15 14.2%<br />
Class C 817,567 4.6% (49,035) — $7-$13 4.6%<br />
River North 4,455,052 25.2% 42,363 — 30.5%<br />
Class A 382,436 25.7% 0 — $10-$16 25.7%<br />
Class B 2,459,111 33.1% 52,043 — $8-$13 42.2%<br />
Class C 1,613,505 13.1% (9,680) — $6-$11 13.8%<br />
<strong>Chicago</strong> CBD 118,645,089 15.7% (586,154) 1,320,000 19.3%<br />
* Includes Sublease Space<br />
UNEMPLOYMENT RATE<br />
8.0%<br />
7.0%<br />
6.0%<br />
5.0%<br />
4.0%<br />
3.0%<br />
<strong>Chicago</strong> 6.4%<br />
IL State 6.1%<br />
US 4.9%<br />
Although the U.S. economic picture remained relatively<br />
unchanged for the most part, according to recent<br />
statistical measures, Illinois continues to see steady<br />
growth. The Bureau of Labor Statistics of the U.S.<br />
Department of Labor reported that non-farm<br />
employment dipped slightly by 35,000 in September and<br />
the unemployment rate was virtually unchanged at 4.8%.<br />
According to the Commerce Department, real gross<br />
domestic product (GDP) increased at an annual rate of<br />
3.3% in the second quarter of <strong>2005</strong>, down from 3.8% at<br />
first quarter <strong>2005</strong>.<br />
2.0%<br />
1.0%<br />
0.0%<br />
4Q02<br />
1Q03<br />
2Q03<br />
3Q03<br />
4Q03<br />
1Q04<br />
2Q04<br />
3Q04<br />
4Q04<br />
1Q05<br />
2Q05<br />
3Q05<br />
Illinois’ employment picture showed improvement in third<br />
quarter as it posted an unemployment rate of 5.7%,<br />
down from 6.2% at second quarter, reported the Illinois<br />
Department of Employment Security. This was the<br />
seventh consecutive month of job growth, bringing<br />
57,300 new jobs to the area since January.<br />
© <strong>2005</strong> CB Richard Ellis, Inc.
CB Richard Ellis | <strong>Chicago</strong> <strong>Downtown</strong> <strong>Office</strong> | 3Q <strong>2005</strong><br />
VACANCY & NET ABSORPTION<br />
Absorption sf (586,154)<br />
Vacancy 15.7%<br />
AVERAGE ASKING LEASE RATES<br />
1,000.0<br />
20.0%<br />
Absorption sf (000's)<br />
600.0<br />
200.0<br />
(200.0)<br />
(600.0)<br />
(1,000.0)<br />
(1,400.0)<br />
$30.00<br />
18.0%<br />
16.0%<br />
14.0%<br />
12.0%<br />
Vacancy %<br />
Gross Avg. Asking Rent<br />
$25.00<br />
$20.00<br />
(1,800.0)<br />
1Q03<br />
2Q03<br />
3Q03<br />
4Q03<br />
1Q04<br />
2Q04<br />
3Q04<br />
4Q04<br />
1Q05<br />
2Q05<br />
3Q05<br />
10.0%<br />
$15.00<br />
2000<br />
2001<br />
2002<br />
2003<br />
2004<br />
1Q<strong>2005</strong><br />
2Q<strong>2005</strong><br />
3Q<strong>2005</strong><br />
Sq. Ft. Under Construction<br />
Overall, the CBD vacancy rate increased by 0.2% at third quarter to<br />
15.7% from 15.5% at second quarter. The East Loop submarket showed<br />
the largest increase in vacancy during the quarter at 18.6%, up from<br />
17.2% at second quarter. This is attributed to Deloitte & Touche<br />
vacating space 180 North Stetson and several tenants vacating Aon<br />
Center. Both the Central Loop and North Michigan Avenue submarket<br />
increased in vacancy to 13.8% and 11.8%, respectively, while the West<br />
Loop decreased to 16.3%.<br />
Net absorption for the quarter came in at negative 586,154 square feet<br />
and negative 254,664 square feet year-to-date. The West Loop and<br />
River North submarkets were the only to post positive net absorption at<br />
9,976 square feet and 42,363 square feet, respectively. Year-to-date,<br />
the net absorption is much lower when compared to the same period in<br />
2004 which reported negative 1,106,292 square feet.<br />
CONSTRUCTION ACTIVITY<br />
6,000,000<br />
5,000,000<br />
4,000,000<br />
3,000,000<br />
2,000,000<br />
1,000,000<br />
0<br />
2001<br />
2002<br />
2003<br />
No new buildings were delivered in the third quarter, however, One S.<br />
Dearborn is on schedule to bring over 850,000 square feet to the market<br />
in the fourth quarter. Hines Interests LP submitted plans for a new<br />
skyscraper located at 300 N. LaSalle in the CBD to be designed by<br />
architect Jon Pickard. The year has already experienced over 2.5 million<br />
square feet of new construction year-to-date and by year-end this number<br />
will be more than 2004 and 2003 combined.<br />
2004<br />
1Q<strong>2005</strong><br />
2Q<strong>2005</strong><br />
3Q<strong>2005</strong><br />
Average asking net lease rates remained relatively unchanged during<br />
the quarter. For Class A space, the average asking net lease rate<br />
increased for the West and Central Loop submarkets reporting $15-$28<br />
per square foot. The East Loop, North Michigan Ave and River North<br />
submarkets showed the same average net lease rates as second quarter<br />
reporting $11-$21, $11-$21 and $10-$16, respectively. The tenants<br />
market will continue until a marked improvement is made in the vacancy<br />
rate. Concessions are abundant such as free rent and construction<br />
allowances.<br />
MARKET OUTLOOK<br />
With only one quarter remaining in <strong>2005</strong>, the<br />
<strong>Chicago</strong> downtown office market will continue its<br />
pattern of little to no improvement. Without job<br />
growth or new business, the market will be unable<br />
to overcome the current oversupply of office space<br />
both new and old thus remaining in its current state<br />
of high vacancy and negative net absorption.<br />
The delivery of One S. Dearborn will no doubt<br />
impact the overall CBD as tenants leave holes in<br />
other buildings to relocate into the new tower. With<br />
its delivery also comes over 275,000 square feet of<br />
vacant space.<br />
The investment market will remain active<br />
throughout the rest of the year with several other<br />
buildings changing hands before year end at low<br />
cap rates and high prices per square foot.<br />
© <strong>2005</strong> CB Richard Ellis, Inc.
<strong>MarketView</strong> | <strong>Chicago</strong> <strong>Downtown</strong> <strong>Office</strong> | 3Q <strong>2005</strong><br />
TOP CHICAGO LEASE TRANSACTIONS<br />
Size (sf) Tenant Address<br />
600,000 Kirkland & Ellis 300 North LaSalle Street<br />
185,000 Morningstar Block 37<br />
90,000 Barton Brands Ltd. 1 South Dearborn Street<br />
63,880 O’Hagen, Smith & Amundsen 150 North Michigan Avenue<br />
55,000 USG 550 West Adams Street<br />
51,929 CATS/NIPC 233 South Wacker Drive<br />
36,010 Chuhak & Tecson 30 South Wacker Drive<br />
CHICAGO SUBMARKET MAP<br />
NET LEASES<br />
Includes all lease types whereby the tenant pays an agreed<br />
rent plus most, or all, of the operating expenses and taxes for<br />
the property, including utilities, insurance and/or maintenance<br />
expenses.<br />
MARKET COVERAGE<br />
Includes all competitive office buildings 20,000 sf and greater<br />
in size.<br />
NET ABSORPTION<br />
The change in occupied square feet from one period to the<br />
next.<br />
NET RENTABLE AREA<br />
The gross building square footage minus the elevator core,<br />
flues, pipe shafts, vertical ducts, balconies, and stairwell areas.<br />
OCCUPIED SQUARE FEET<br />
Building area not considered vacant.<br />
UNDER CONSTRUCTION<br />
Buildings which have begun construction as evidenced by site<br />
excavation or foundation work.<br />
VACANT SQUARE FEET<br />
Existing Building Area which is physically vacant or<br />
immediately available.<br />
VACANCY RATE<br />
Vacant Building Feet divided by the Net Rentable Area.<br />
OVERALL VACANCY RATE<br />
Vacant Building Feet plus sublease space divided by the Net<br />
Rentable Area.<br />
© Copyright <strong>2005</strong> CB Richard Ellis (CBRE) Statistics contained herein may represent a different data set than that used to generate National Vacancy and<br />
Availability Index statistics published by CB Richard Ellis’ Corporate Communications Department or CB Richard Ellis’ research and Econometric<br />
Forecasting unit, Torto Wheaton Research. Information herein has been obtained from sources believed reliable. While we do not doubt its accuracy, we<br />
have not verified it and make no guarantee, warranty or representation about it. It is your responsibility to independently confirm its accuracy and<br />
completeness. Any projections, opinions, assumptions or estimates used are for example only and do not represent the current or future performance of<br />
the market. This information is designed exclusively for use by CB Richard Ellis clients, and cannot be reproduced without prior written permission of<br />
CB Richard Ellis.<br />
For more information regarding the<br />
<strong>MarketView</strong>, please contact:<br />
Allison Johnson or Jamie Haas, <strong>Office</strong> Research<br />
Group<br />
CB Richard Ellis<br />
311 South Wacker Drive, Suite 400, <strong>Chicago</strong>, Illinois 60606<br />
T. 312.935.1400 • F. 312.935.1880<br />
allison.johnson@cbre.com | jamie.haas@cbre.com