Investigation 1 Additional Practice - Canton Local Schools
Investigation 1 Additional Practice - Canton Local Schools
Investigation 1 Additional Practice - Canton Local Schools

You also want an ePaper? Increase the reach of your titles
YUMPU automatically turns print PDFs into web optimized ePapers that Google loves.
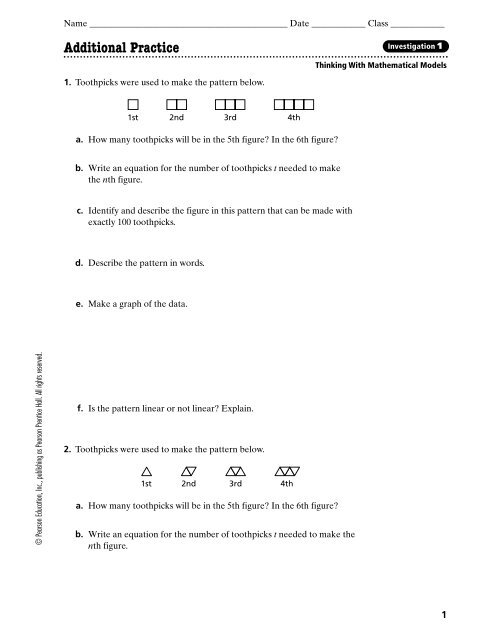
Name ____________________________________________ Date ____________ Class ____________<br />
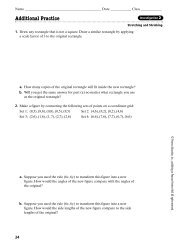
<strong>Additional</strong> <strong>Practice</strong><br />
<strong>Investigation</strong> 1<br />
Thinking With Mathematical Models<br />
1. Toothpicks were used to make the pattern below.<br />
1st 2nd 3rd 4th<br />
a. How many toothpicks will be in the 5th figure? In the 6th figure?<br />
b. Write an equation for the number of toothpicks t needed to make<br />
the nth figure.<br />
c. Identify and describe the figure in this pattern that can be made with<br />
exactly 100 toothpicks.<br />
d. Describe the pattern in words.<br />
e. Make a graph of the data.<br />
© Pearson Education, Inc., publishing as Pearson Prentice Hall. All rights reserved.<br />
f. Is the pattern linear or not linear? Explain.<br />
2. Toothpicks were used to make the pattern below.<br />
1st 2nd 3rd 4th<br />
a. How many toothpicks will be in the 5th figure? In the 6th figure?<br />
b. Write an equation for the number of toothpicks t needed to make the<br />
nth figure.<br />
1
© Pearson Education, Inc., publishing as Pearson Prentice Hall. All rights reserved.<br />
Name ____________________________________________ Date ____________ Class ____________<br />
<strong>Additional</strong> <strong>Practice</strong> (continued)<br />
<strong>Investigation</strong> 1<br />
Thinking With Mathematical Models<br />
c. Identify and describe the figure in this pattern that can be made with<br />
exactly 61 toothpicks.<br />
d. Describe the pattern in words.<br />
e. Make a graph of the data.<br />
f. Is the pattern linear or not linear? Explain.<br />
3. Square tiles were used to make the pattern below.<br />
1st 2nd 3rd 4th<br />
a. How many tiles will be in the 5th figure? In the 6th figure?<br />
b. Write an equation for the number of tiles t needed to make the nth figure.<br />
c. Identify and describe the figure in this pattern that can be made with<br />
exactly 25 tiles.<br />
d. Describe the pattern in words.<br />
2
Name ____________________________________________ Date ____________ Class ____________<br />
<strong>Additional</strong> <strong>Practice</strong> (continued)<br />
<strong>Investigation</strong> 1<br />
Thinking With Mathematical Models<br />
e. Make a graph of the data.<br />
f. Is the pattern linear or not linear? Explain.<br />
4. Square tiles were used to make the pattern below.<br />
1st 2nd 3rd 4th<br />
a. How many tiles will be in the 5th figure? In the 6th figure?<br />
b. Write an equation for the number of tiles t needed to make the nth figure.<br />
© Pearson Education, Inc., publishing as Pearson Prentice Hall. All rights reserved.<br />
c. Identify and describe the figure in this pattern that can be made with<br />
exactly 420 tiles.<br />
d. Describe the pattern in words.<br />
e. Make a graph of the data.<br />
f. Is the pattern linear or not linear? Explain.<br />
3
© Pearson Education, Inc., publishing as Pearson Prentice Hall. All rights reserved.<br />
Name ____________________________________________ Date ____________ Class ____________<br />
<strong>Additional</strong> <strong>Practice</strong> (continued)<br />
<strong>Investigation</strong> 1<br />
5. a. Make a graph of the data. Draw a line to show the trend and write an<br />
equation for the line. This group used construction paper for their bridges.<br />
Bridge-Thickness Data<br />
Thinking With Mathematical Models<br />
Thickness (layers)<br />
1<br />
2<br />
3<br />
4<br />
5<br />
6<br />
Breaking Weight (pennies)<br />
24<br />
38<br />
50<br />
67<br />
78<br />
93<br />
b. Predict the breaking weight of a bridge made from 14 layers of<br />
construction paper.<br />
6. a. Complete the table using the graph:<br />
10<br />
Squash Plant Production<br />
y<br />
Day<br />
Total Number of Squash<br />
15 16 17 18 19<br />
Number of Squash<br />
8<br />
6<br />
4<br />
2<br />
O 2 6 10 14 18<br />
Days After Planting<br />
x<br />
b. If the pattern continues, what is the total number of squash that would be<br />
produced by day 22? By day 26?<br />
4
Name ____________________________________________ Date ____________ Class ____________<br />
<strong>Additional</strong> <strong>Practice</strong> (continued)<br />
<strong>Investigation</strong> 1<br />
Thinking With Mathematical Models<br />
c. Describe the pattern in words. What can you say about the number of<br />
squash produced each day?<br />
d. Describe the pattern with an equation. What does the coefficient of x mean<br />
in this situation?<br />
7. Betty went to the store to buy pepper. There were three different jars on<br />
the shelf:<br />
1 ounce jar costs $0.65, 4 ounce jar costs $1.40, 8 ounce jar costs $2.40<br />
a. Make a table and draw a graph for these data.<br />
© Pearson Education, Inc., publishing as Pearson Prentice Hall. All rights reserved.<br />
b. Predict the cost of 2 ounces, 3 ounces, and 6 ounces.<br />
c. Describe the pattern in words. What can you say about the cost of a jar?<br />
What can you say about the cost of an ounce of pepper alone?<br />
d. Describe the pattern with an equation. What information do the variables<br />
and numbers represent?<br />
5