State of Nature report - RSPB
State of Nature report - RSPB
State of Nature report - RSPB

You also want an ePaper? Increase the reach of your titles
YUMPU automatically turns print PDFs into web optimized ePapers that Google loves.
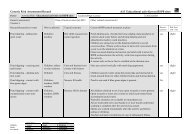
METHODS<br />
<br />
his section outlines the data sources and methods used in this <strong>report</strong>. There are two types <strong>of</strong> data presented: trends in<br />
species’ abundance or distribution, and an assessment <strong>of</strong> species’ extinction risk following IUCN guidelines on National<br />
Red Lists. Summaries <strong>of</strong> both types <strong>of</strong> information are presented in the “Facts behind the headlines” section and in each<br />
habitat chapter. In addition, we present a new Watchlist Indicator on priority species, generated from abundance trends for<br />
some <strong>of</strong> the species deemed to be <strong>of</strong> conservation priority in the UK.<br />
<br />
For this analysis, we collated as many datasets as possible on<br />
changes in the abundance or distribution <strong>of</strong> species across<br />
the UK. Many <strong>of</strong> these datasets are derived from annual or<br />
periodic surveys, but we also included trends based on the<br />
opportunistic recording data collected by National Recording<br />
Schemes, covering many taxonomic groups 1 . A full list <strong>of</strong> the<br />
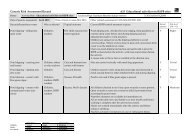
datasets included in the analysis is given in the table (right).<br />
Our analysis was in two parts. First we allocated each species<br />
for which we had a trend in abundance or range into one <strong>of</strong><br />
four categories, according to the criteria below. Secondly,<br />
we collated information about which habitats each species<br />
was associated with: a species may be included in the<br />
assessment for more than one habitat. This allowed us to<br />
assess how many species within a taxonomic group, within<br />
a habitat, or overall, were increasing or decreasing.<br />
The figures are colour-coded to show the proportion <strong>of</strong><br />
assessed species that were slightly increasing, strongly<br />
increasing, slightly decreasing or strongly decreasing.<br />
In total, we had assessments <strong>of</strong> trend for only about 5%<br />
<strong>of</strong> the UK’s species <strong>of</strong> plants and animals, but this proportion<br />
varied between different taxonomic groups and habitats.<br />
<br />
The datasets we <strong>report</strong> on cover a variety <strong>of</strong> time periods<br />
from 1960 onwards. In order to be able to compare species<br />
trends assessed over different time periods, we calculated<br />
both the total change over the period assessed and the<br />
annual change, in either relative or absolute abundance.<br />
Total change:<br />
Abundance (final year) / Abundance (first year)<br />
Average annual change:<br />
Percentage annual change in abundance over the time<br />
period monitored. This was assumed to be constant<br />
over the monitored period.<br />
We placed each species into one <strong>of</strong> the four trend<br />
categories using these definitions:<br />
Strongly increasing:<br />
The estimate <strong>of</strong> total change is two or greater,<br />
meaning that the population has doubled over the<br />
time period monitored, OR if the annual change is<br />
more than 0.0281, the rate <strong>of</strong> change that would lead<br />
to a population doubling or more over 25 years.<br />
Slightly increasing:<br />
Total change and annual change are greater than zero, but<br />
the species does not meet the criteria for strongly increasing.<br />
Strongly decreasing:<br />
The estimate <strong>of</strong> total change is 0.5 or less, meaning that<br />
the population has halved over the time period monitored,<br />
OR the annual change is less than -0.0273, the rate<br />
<strong>of</strong> change that would lead to a population halving or<br />
more over 25 years.<br />
Slightly decreasing:<br />
The estimate <strong>of</strong> total change and annual change are less<br />
than zero, but the species does not meet the criteria for<br />
strongly decreasing.<br />
We did not use statistical tests <strong>of</strong> significance in defining<br />
trends into the four categories above.<br />
<br />
For many taxonomic groups, data are not available to assess<br />
changes in abundance over time; however, data are available<br />
about their distribution. This is primarily in the form <strong>of</strong> atlases<br />
and from national and local biological recording schemes.<br />
<br />
Two atlases <strong>of</strong> flowering plants have been produced and for<br />
each species an index was calculated assessing the change<br />
in distribution at the scale <strong>of</strong> 10 km atlas grid squares 2 .<br />
This index is a relative measure <strong>of</strong> change and does not tell us<br />
by how much a species’ distribution has changed in absolute<br />
terms, because <strong>of</strong> the need to take into account changes in<br />
recording effort over time. We placed each species into one<br />
<strong>of</strong> the four trend categories using the definitions below.<br />
The cut-<strong>of</strong>fs at ±0.5 follows Preston et al 2003 3 .<br />
Strongly increasing:<br />
Plant Atlas Change Index <strong>of</strong> 0.5 or greater<br />
Slightly increasing:<br />
Plant Atlas Change Index <strong>of</strong> between 0 and 0.5<br />
Slightly decreasing:<br />
Plant Atlas Change Index <strong>of</strong> between 0 and -0.5<br />
Strongly decreasing:<br />
Plant Atlas Change Index <strong>of</strong> -0.5 or less<br />
78 STATE OF NATURE 2013