Closing The Gap - Food and Drink Industry Ireland
Closing The Gap - Food and Drink Industry Ireland
Closing The Gap - Food and Drink Industry Ireland

Create successful ePaper yourself
Turn your PDF publications into a flip-book with our unique Google optimized e-Paper software.
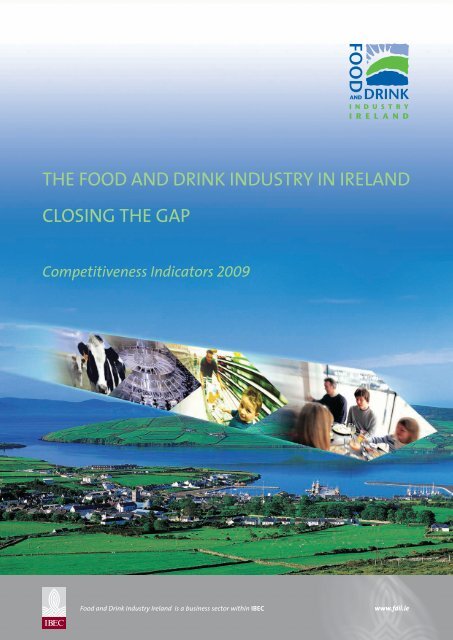
THE FOOD AND DRINK INDUSTRY IN IRELAND<br />
CLOSING THE GAP<br />
Competitiveness Indicators 2009<br />
<strong>Food</strong> <strong>and</strong> <strong>Drink</strong> <strong>Industry</strong> Irel<strong>and</strong> is a business sector within IBEC<br />
www.fdii.ie
IBEC is the voice of Irish business <strong>and</strong> employers both nationally <strong>and</strong> internationally. It is the umbrella body<br />
for Irel<strong>and</strong>’s leading business <strong>and</strong> industry groups <strong>and</strong> associations. IBEC represents more than<br />
7,500 member organisations, of all sizes, in all regions <strong>and</strong> across all industry sectors.<br />
With acknowledged expertise in all aspects of business representation, policy development, employee relations,<br />
human resources, employment law, environment, health <strong>and</strong> safety, trade <strong>and</strong> EU affairs, IBEC is uniquely<br />
positioned to provide indispensible, tailored advice to members. To learn more, contact IBEC on www.ibec.ie<br />
IBEC MISSION<br />
IBEC promotes the interests of business <strong>and</strong> employers in Irel<strong>and</strong> by working to foster the<br />
continuing development of a competitive environment that encourages sustainable<br />
growth, <strong>and</strong> within which both enterprise <strong>and</strong> people can flourish.
THE FOOD AND DRINK<br />
INDUSTRY IN IRELAND<br />
<strong>Closing</strong> <strong>The</strong> <strong>Gap</strong><br />
<strong>The</strong> <strong>Food</strong> <strong>and</strong> <strong>Drink</strong> <strong>Industry</strong> in Irel<strong>and</strong> - Competitiveness Indicators • page 1
CONTENTS<br />
Summary <strong>and</strong> recommendations .................................................................................................................................................................................. 3<br />
Economic value of the food <strong>and</strong> drink sector ........................................................................................................................................................ 4<br />
A. Main competitiveness indicators ............................................................................................................................................................................. 5<br />
B. Business input costs <strong>and</strong> agricultural raw materials ................................................................................................................................<br />
7<br />
C. R&D investment <strong>and</strong> innovation performance .............................................................................................................................................. 9<br />
D. Trade performance .............................................................................................................................................................................................................. 11<br />
E. Retail buying power ........................................................................................................................................................................................................... 12<br />
<strong>The</strong> <strong>Food</strong> <strong>and</strong> <strong>Drink</strong> <strong>Industry</strong> in Irel<strong>and</strong> - Competitiveness Indicators • page 2
SUMMARY AND RECOMMENDATIONS<br />
<strong>The</strong> food <strong>and</strong> drink sector is highly innovative <strong>and</strong><br />
efficient, with strong domestic <strong>and</strong> export markets. It<br />
uses as raw materials the majority of the output of<br />
Irel<strong>and</strong>’s agricultural sector. <strong>The</strong> impact of the sector in<br />
terms of direct <strong>and</strong> indirect employment can be felt in<br />
all regions of the country. It is a significant contributor<br />
to net foreign earnings.<br />
More so than any other sector, the full extent of the<br />
supply chain – raw materials, production <strong>and</strong><br />
processing, logistics, sales <strong>and</strong> marketing, professional<br />
services <strong>and</strong> headquarters -is located here in Irel<strong>and</strong>.<br />
This means that the regulatory environment affects<br />
the sector more that any other. Framework policies like<br />
CAP, energy security, climate change, sustainable<br />
consumption <strong>and</strong> waste through to specific<br />
regulations <strong>and</strong> directives on animal health, food<br />
safety <strong>and</strong> consumer information all have a bearing on<br />
the industry. Regulation must be evidence based <strong>and</strong><br />
co-regulatory approaches should be given preference.<br />
All aspects of the supply chain are also affected by a<br />
complex, difficult <strong>and</strong> fast changing business<br />
environment. Commodity price volatility, euro<br />
appreciation, energy <strong>and</strong> other business costs, retail<br />
buying power etc, all affect our competitiveness.<br />
Electricity, waste <strong>and</strong> other input costs are significantly<br />
higher than those of our competitor economies. This<br />
puts the food <strong>and</strong> drink industry at a disadvantage<br />
both in export <strong>and</strong> in the domestic market where<br />
foreign competition is a reality.<br />
To these general factors can be added the high degree<br />
of retail concentration, tilting the balance of power in<br />
favour of retailers <strong>and</strong> the requirement for a greater<br />
level of co-operation between third-level institutions<br />
<strong>and</strong> industry in relation to R&D.<br />
| Recommendations<br />
• A national priority must be to bring costs back in<br />
line with <strong>and</strong> ultimately, below the EU average.<br />
Energy costs in particular, currently the second<br />
highest in Europe, need to be reduced to the levels<br />
of competitor economies through an emergency<br />
review of tariffs <strong>and</strong> alternative funding<br />
mechanisms for energy infrastructure.<br />
• While 43% of food exports go to the UK, sterling has<br />
fallen in value by 30%. Supports are needed as a<br />
matter of urgency for enterprises exposed to such<br />
crippling currency movements including a<br />
temporary suspension of employers’ PRSI payments<br />
in labour-intensive industries like food <strong>and</strong> special<br />
marketing compensation grants to overcome<br />
exceptional market distortions.<br />
• Credit availability needs to be improved <strong>and</strong> a<br />
workable export credit scheme with a state-backed<br />
guarantee needs to be introduced.<br />
• <strong>The</strong> temporary state aid measures introduced by<br />
the EU Commission in December 2008 are<br />
insufficient, <strong>and</strong> the Government should seek<br />
approval from the EU Commission to set aside state<br />
aid rules <strong>and</strong> provide grant aid to companies<br />
to assist them put in place productivity enhancing<br />
measures.<br />
• Greater links need to be developed between thirdlevel<br />
institutions <strong>and</strong> industry <strong>and</strong> publicly funded<br />
research needs to reflect industry needs. R&D is<br />
central to product innovation, processing efficiency<br />
<strong>and</strong> consumer safety - it is a key driver of growth.<br />
• <strong>The</strong> skills of graduates must also reflect industry<br />
needs <strong>and</strong> development agencies need to place a<br />
greater emphasis on the research absorption<br />
capability of SMEs.<br />
• A legal framework needs to be put in place to<br />
ensure responsible trading practices between<br />
grocery retailers <strong>and</strong> their suppliers.<br />
• An ombudsman is required to investigate<br />
complaints of irregular practices or abuse of power.<br />
• <strong>The</strong> legislation should ensure that suppliers are not<br />
forced to pay for advertising, display of goods or<br />
‘hello money’ unless there is a clear benefit to both<br />
parties.<br />
<strong>The</strong> <strong>Food</strong> <strong>and</strong> <strong>Drink</strong> <strong>Industry</strong> in Irel<strong>and</strong> - Competitiveness Indicators • page 3
ECONOMIC VALUE OF THE FOOD AND<br />
DRINK SECTOR<br />
<strong>The</strong> food <strong>and</strong> drink industry is Irel<strong>and</strong>’s most important<br />
indigenous sector. It has a gross output of over €18<br />
billion <strong>and</strong> supplies most of our domestic food needs.<br />
Total exports exceed €8.1 billion <strong>and</strong> the sector<br />
accounts for two thirds of all exports by indigenous<br />
industry.<br />
<strong>The</strong> industry is closely linked with agriculture in all<br />
regions of the country, <strong>and</strong> accounts for most of its<br />
output. In this sense, the industry is unique in Irel<strong>and</strong>,<br />
integrated as it is with the majority of raw materials<br />
produced <strong>and</strong> processed here <strong>and</strong> distributed either<br />
nationally or overseas. In addition, the industry is headquartered<br />
here <strong>and</strong> has developed most of its<br />
intellectual property here also.<br />
As a consequence of this, food <strong>and</strong> drink is affected<br />
more than any other industry by the business,<br />
regulatory <strong>and</strong> policy framework in Irel<strong>and</strong> <strong>and</strong> the<br />
associated cost base.<br />
Irel<strong>and</strong>’s food <strong>and</strong> drink industry has shown an ability<br />
to innovate, add value <strong>and</strong> develop new export<br />
markets, making an increasingly significant<br />
contribution to the country’s economy. In order for this<br />
to remain the case, policy makers must ensure that the<br />
industry’s competitiveness is not just maintained but<br />
improved.<br />
| THE INDUSTRY AT A GLANCE<br />
• <strong>The</strong> Irish food <strong>and</strong> drink industry has a gross output<br />
of over €18 billion<br />
• Under traditional GDP measurements the sector<br />
accounts for over 8% of total GDP <strong>and</strong> over 18% of<br />
GVA in manufacturing<br />
• <strong>The</strong> sector employs 46,000 people directly <strong>and</strong><br />
60,000 people in distribution <strong>and</strong> other services<br />
• It purchases over €5 billion worth of agricultural<br />
products from Irel<strong>and</strong>’s 120,000 farmers annually<br />
• Total employment linked to the sector is almost<br />
230,000<br />
• It supplies the majority of the €11 billion worth of<br />
food <strong>and</strong> drink products that we consume annually<br />
• It exports over €8 billion worth of food <strong>and</strong> drink<br />
products to 120 countries worldwide annually <strong>and</strong><br />
accounts for €5 billion (66%) of exports by<br />
indigenous manufacturers<br />
• It purchases € 8.4 billion worth of Irish goods <strong>and</strong><br />
services – almost 50% of the total sourced by<br />
manufacturing industry in Irel<strong>and</strong><br />
• Taking capital flows <strong>and</strong> links with the domestic<br />
economy into account, the sector is the largest<br />
wealth generator in Irish manufacturing industry<br />
<strong>The</strong> <strong>Food</strong> <strong>and</strong> <strong>Drink</strong> <strong>Industry</strong> in Irel<strong>and</strong> - Competitiveness Indicators • page 4
A. MAIN COMPETITIVENESS INDICATORS<br />
1. Production Value<br />
<strong>The</strong> production value of the Irish food <strong>and</strong> drink<br />
industry grew strongly between 2000 <strong>and</strong> 2006 (with<br />
further growth experienced in 2007). This compares<br />
with slower growth in both the UK <strong>and</strong> EU generally.<br />
Evolution of production value (2000 = 100)<br />
130<br />
120<br />
110<br />
100<br />
90<br />
80<br />
2000 2001 2002 2003 2004 2005 2006<br />
— Irish turnover<br />
Source: CSO / Eurostat<br />
— UK turnover<br />
— EU turnover<br />
3. Productivity<br />
GVA per employee has been on an upward trend since<br />
the start of the decade <strong>and</strong> is significantly higher than<br />
the UK. This reflects structural changes in the industry<br />
as it has experienced consolidation <strong>and</strong> higher levels of<br />
productivity to meet the challenges of increased<br />
customer buying power, growth in export markets <strong>and</strong><br />
the move to higher value added output.<br />
GVA per employee (€)<br />
200,000<br />
180,000<br />
160,000<br />
140,000<br />
120,000<br />
100,000<br />
80,000<br />
60,000<br />
40,000<br />
20,000<br />
0<br />
2000 2001 2002 2003 2004 2005 2006<br />
2. Value added<br />
— Irish GVA per employee<br />
Source: CSO / Eurostat<br />
— UK GVA per employee<br />
While gross value added (GVA) in the Irish food <strong>and</strong><br />
drink sector varied between 2000 <strong>and</strong> 2006, it has<br />
generally been ahead of the UK.<br />
Value added (2000 = 100)<br />
200<br />
150<br />
100<br />
4. Currency<br />
<strong>The</strong> Euro zone accounts for 30% of the sector’s exports.<br />
With a strong Euro <strong>and</strong> 43% of exports going to the<br />
UK/sterling area, Irel<strong>and</strong>’s food <strong>and</strong> drink industry is<br />
heavily exposed to currency fluctuations. In addition,<br />
the balance of 27% goes to non-European countries<br />
<strong>and</strong> in many instances is denominated in dollars.<br />
<strong>The</strong>refore, a currency risk exists for over two thirds of<br />
Irish food exports, <strong>and</strong> underlines the need to maintain<br />
competitiveness by controlling domestic business<br />
costs.<br />
50<br />
2000<br />
2001<br />
2002<br />
2003<br />
2004<br />
2005<br />
2006<br />
euro - sterling, euro - dollar<br />
— Irish GVA<br />
Source: CSO / Eurostat<br />
— UK GVA<br />
eur/gbp<br />
1.00<br />
0.95<br />
0.90<br />
0.85<br />
0.80<br />
0.75<br />
0.70<br />
0.65<br />
0.60<br />
2003<br />
2004<br />
2005<br />
2006<br />
2007<br />
2008<br />
2009<br />
1.6<br />
1.5<br />
1.4<br />
1.3<br />
1.2<br />
1.1<br />
1.0<br />
0.9<br />
0.8<br />
eur/usd<br />
Source: Reuters EcoWin<br />
eur/gbp<br />
eur/usd<br />
<strong>The</strong> <strong>Food</strong> <strong>and</strong> <strong>Drink</strong> <strong>Industry</strong> in Irel<strong>and</strong> - Competitiveness Indicators • page 5
5. Harmonised Competitiveness Index<br />
<strong>The</strong> Harmonised Competitiveness Index for Irel<strong>and</strong><br />
shows a 32% decline in competitiveness since the start<br />
of the decade. Irel<strong>and</strong>'s loss of competitiveness in<br />
recent years has occurred due a combination of<br />
exchange rate factors <strong>and</strong> larger increases in our cost<br />
base compared to those experienced in the countries<br />
with which we trade. (Note: an increase in the index<br />
indicates a fall in competitiveness.)<br />
Decline in competitiveness<br />
140<br />
130<br />
120<br />
110<br />
100<br />
90<br />
80<br />
2000 2001 2002 2003 2004 2005 2006<br />
2007<br />
2008<br />
Source: Central Bank<br />
6. Conclusion<br />
Despite significant increases in productivity <strong>and</strong> value<br />
added in the food <strong>and</strong> drink industry, rising business<br />
costs <strong>and</strong> a strengthening euro have caused a<br />
significant deterioration in the competitiveness of the<br />
sector, reflecting that of manufacturing as a whole.<br />
With 43% of food exports going to the UK, sterling has<br />
fallen in value by 30%. Supports are needed as a matter<br />
of urgency for enterprises exposed to such crippling<br />
currency movements including a temporary<br />
suspension of employers’ PRSI payments in<br />
labour-intensive industries <strong>and</strong> special marketing<br />
compensation grants. <strong>The</strong> Government should seek<br />
approval from the EU commission to set aside state aid<br />
rules <strong>and</strong> provide grant aid to companies to assist<br />
them put in place productivity enhancing measures.<br />
<strong>The</strong> <strong>Food</strong> <strong>and</strong> <strong>Drink</strong> <strong>Industry</strong> in Irel<strong>and</strong> - Competitiveness Indicators • page 6
B. BUSINESS INPUT COSTS AND<br />
AGRICULTURAL RAW MATERIALS<br />
1. Raw material prices / factory gate prices<br />
Industrial electricity prices (2007)<br />
Raw material prices have risen significantly since 2006.<br />
Combined with large rises in other input costs,<br />
particularly energy, these have placed huge pressure on<br />
suppliers who have been unable to achieve full cost<br />
recovery in the market place. This has placed<br />
downward pressure on margins with long-term effects<br />
on investment, innovation <strong>and</strong> the survival of some<br />
companies.<br />
euro/100kWh<br />
12<br />
10<br />
8<br />
6<br />
4<br />
2<br />
0<br />
Irel<strong>and</strong><br />
UK<br />
EU 15<br />
EU 25<br />
Prices - farm gate, factory gate <strong>and</strong> retail<br />
(2000 = 100)<br />
Source: Eurostat<br />
125<br />
120<br />
115<br />
110<br />
105<br />
100<br />
95<br />
90<br />
85<br />
80<br />
2004 2005<br />
2006<br />
2007<br />
2008<br />
Source: CSO<br />
2. Electricity prices<br />
— Agricultural output prices<br />
— Factory gate prices<br />
Between 2001 <strong>and</strong> 2007, Irel<strong>and</strong> experienced the<br />
second highest increase in industrial electricity prices<br />
in the EU at 70%. This compared to 47% in the UK<br />
specifically, <strong>and</strong> an EU 15 average of 36%. By 2007, Irish<br />
industrial electricity prices were the second highest in<br />
the EU 25 <strong>and</strong> almost 19% above the average. <strong>The</strong> food<br />
<strong>and</strong> drink sector is particularly exposed to higher prices<br />
as on average, energy tends to be the largest input cost<br />
once raw materials are excluded.<br />
In addition, increases in input costs such as electricity<br />
have not been recovered in output prices by the food<br />
sector. <strong>The</strong> 77% increase in electricity prices since 2000<br />
far outstrips the factory gate price increases for food<br />
products, which averaged 19% over the same period<br />
according to the Wholesale Price Index from the<br />
Central Statistics Office (CSO).<br />
Wholesale price index<br />
200<br />
180<br />
160<br />
140<br />
120<br />
100<br />
80<br />
60<br />
40<br />
20<br />
0<br />
Source: CSO<br />
2000 2004 2008<br />
Electricity<br />
Dairy Products<br />
Consumer <strong>Food</strong>s<br />
Meat Products<br />
Beverages<br />
Percentage increase in industrial electricity prices<br />
(2001 - 2007)<br />
80<br />
60<br />
40<br />
20<br />
0<br />
Irel<strong>and</strong><br />
UK<br />
EU15<br />
Source: Eurostat<br />
<strong>The</strong> <strong>Food</strong> <strong>and</strong> <strong>Drink</strong> <strong>Industry</strong> in Irel<strong>and</strong> - Competitiveness Indicators • page 7
3. Waste Charges<br />
<strong>Food</strong> waste accounts for a significant portion of<br />
industrial waste 1 . Although a significant quantity is<br />
recovered, the primary waste treatment solution that is<br />
available in Irel<strong>and</strong> is l<strong>and</strong>fill. L<strong>and</strong>fill charges are<br />
among the highest in Europe.<br />
L<strong>and</strong>fill fees <strong>and</strong> taxes<br />
€/tonne<br />
160<br />
140<br />
120<br />
100<br />
80<br />
60<br />
40<br />
20<br />
0<br />
Scotl<strong>and</strong> (2005)<br />
Denmark (2005)<br />
Sweden (2006)<br />
Netherl<strong>and</strong>s (2006)<br />
Irel<strong>and</strong> (2006)<br />
Fl<strong>and</strong>ers (2005)<br />
Source: NCC<br />
When examined at a local level, the difference between<br />
Irel<strong>and</strong> <strong>and</strong> the UK is even more pronounced.<br />
Waste disposal costs per tonne (2007)<br />
Dublin<br />
Belfast<br />
London<br />
Manchester<br />
€182<br />
€78<br />
€70<br />
€57<br />
Source: NCC<br />
4. Conclusion<br />
Electricity, waste <strong>and</strong> other input costs here are<br />
significantly higher than those of our competitors. This<br />
puts the food <strong>and</strong> drink industry at a competitive<br />
disadvantage both in export markets <strong>and</strong> in the<br />
domestic market, where foreign competition is a<br />
reality. A national priority must be to bring these costs<br />
back in line with <strong>and</strong> ultimately, below the EU average.<br />
Energy costs in particular, currently the second<br />
highest in Europe, need to be reduced to the levels of<br />
competitor economies.<br />
1 EPA National Waste Report 2006<br />
<strong>The</strong> <strong>Food</strong> <strong>and</strong> <strong>Drink</strong> <strong>Industry</strong> in Irel<strong>and</strong> - Competitiveness Indicators • page 8
C. R&D INVESTMENT AND INNOVATION<br />
PERFORMANCE<br />
1. Business expenditure on R&D (BERD)<br />
BERD for the food <strong>and</strong> drink sector reached €64 million<br />
in 2005, representing a 12% increase over 2003. This<br />
equates to 0.35% of output <strong>and</strong> compares well with the<br />
EU 15 average of 0.24%.<br />
<strong>The</strong> fourth Forfás Community Innovation Survey<br />
showed that 80% of firms in the food, drink <strong>and</strong><br />
tobacco sector were engaged in innovation activity. <strong>The</strong><br />
regional distribution of BERD also reflects that of the<br />
food <strong>and</strong> drink sector with a strong regional spread,<br />
<strong>and</strong> particular concentration in the south <strong>and</strong> east of<br />
the country.<br />
BERD (% of total output)<br />
1.5<br />
2. Government-funded R&D<br />
A total of €5.922 billion will be spent on science,<br />
technology <strong>and</strong> innovation over the course of the<br />
National Development Plan (2007 – 2013). Within this<br />
figure, €641m (11%) has been allocated to the Agri-<strong>Food</strong><br />
Research Programme. This includes funding for:<br />
• Teagasc research activities (to include capital<br />
expenditure on an animal science centre, functional<br />
food laboratories, clinical trials facility <strong>and</strong><br />
nutraceutical research facility);<br />
• Department of Agriculture, Fisheries <strong>and</strong> <strong>Food</strong><br />
agriculture <strong>and</strong> veterinary laboratories;<br />
• competitive research programmes including FIRM.<br />
Forfás measures Government-funded R&D (GOVERD),<br />
which shows that despite significant investment,<br />
Irel<strong>and</strong> remains below EU 25 <strong>and</strong> OECD levels.<br />
1<br />
0.5<br />
Government sector performed R&D (GOVERD)<br />
0.3<br />
0<br />
Irel<strong>and</strong><br />
Source: Forfás<br />
EU 15<br />
US<br />
Japan<br />
GOVERD as a % of GDP<br />
0.25<br />
0.2<br />
0.15<br />
0.1<br />
0.05<br />
Regional distribution of BERD (%)<br />
60<br />
50<br />
40<br />
0<br />
2000<br />
Source: Forfás / OECD<br />
2002<br />
2004<br />
2006<br />
OECD<br />
EU 25<br />
GOVERD/GDP Irel<strong>and</strong><br />
30<br />
20<br />
10<br />
0<br />
BMW<br />
<strong>Food</strong><br />
<strong>and</strong> drink<br />
Dublin<br />
Total<br />
industry<br />
Rest of country<br />
3. Level of employment in R&D<br />
<strong>The</strong>re were 1,085 2 research personnel (researchers,<br />
technicians <strong>and</strong> support staff) working in the food <strong>and</strong><br />
drink sector in 2005. This was an increase of 58% over<br />
2003.<br />
Source: Forfás<br />
2 Research & Development Performance in the Business Sector Irel<strong>and</strong> 2005/6, Forfás 2007<br />
<strong>The</strong> <strong>Food</strong> <strong>and</strong> <strong>Drink</strong> <strong>Industry</strong> in Irel<strong>and</strong> - Competitiveness Indicators • page 9
4. Conclusion<br />
<strong>The</strong> significant private <strong>and</strong> public sector investment in<br />
R&D must be aligned with the needs of the food <strong>and</strong><br />
drink sector to allow the industry to develop <strong>and</strong><br />
maintain competitive advantage through product<br />
innovation, processing efficiency <strong>and</strong> advances in<br />
consumer safety. Greater links need to be developed<br />
between third-level institutions <strong>and</strong> industry with<br />
graduates’ skills more closely aligned with industry’s<br />
requirements. Finally, development agencies need to<br />
place a greater emphasis on the ability of SMEs to<br />
absorb new research.<br />
<strong>The</strong> <strong>Food</strong> <strong>and</strong> <strong>Drink</strong> <strong>Industry</strong> in Irel<strong>and</strong> - Competitiveness Indicators • page 10
D. TRADE PERFORMANCE<br />
1. Export growth<br />
Until recently, Irish food <strong>and</strong> drink exports had been<br />
growing steadily in both existing <strong>and</strong> new markets.<br />
Despite ongoing diversification, the UK remains the<br />
largest single market, accounting for 43% of exports in<br />
2008. <strong>The</strong> rapid <strong>and</strong> substantial weakening of sterling<br />
since late 2007 has placed extreme competitive<br />
pressures on Irish exporters in that market with<br />
exports falling by 6.5% in 2008.<br />
3. Conclusion<br />
Widening the trade balance will only be possible by<br />
improving the competitiveness of the sector through<br />
greater control of business costs <strong>and</strong><br />
commercially-focused innovation. Because the sector<br />
has such a strong export focus <strong>and</strong> high working<br />
capital requirements it needs access to credit<br />
insurance, greater availability of banking credit <strong>and</strong><br />
marketing supports in export markets.<br />
Irish food <strong>and</strong> drink exports (€m)<br />
10000<br />
8000<br />
€million<br />
6000<br />
4000<br />
2000<br />
0<br />
2003 2004 2005 2006 2007 2008<br />
Exports<br />
Source: CSO<br />
2. Trade balance<br />
Strong growth in exports has been matched by similar<br />
growth in imports. <strong>The</strong> overall trade balance is strongly<br />
positive <strong>and</strong> is now approximately €3 billion. <strong>The</strong><br />
strength of the euro against sterling <strong>and</strong> the dollar<br />
since late 2007 has had a negative effect on both<br />
exports <strong>and</strong> imports.<br />
Imports, exports <strong>and</strong> balance of trade (€m)<br />
€million<br />
9000<br />
8000<br />
7000<br />
6000<br />
5000<br />
4000<br />
3000<br />
2000<br />
1000<br />
0<br />
2002 - 2008<br />
Source: CSO<br />
<strong>Food</strong> <strong>and</strong> drink imports<br />
<strong>Food</strong> <strong>and</strong> drink exports<br />
Balance of trade<br />
<strong>The</strong> <strong>Food</strong> <strong>and</strong> <strong>Drink</strong> <strong>Industry</strong> in Irel<strong>and</strong> - Competitiveness Indicators • page 11
E. RETAIL BUYING POWER<br />
1. Grocery retail sector concentration<br />
High levels of concentration in the grocery retail sector<br />
have resulted in an imbalance of power between<br />
suppliers (food suppliers) <strong>and</strong> their customers<br />
(retailers). Irel<strong>and</strong> has one of the highest levels of<br />
concentration in Europe, surpassed only by the Nordic<br />
countries <strong>and</strong> Switzerl<strong>and</strong>.<br />
Market share of top three retailers (2008)<br />
70.5%<br />
Each of the top three grocery retailers has domestic<br />
sales in the €2 to €3 billion range, which are many<br />
times the sales of even the largest food companies.<br />
From an exporter’s perspective, high levels of<br />
concentration also exist in the top three export<br />
markets.<br />
Market share of top three retailers in the top three<br />
export markets (AC Nielsen 2004)<br />
France<br />
UK<br />
Germany<br />
64%<br />
58%<br />
55%<br />
2. Conclusion<br />
Because of high levels of concentration, the bargaining<br />
power of retailers is considerably higher than that of<br />
their suppliers. <strong>The</strong>re is an urgent need for the<br />
introduction of legislation to ensure balance in the<br />
commercial relationship between suppliers <strong>and</strong><br />
retailers. This legal framework should ensure:<br />
• responsible trading practices between grocery<br />
retailers <strong>and</strong> their suppliers;<br />
• an ombudsman to investigate complaints of<br />
irregular commercial practices or abuse of power;<br />
• suppliers are not forced to pay for advertising,<br />
display of goods or ‘hello money’ unless there is a<br />
clear benefit to both parties.<br />
<strong>The</strong> <strong>Food</strong> <strong>and</strong> <strong>Drink</strong> <strong>Industry</strong> in Irel<strong>and</strong> - Competitiveness Indicators • page 12
IRISH BUSINESS AND EMPLOYERS CONFEDERATION<br />
Confederation House 84/86 Lower Baggot Street Dublin 2<br />
telephone + 353 (0)1 605 1500 fax + 353 (0)1 638 1500<br />
e-mail info@ibec.ie<br />
www.ibec.ie<br />
CORK<br />
Knockrea House<br />
Douglas Road<br />
Cork<br />
telephone + 353 (0)21 429 5511<br />
e-mail cork@ibec.ie<br />
SOUTH EAST<br />
Confederation House<br />
Waterford Business Park<br />
Cork Road Waterford<br />
telephone + 353 (0)51 331 260<br />
e-mail southeast@ibec.ie<br />
MID-WEST<br />
Gardner House<br />
Bank Place<br />
Charlotte Quay Limerick<br />
telephone + 353 (0)61 410 411<br />
e-mail midwest@ibec.ie<br />
WEST<br />
Ross House<br />
Victoria Place<br />
Galway<br />
telephone + 353 (0)91 561 109<br />
e-mail west@ibec.ie<br />
NORTH WEST<br />
3rd Floor Pier One<br />
Quay Street<br />
Donegal Town<br />
telephone + 353 (0)74 972 4280<br />
e-mail northwest@ibec.ie<br />
IBEC EUROPE<br />
Avenue de Cortenbergh, 89<br />
Boite 2 1000 Bruxelles<br />
Belgium<br />
telephone + 32 (0)2 512 3333<br />
e-mail ibec.europe@ibec.ie<br />
www.ibec.ie/europe