High-speed atomic force microscopy shows dynamic molecular ...
High-speed atomic force microscopy shows dynamic molecular ...
High-speed atomic force microscopy shows dynamic molecular ...

You also want an ePaper? Increase the reach of your titles
YUMPU automatically turns print PDFs into web optimized ePapers that Google loves.
LETTERS<br />
PUBLISHED ONLINE: 14 FEBRUARY 2010 | DOI: 10.1038/NNANO.2010.7<br />
<strong>High</strong>-<strong>speed</strong> <strong>atomic</strong> <strong>force</strong> <strong>microscopy</strong> <strong>shows</strong><br />
<strong>dynamic</strong> <strong>molecular</strong> processes in photoactivated<br />
bacteriorhodopsin<br />
Mikihiro Shibata 1 ,HayatoYamashita 1 , Takayuki Uchihashi 1,2 , Hideki Kandori 3 and Toshio Ando 1,2 *<br />
Dynamic changes in protein conformation in response to<br />
external stimuli are important in biological processes, but it<br />
has proved difficult to directly visualize such structural<br />
changes under physiological conditions 1–10 . Here, we show<br />
that high-<strong>speed</strong> <strong>atomic</strong> <strong>force</strong> <strong>microscopy</strong> 7 can be used to visualize<br />
<strong>dynamic</strong> changes in stimulated proteins. <strong>High</strong>-resolution<br />
movies of a light-driven proton pump, bacteriorhodopsin 11,12 ,<br />
reveal that, upon illumination, a cytoplasmic portion of each<br />
bacteriorhodopsin monomer is brought into contact with adjacent<br />
trimers. The bacteriorhodopsin–bacteriorhodopsin interaction<br />
in the transiently formed assembly engenders both<br />
positive and negative cooperative effects in the decay kinetics<br />
as the initial bacteriorhodopsin recovers and, as a consequence,<br />
the turnover rate of the photocycle is maintained constant, on<br />
average, irrespective of the light intensity. These results<br />
confirm that high-resolution visualization is a powerful<br />
approach for studying elaborate bio<strong>molecular</strong> processes under<br />
realistic conditions.<br />
The biological function of a protein is closely associated with its<br />
ability to undergo structural changes. In many cases, these structural<br />
changes are triggered by external stimuli such as pH, temperature,<br />
ligand binding, mechanical stress and light. Although direct realspace<br />
and real-time visualization of such changes is a straightforward<br />
approach to understanding the <strong>dynamic</strong> <strong>molecular</strong> processes<br />
involved, the lack of suitable techniques has been a barrier.<br />
Atomic <strong>force</strong> <strong>microscopy</strong> (AFM) is a versatile technique with<br />
which to image proteins in liquids at sub<strong>molecular</strong> resolution, but<br />
its poor temporal resolution has meant that only static or slow<br />
time-lapse images of proteins have been obtained 1–5 . In the last<br />
decade, various efforts have been made to increase the scan <strong>speed</strong><br />
of AFM 6–9 . As a result, single protein molecules showing<br />
Brownian motion have been captured on video with a temporal resolution<br />
of 30 ms (the highest achieved to date; ref. 10). However,<br />
<strong>dynamic</strong> visualization of physiologically relevant conformational<br />
changes in proteins has been difficult because the tip–sample interaction<br />
tends to interfere with the physiological functions. To solve<br />
this problem, a new method has recently been developed that<br />
allows fast and precise control of the tip–sample distance with a<br />
minimum load to the sample 7 . Using such methods, we report<br />
here the first example of <strong>dynamic</strong> imaging of a functioning<br />
biological sample.<br />
Bacteriorhodopsin (bR) represents a well-known case of the<br />
association between stimulus-triggered structural <strong>dynamic</strong>s and<br />
biological function 11,12 , and its direct visualization has long been a<br />
goal. Bacteriorhodopsin contains seven transmembrane a-helices<br />
(termed A–G) enclosing the chromophore retinal 13,14 . In the photocycle,<br />
a series of spectral intermediates, designated J, K, L, M, N and<br />
O, occur in that order 12 . The light-induced conformational changes<br />
in bR have been investigated by various methods 15–25 , leading to a<br />
consensus that the proton channel at the cytoplasmic surface is<br />
opened by the tilting of helix F away from the protein<br />
centre 21,23,24 . Sass et al. reported helix F displacement of 0.1 nm<br />
in the late M state, based on X-ray diffraction of the three-dimensional<br />
crystal of wild type (WT) 21 . However, a larger structural<br />
change in bR was reported in the electron crystallography study of<br />
the D96G, F171C, F219 L triple mutant of bR: displacement of<br />
helix F by 0.35 nm, away from the centre of the protein 23 . An electron<br />
crystallography study of the F219 L mutant further reported<br />
that helices E and F tilt away from the centre of the protein, followed<br />
by a shift of the E–F loop by 0.3 nm (ref. 24), resulting in largescale<br />
conformational changes in the M and N states 18,19,25 .<br />
Nevertheless, a consensus on the conformational changes has not<br />
yet been reached. As for other proteins, knowledge of the structural<br />
<strong>dynamic</strong>s of bR is limited because its structural data have been accumulated<br />
using static and ensemble averaging approaches. Direct and<br />
<strong>dynamic</strong> visualization using high-<strong>speed</strong> AFM should provide a<br />
better overview of the conformational changes of bR.<br />
We used the D96N bR mutant, which has a longer photocycle<br />
(10 s) than the WT (10 ms), but retains its proton pumping<br />
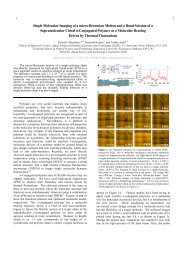
ability 26 . Figure 1a presents successive images of D96N at the cytoplasmic<br />
surface, captured at 1 frame per second (fps; Supplementary<br />
Movie S1). Individual bR molecules can be seen clearly, as reported<br />
in earlier pioneering studies for the unphotolysed state 3–5 . Upon<br />
illumination with green light, bR drastically changes its structure<br />
(compare images at 1 and 2 s) and returns to the unphotolysed<br />
state in a few seconds after light-off, an outcome that is reproducible<br />
in repeated dark–illumination cycles (Supplementary Movie S1).<br />
We analysed the ‘mass centre’ positions of the individual monomers<br />
imaged during the dark–illumination cycles. Note that the<br />
‘mass centre’ for each bR monomer was calculated from the<br />
corresponding surface area and height distribution in the image<br />
(see Methods). All the activated bR monomers exhibited displacements<br />
of their centre of mass, with an average displacement of<br />
0.69+0.15 nm (Supplementary Fig. S1, in the green region). In<br />
Fig. 1b, the trajectories of the mass centre positions during the<br />
dark–illumination cycles are superimposed on the AFM image in<br />
the unphotolysed state (red, blue and black marks). They show<br />
highly centrosymmetric trajectories, oriented outward from the<br />
trimer centres.<br />
The top and bottom images in Fig. 1c show magnified images<br />
obtained before and during illumination, respectively. The prominent<br />
protrusion in the AFM topographs reflects interhelical loop<br />
structures on the cytoplasmic surface 4,27 . Compared with the<br />
<strong>atomic</strong> model of the a-helical cytoplasmic ends in the unphotolysed<br />
1<br />
Department of Physics, Kanazawa University, Kanazawa 920-1192, Japan, 2 CREST/JST, Tokyo 102-0075, Japan, 3 Department of Frontier Materials, Nagoya<br />
Institute of Technology, Nagoya 466-8555, Japan. *e-mail: tando@kenroku.kanazawa-u.ac.jp<br />
NATURE NANOTECHNOLOGY | ADVANCE ONLINE PUBLICATION | www.nature.com/naturenanotechnology 1<br />
© 2010 Macmillan Publishers Limited. All rights reserved.
LETTERS<br />
NATURE NANOTECHNOLOGY DOI: 10.1038/NNANO.2010.7<br />
a<br />
5 nm<br />
0 s 1.0 s 2.0 s 3.0 s<br />
c<br />
5 nm<br />
b<br />
Dark Light<br />
θ<br />
D E F<br />
C<br />
G<br />
B<br />
A<br />
A B C D E<br />
5 nm<br />
G F<br />
D E F<br />
C G<br />
B A<br />
1 2<br />
D E F<br />
0.0<br />
C<br />
G<br />
B<br />
A<br />
A B C D E<br />
F G<br />
1.0<br />
nm<br />
d<br />
Ratio of activated molecules (%)<br />
100<br />
80<br />
60<br />
40<br />
20<br />
0<br />
0<br />
Abs. change at 410 nm (%)<br />
100<br />
80<br />
60<br />
40<br />
20<br />
7 8<br />
9<br />
0<br />
0 50 100 150<br />
Time (s)<br />
7 8<br />
9<br />
50 100 150<br />
Time (s)<br />
200<br />
200<br />
Figure 1 | <strong>High</strong>-<strong>speed</strong> AFM images of the cytoplasmic surface of D96N under dark or illuminated conditions. a, Successive AFM images of D96N bR<br />
adsorbed onto a mica surface in 10 mM Tris-HCl (pH 7) and 300 mM KCl. Frame rate, 1 fps; pixel size, 200 200 pixels (Supplementary Movie S1). A bR<br />
trimer is highlighted by the white triangle. The green bars indicate illumination of 532-nm green light at 0.5 mW. b, Traces (red, blue and black marks) of the<br />
mass centre positions under dark–illumination cycles are superimposed on the image of D96N in the dark. The photo-induced movement of bR includes<br />
counterclockwise rotation (7.4+2.28) around the trimer centre. c, Surface maps of the magnified images in the dark (upper panel) and under illumination<br />
(bottom panel). The position of each trimer centre is denoted by white dots. A monomer in the dark is indicated by a single white arrow. Under illumination,<br />
the topography of the monomer splits into major and minor protrusions, as indicated by green arrows 1 and 2, respectively. d, Decay after flash-illumination<br />
of the activated state at different pH values (7, 8 or 9), detected by high-<strong>speed</strong> AFM. The exponential decay constants (t) atpH7,8and9are6.7+0.10 s<br />
(the total number of analysed bR molecules, n T ¼ 320; the number of different molecules analysed, n m ¼ 52), 25+0.25 s (n T ¼ 373, n m ¼ 65), and<br />
48+0.59 s (n T ¼ 214, n m ¼ 120), respectively. The inset <strong>shows</strong> the absorbance change at 410 nm (that is, decay of the M-intermediate) after flashillumination<br />
of D96N measured at various values of pH (7, 8 or 9). The exponential decay constants (t) at pH 7, 8 and 9 are 3.4+0.025 s, 14+0.034 s<br />
and 33+0.080 s, respectively.<br />
state 14 (A–G in Fig. 1b,c), the protruding areas around helices E and<br />
F shift outwards from the trimer centre under illumination.<br />
Therefore, the protrusion movement visualized here is ascribed to<br />
the displacement of the E–F loop. As a result of E–F loop displacement,<br />
the protrusion is divided into two sections (green arrows 1<br />
and 2 in Fig. 1c), and the minor protrusion (green arrow 2) likely<br />
corresponds to the position around helices A and B. Note that the<br />
overall position of each bR molecule does not change because<br />
of indiscernible alterations at the extracellular surface<br />
(Supplementary Fig. S2 and Movie S5).<br />
To ensure that the conformational changes observed here are not<br />
artifacts such as tip-<strong>force</strong>-induced structural alterations 4 , we<br />
measured the decay of the active state after flash illumination at<br />
various pH values (Fig. 1d). UV-visible spectroscopy 26 has shown<br />
that the lifetime of the M-intermediate of D96N and WT is prolonged<br />
at alkaline pH. In agreement with this fact (inset, Fig. 1d)<br />
is the observation here with D96N that the decay detected by<br />
high-<strong>speed</strong> AFM showed a strong pH dependence (Fig. 1d). Using<br />
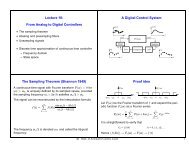
WT at pH 7 and pH 10, this finding was further confirmed<br />
(Fig. 2, Supplementary Movies S2,S3). Because of the very fast<br />
photocycle, no conformational changes were detected in WT at<br />
pH 7, whereas at pH 10, conformational changes similar to those<br />
of D96N were observed, although the activated state decays much<br />
faster than that of D96N.<br />
The activation of D96N was observed within 1 s immediately<br />
after illumination, but was not observed after light-off, even at alkaline<br />
pH (data not shown). A cysteine accessibility study with D96N<br />
indicated displacement of the E–F loop in the M state 19 . Therefore,<br />
the high-<strong>speed</strong> AFM imaging of D96N did capture the lightinduced<br />
ground-to-M-state transition. Because the AFM observation<br />
was performed with the samples on a mica surface, we<br />
cannot exclude a possible effect of the surface. Despite this uncertainty,<br />
the longer decay constant observed using AFM than that<br />
observed optically suggests that the activated state detected by<br />
2<br />
NATURE NANOTECHNOLOGY | ADVANCE ONLINE PUBLICATION | www.nature.com/naturenanotechnology<br />
© 2010 Macmillan Publishers Limited. All rights reserved.
NATURE NANOTECHNOLOGY DOI: 10.1038/NNANO.2010.7<br />
LETTERS<br />
a<br />
Distance from initial position (nm)<br />
0<br />
M1<br />
M2<br />
M3<br />
M4<br />
M5<br />
M6<br />
M7<br />
M8<br />
M9<br />
M10<br />
30<br />
60 90<br />
Time (s)<br />
120<br />
150<br />
b<br />
Distance from initial position (nm)<br />
1.5 nm<br />
0<br />
M1<br />
M2<br />
M3<br />
M4<br />
M5<br />
M6<br />
M7<br />
M8<br />
M9<br />
M10<br />
30<br />
60 90<br />
Time (s)<br />
Figure 2 | Displacement of mass centre positions for WT at the<br />
cytoplasmic surface. a,b, Ten typical bR monomers at pH 7 (a) and pH 10<br />
(b) are analysed. The AFM movies for WT at pH 7 and pH 10 are shown in<br />
Supplementary Movies S2 and S3, respectively. The green regions show<br />
periods of green light illumination (532 nm, 0.5 mW). Conformational<br />
changes in WT are not detected at pH 7, because the photocycle is too fast,<br />
whereas at pH 10, they were repeatedly detected because the photocycle is<br />
prolonged at alkaline pH 29 .<br />
120<br />
150<br />
AFM may contain an additional state in which the Schiff base is<br />
reprotonated (during M decay) but the protein conformation has<br />
not yet returned to the ground state.<br />
As a result of the outward displacement of the E–F loop, nearestneighbour<br />
bR monomers, each belonging to a different adjacent<br />
trimer, transiently assemble. Here, we use a new designation,<br />
‘trefoil’, for the triad of nearest-neighbour monomers to distinguish<br />
it from the original trimer. Notably, this transient assembly in a<br />
trefoil alters the decay kinetics of the activated state<br />
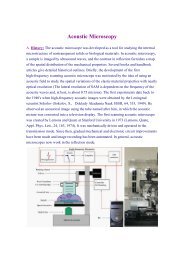
(Supplementary Movie S4). Figure 3a <strong>shows</strong> the time course of<br />
the displacement of the mass centres for six bR monomers belonging<br />
to two different trefoils observed at different light intensities<br />
(Mn1–Mn3; n indicates different trefoils) (Supplementary<br />
Fig. S3). Under weak illumination, it is mainly the case that only<br />
one monomer in each trefoil is activated (M 1 3 and M 2 2 in the left<br />
panel of Fig. 3a). When only one monomer is activated in a<br />
trefoil, it decays with a time constant of 7.3+0.58 s (the top panel<br />
of Fig. 3b). In contrast, under stronger illumination, two or three<br />
monomers within a trefoil tend to be activated together.<br />
Interestingly, the decay of each monomer markedly depends on<br />
the order of its activation. The monomer that is activated latest<br />
among the activated monomers in the trefoil (blue arrows in the<br />
right panel of Fig. 3a) decays with a shorter time constant of<br />
2.0+0.16 s (the middle panel of Fig. 3b). On the other hand, the<br />
decay kinetics of the early activated monomers (M 1 2 and M 2 2in<br />
the right panel of Fig. 3a) does not follow a single exponential<br />
(the bottom panel of Fig. 3b), and the averaged decay time lengthens<br />
a<br />
Distance from initial position (nm)<br />
M 1 1<br />
M 1 2<br />
M 1 3<br />
M 2 1<br />
M 2 2<br />
Weaker<br />
Distance from initial position (nm)<br />
M 1 1<br />
M 1 2<br />
M 1 3<br />
M 2 1<br />
M 2 2<br />
Stronger<br />
b<br />
Number of molecules (N) Number of molecules (N)<br />
40<br />
30<br />
20<br />
10<br />
0<br />
0<br />
80<br />
60<br />
40<br />
20<br />
0<br />
0<br />
5<br />
5<br />
10<br />
10<br />
15 20 25 30<br />
Time (s)<br />
15 20 25 30<br />
Time (s)<br />
35<br />
35<br />
40 45<br />
40 45<br />
1.5 nm<br />
0<br />
M 2 3<br />
20 40<br />
Time (s)<br />
60<br />
0<br />
M 2 3<br />
20 40<br />
Time (s)<br />
60<br />
Number of molecules (N)<br />
40<br />
30<br />
20<br />
10<br />
0<br />
0<br />
5<br />
10<br />
15 20 25 30<br />
Time (s)<br />
35<br />
40 45<br />
Figure 3 | Cooperative effects on the decay kinetics in D96N. a, Displacement of mass centre positions as a function of time measured for six bR<br />
monomers forming two different trefoils (Mn1–Mn3; n indicates different trefoils) at pH 7 under different light intensities (Supplementary Fig. S3 and Movie<br />
S4). The green regions correspond to the illumination, and their shade level indicates the relative light intensity (0.007 and 0.5 mW). The blue arrows<br />
indicate the conformational changes of the monomers (M 1 3, M 2 1andM 2 3) that are activated subsequent to the activation of other monomers in the<br />
respective trefoils. b, The top figure <strong>shows</strong> the decay of activated bR monomers (as depicted by the red circle) while the other monomers (the grey circles)<br />
within the respective trefoils are not in the activated state. The exponential decay constant (t) is7.3+0.58 s (n T ¼ 279, n m ¼ 55). On the other hand, when<br />
one or two nearest-neighbour molecules (as depicted by green circles in the middle figure) in a trefoil are already activated, the bR monomer activated latest<br />
(as depicted by the blue circles in the middle figure) decays faster. The exponential time constant (t) is shortened to 2.0+0.16 s (n T ¼ 228,<br />
n m ¼ 55). In contrast, the early activated molecules within a trefoil (as depicted by green circles in the bottom figure) show a non-exponential broad<br />
distribution of decay time with an average of 13.3 s (n T ¼ 194, n m ¼ 55).<br />
NATURE NANOTECHNOLOGY | ADVANCE ONLINE PUBLICATION | www.nature.com/naturenanotechnology 3<br />
© 2010 Macmillan Publishers Limited. All rights reserved.
LETTERS<br />
NATURE NANOTECHNOLOGY DOI: 10.1038/NNANO.2010.7<br />
Number of molecules (N) Number of molecules (N)<br />
80<br />
60<br />
40<br />
20<br />
0<br />
60<br />
40<br />
20<br />
0<br />
0<br />
0<br />
5<br />
5<br />
10<br />
10<br />
Weaker light intensity<br />
15<br />
15<br />
20 25<br />
Time (s)<br />
20 25<br />
Time (s)<br />
to 13 s. This observation indicates that the early activated<br />
monomers do not return to the ground state as long as the adjacent<br />
monomers within the trefoil are in the active state.<br />
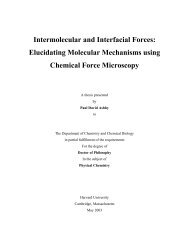
In addition, Fig. 4 <strong>shows</strong> decay of the activated D96N under weak<br />
or strong light intensities. Note that all the activated molecules were<br />
counted regardless of their activation order and of the number of<br />
activated monomers in a trefoil. The distributions of the activated<br />
state lifetime are well fit to single exponential functions under<br />
both weak and strong light illumination, and their decay constants<br />
are almost identical, despite the different light intensities. This can<br />
be explained by the coexistence of the positive and negative cooperativity<br />
effects elicited by bR–bR interactions within a trefoil (Fig. 3b).<br />
Because of the coexistence and the bipolar nature, the two cooperative<br />
effects cancel out one another on averaging, resulting in a constant<br />
decay rate independent of light intensity. Under a conceivable<br />
assumption that the conformational change turnover of an activated<br />
bR monomer is tightly coupled with proton transfer by the bR<br />
monomer, the average rate of proton pumping by the activated bR<br />
would be conserved independently of light intensity. As a result of<br />
the cancellation effect, the cooperative effects can never be detected<br />
by ensemble averaging approaches. Thus, the cooperative effects are<br />
different from those proposed from absorption spectroscopic<br />
studies in which fast and slow decays of the M-state were detected<br />
that depend on light intensity, while the total turnover rate was independent<br />
of light intensity 28,29 . This previous report is consistent with<br />
our presumption that the activated state detected by high-<strong>speed</strong><br />
30<br />
Stronger light intensity<br />
Figure 4 | Decay rate of activated D96N under different light intensities.<br />
The upper figure <strong>shows</strong> the decay of activated molecules under weak<br />
illumination (0.004–0.09 mW). Although the frequency is low, two bR<br />
monomers in a trefoil are activated together, the events of which are also<br />
counted in this analysis. The exponential decay constant (t) is5.4+ 0.34 s<br />
(n T ¼ 429, n m ¼ 55). The bottom figure <strong>shows</strong> the decay of activated<br />
molecules under relatively strong illumination (0.23 or 0.5 mW). The<br />
exponential decay constant (t) is6.1+0.37 s (n T ¼ 416, n m ¼ 55).<br />
30<br />
35<br />
35<br />
40<br />
40<br />
45<br />
45<br />
AFM contains both the M-state and subsequent states.<br />
Importantly, the cooperative effects we found are caused by bR–<br />
bR interactions within a trefoil, not within a trimer.<br />
As demonstrated above, direct and real-space visualization of the<br />
<strong>dynamic</strong>ally changing structure of stimulated proteins provides a<br />
straightforward way of elucidating how protein molecules function.<br />
We can expect that a large number of <strong>dynamic</strong> bio<strong>molecular</strong><br />
processes will be directly visualized in the near future, leading to<br />
new findings inaccessible using other approaches. With further<br />
advances in high-<strong>speed</strong> AFM techniques, even <strong>molecular</strong> processes<br />
on membranes of live cells will be directly visualized. The present<br />
study is the first step towards achieving these expected innovations<br />
in biological research.<br />
Methods<br />
Sample preparation. Purple membranes containing either WT or D96N mutant<br />
were isolated from Halobacterium salinarum as described previously 30 . The samples<br />
were suspended in a solution containing 10 mM Tris-HCl (pH 7, 8, 9 or 10) and<br />
300 mM KCl.<br />
<strong>High</strong>-<strong>speed</strong> AFM observation. The laboratory-built high-<strong>speed</strong> AFM apparatus is<br />
an extensively improved version of the previously reported one 6 . See a<br />
comprehensive review 7 of instrument development, including recent technical<br />
advances. AFM images were acquired in the tapping mode. To detect cantilever<br />
deflection, we used an optical beam deflection detector equipped with an infrared<br />
laser (980 nm). The laser beam was focused onto a small cantilever using a 50<br />
objective lens. The cantilever (Olympus) was 6–7 mm long, 2 mm wide and 90 nm<br />
thick, with a spring constant of 0.1–0.2 N m 21 . Its resonant frequency and quality<br />
factor in aqueous solution were 1 MHz and 2, respectively. In the AFM imaging,<br />
the free oscillation amplitude was 1 nm and the set-point amplitude was 90% of<br />
the free amplitude. The tapping <strong>force</strong> estimated was less than 30 pN. An amorphous<br />
carbon tip was grown on the original tip by electron-beam deposition. The tip length<br />
was adjusted to 1 mm, and the tip apex was sharpened by plasma etching under<br />
argon gas (4 nm in radius). AFM observations were performed under solution at<br />
room temperature. For illumination of the bR sample, a green laser (532 nm) was<br />
irradiated through the 50 objective lens. The intensity measured at the exit of the<br />
objective lens was varied in the range 0.004–0.5 mW.<br />
Data analysis of mass centre position. The mass centre positions of imaged bR<br />
monomers were calculated by the following procedures. First, a whole AFM image<br />
was segmented into each monomer region by a watershed algorithm. Second, the<br />
greyscale of each segment was digitized using a threshold determined by a fuzzyentropy<br />
algorithm. The pixels with greyscales above threshold were defined as those<br />
of a monomer (region of interest; ROI). Finally, the centre of mass of a monomer<br />
was calculated for the ROI using the pixel positions and the greyscales. Note that the<br />
centre of mass analysed here is not the real centre of mass of the protein, but that of<br />
the AFM image of the monomer.<br />
Received 1 September 2009; accepted 8 January 2010;<br />
published online 14 February 2010<br />
References<br />
1. Binnig, G., Quate, C. F. & Gerber, C. Atomic <strong>force</strong> microscope. Phys. Rev. Lett.<br />
56, 930–933 (1986).<br />
2. Drake, B. et al. Imaging crystals, polymers and processes in water with the<br />
<strong>atomic</strong> <strong>force</strong> microscope. Science 243, 1586–1589 (1989).<br />
3. Butt, H. J., Downing, K. H. & Hansma, P. K. Imaging the membrane protein<br />
bacteriorhodopsin with the <strong>atomic</strong> <strong>force</strong> microscope. Biophys. J. 58,<br />
1473–1480 (1990).<br />
4. Müller, D. J. et al. Atomic <strong>force</strong> <strong>microscopy</strong> of native purple membrane.<br />
Biochim. Biophys. Acta 1460, 27–38 (2000).<br />
5. Müller, D. J. AFM: a nanotool in membrane biology. Biochemistry 47,<br />
7986–7998 (2008).<br />
6. Ando, T. et al. A high-<strong>speed</strong> <strong>atomic</strong> <strong>force</strong> microscope for studying biological<br />
macromolecules. Proc. Natl Acad. Sci. USA 98, 12468–12472 (2001).<br />
7. Ando, T., Uchihashi, T. & Fukuma, T. <strong>High</strong>-<strong>speed</strong> <strong>atomic</strong> <strong>force</strong> <strong>microscopy</strong> for<br />
nano-visualization of <strong>dynamic</strong> bio<strong>molecular</strong> processes. Prog. Sur. Sci. 83,<br />
337–437 (2008).<br />
8. Hansma, P. K., Schitter, G., Fantner, G. E. & Prater, C. Applied physics.<br />
<strong>High</strong>-<strong>speed</strong> <strong>atomic</strong> <strong>force</strong> <strong>microscopy</strong>. Science 314, 601–602 (2006).<br />
9. Fantner, G. E. et al. Components for high <strong>speed</strong> <strong>atomic</strong> <strong>force</strong> <strong>microscopy</strong>.<br />
Ultra<strong>microscopy</strong> 106, 881–887 (2006).<br />
10. Yamashita, H. et al. Tip–sample distance control using photothermal actuation<br />
of a small cantilever for high-<strong>speed</strong> <strong>atomic</strong> <strong>force</strong> <strong>microscopy</strong>. Rev. Sci. Instrum.<br />
78, 083702 (2007).<br />
4<br />
NATURE NANOTECHNOLOGY | ADVANCE ONLINE PUBLICATION | www.nature.com/naturenanotechnology<br />
© 2010 Macmillan Publishers Limited. All rights reserved.
NATURE NANOTECHNOLOGY DOI: 10.1038/NNANO.2010.7<br />
LETTERS<br />
11. Haupts, U., Tittor, J. & Oesterhelt, D. Closing in on bacteriorhodopsin:<br />
progress in understanding the molecule. Annu. Rev. Biophys. Biomol. Struct. 28,<br />
367–399 (1999).<br />
12. Lanyi, J. K. Bacteriorhodopsin. Annu. Rev. Physiol. 66, 665–688 (2004).<br />
13. Kimura, Y. et al. Surface of bacteriorhodopsin revealed by high-resolution<br />
electron crystallography. Nature 389, 206–211 (1997).<br />
14. Luecke, H., Schobert, B., Richter, H. T., Cartailler, J. P. & Lanyi, J. K. Structure of<br />
bacteriorhodopsin at 1.55 Å resolution. J. Mol. Biol. 291, 899–911 (1999).<br />
15. Dencher, N. A., Dresselhaus, D., Zaccai, G. & Buldt, G. Structural changes in<br />
bacteriorhodopsin during proton translocation revealed by neutron diffraction.<br />
Proc. Natl Acad. Sci. USA 86, 7876–7879 (1989).<br />
16. Subramaniam, S., Gerstein, M., Oesterhelt, D. & Henderson, R. Electron<br />
diffraction analysis of structural changes in the photocycle of bacteriorhodopsin.<br />
EMBO J. 12, 1–8 (1993).<br />
17. Kamikubo, H. et al. Structure of the N intermediate of bacteriorhodopsin<br />
revealed by X-ray diffraction. Proc. Natl Acad. Sci. USA 93, 1386–1390 (1996).<br />
18. Thorgeirsson, T. E. et al. Transient channel-opening in bacteriorhodopsin: an<br />
EPR study. J. Mol. Biol. 273, 951–957 (1997).<br />
19. Brown, L. S., Needleman, R. & Lanyi, J. K. Conformational change of the E–F<br />
interhelical loop in the M photointermediate of bacteriorhodopsin. J. Mol. Biol.<br />
317, 471–478 (2002).<br />
20. Shibata, M. & Kandori, H. FTIR studies of internal water molecules in the Schiff<br />
base region of bacteriorhodopsin. Biochemistry 44, 7406–7413 (2005).<br />
21. Sass, H. J. et al. Structural alterations for proton translocation in the M state of<br />
wild-type bacteriorhodopsin. Nature 406, 649–653 (2000).<br />
22. Luecke, H., Schobert, B., Richter, H. T., Cartailler, J. P. & Lanyi, J. K. Structural<br />
changes in bacteriorhodopsin during ion transport at 2 angstrom resolution.<br />
Science 286, 255–261 (1999).<br />
23. Subramaniam, S. & Henderson, R. Molecular mechanism of vectorial proton<br />
translocation by bacteriorhodopsin. Nature 406, 653–657 (2000).<br />
24. Vonck, J. Structure of the bacteriorhodopsin mutant F219 L N intermediate<br />
revealed by electron crystallography. EMBO J. 19, 2152–2160 (2000).<br />
25. Xiao, W., Brown, L. S., Needleman, R., Lanyi, J. K. & Shin, Y. K. Light-induced<br />
rotation of a transmembrane alpha-helix in bacteriorhodopsin. J. Mol. Biol. 304,<br />
715–721 (2000).<br />
26. Otto, H. et al. Aspartic acid-96 is the internal proton donor in the<br />
reprotonation of the Schiff base of bacteriorhodopsin. Proc. Natl Acad. Sci.<br />
USA 86, 9228–9232 (1989).<br />
27. Heymann, J. B. et al. Charting the surfaces of the purple membrane. J. Struct.<br />
Biol. 128, 243–249 (1999).<br />
28. Korenstein, R., Hess, B. & Markus, M. Cooperativity in the photocycle of purple<br />
membrane of Halobacterium halobium with a mechanism of free energy<br />
transduction. FEBS Lett. 102, 155–161 (1979).<br />
29. Váró, G., Needleman, R. & Lanyi, J. K. Protein structural change at the<br />
cytoplasmic surface as the cause of cooperativity in the bacteriorhodopsin<br />
photocycle. Biophys. J. 70, 461–467 (1996).<br />
30. Oesterhelt, D. & Stoeckenius, W. Isolation of the cell membrane of<br />
Halobacterium halobium and its fractionation into red and purple membrane.<br />
Methods Enzymol. 31, 667–678 (1973).<br />
Acknowledgements<br />
This work was supported by Japan Science and Technology Agency for Core Research for<br />
Evolutional Science and Technology (T.A.), Grants-in-Aids for Scientific Research from<br />
Japan Society for the Promotion of Science (JSPS) (no. 15101005; T.A.) and from the<br />
Ministry of Education, Culture, Sports, Science and Technology, Japan (no. 19042009, T.U.;<br />
no. 20108014, H.K.), and Research Fellowships of JSPS for Young Scientists (M.S. and<br />
H.Y.). The authors thank J.K. Lanyi, S.P. Balashov and L.S. Brown for comments<br />
on the draft.<br />
Author contributions<br />
T.A., H.K. and M.S. conceived and designed the experiments. T.A. and T.U. developed the<br />
high-<strong>speed</strong> AFM instrument. T.U., M.S. and H.Y. performed the experiments. T.U. and<br />
M.S. analysed the data. T.A., T.U. and M.S. co-wrote the paper. All authors discussed the<br />
results and commented on the manuscript.<br />
Additional information<br />
The authors declare no competing financial interests. Supplementary information<br />
accompanies this paper at www.nature.com/naturenanotechnology. Reprints and<br />
permission information is available online at http://npg.nature.com/reprintsandpermissions/.<br />
Correspondence and requests for materials should be addressed to T.A.<br />
NATURE NANOTECHNOLOGY | ADVANCE ONLINE PUBLICATION | www.nature.com/naturenanotechnology 5<br />
© 2010 Macmillan Publishers Limited. All rights reserved.