Download the interactive SABMiller plc 2011 Annual report PDF
Download the interactive SABMiller plc 2011 Annual report PDF
Download the interactive SABMiller plc 2011 Annual report PDF

You also want an ePaper? Increase the reach of your titles
YUMPU automatically turns print PDFs into web optimized ePapers that Google loves.
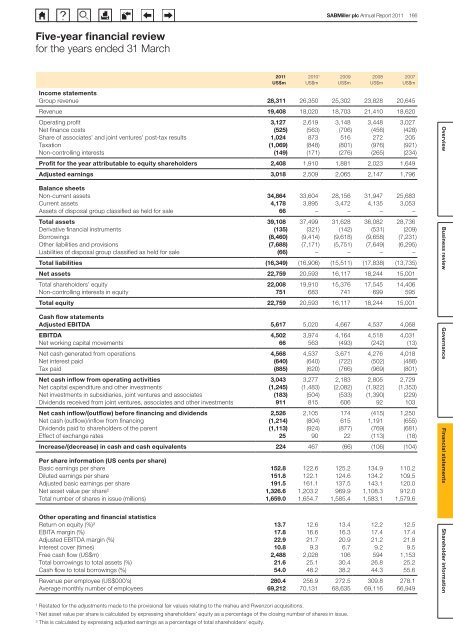
<strong>SABMiller</strong> <strong>plc</strong> <strong>Annual</strong> Report <strong>2011</strong> 166<br />
Five-year financial review<br />
for <strong>the</strong> years ended 31 March<br />
Income statements<br />
Group revenue 28,311 26,350 25,302 23,828 20,645<br />
Revenue 19,408 18,020 18,703 21,410 18,620<br />
Operating profit 3,127 2,619 3,148 3,448 3,027<br />
Net finance costs (525) (563) (706) (456) (428)<br />
Share of associates’ and joint ventures’ post-tax results 1,024 873 516 272 205<br />
Taxation (1,069) (848) (801) (976) (921)<br />
Non-controlling interests (149) (171) (276) (265) (234)<br />
Profit for <strong>the</strong> year attributable to equity shareholders 2,408 1,910 1,881 2,023 1,649<br />
Adjusted earnings 3,018 2,509 2,065 2,147 1,796<br />
Balance sheets<br />
Non-current assets 34,864 33,604 28,156 31,947 25,683<br />
Current assets 4,178 3,895 3,472 4,135 3,053<br />
Assets of disposal group classified as held for sale 66 – – – –<br />
Total assets 39,108 37,499 31,628 36,082 28,736<br />
Derivative financial instruments (135) (321) (142) (531) (209)<br />
Borrowings (8,460) (9,414) (9,618) (9,658) (7,231)<br />
O<strong>the</strong>r liabilities and provisions (7,688) (7,171) (5,751) (7,649) (6,295)<br />
Liabilities of disposal group classified as held for sale (66) – – – –<br />
Total liabilities (16,349) (16,906) (15,511) (17,838) (13,735)<br />
Net assets 22,759 20,593 16,117 18,244 15,001<br />
Total shareholders’ equity 22,008 19,910 15,376 17,545 14,406<br />
Non-controlling interests in equity 751 683 741 699 595<br />
Total equity 22,759 20,593 16,117 18,244 15,001<br />
Cash flow statements<br />
Adjusted EBITDA 5,617 5,020 4,667 4,537 4,068<br />
EBITDA 4,502 3,974 4,164 4,518 4,031<br />
Net working capital movements 66 563 (493) (242) (13)<br />
Net cash generated from operations 4,568 4,537 3,671 4,276 4,018<br />
Net interest paid (640) (640) (722) (502) (488)<br />
Tax paid (885) (620) (766) (969) (801)<br />
Net cash inflow from operating activities 3,043 3,277 2,183 2,805 2,729<br />
Net capital expenditure and o<strong>the</strong>r investments (1,245) (1,483) (2,082) (1,922) (1,353)<br />
Net investments in subsidiaries, joint ventures and associates (183) (504) (533) (1,390) (229)<br />
Dividends received from joint ventures, associates and o<strong>the</strong>r investments 911 815 606 92 103<br />
Net cash inflow/(outflow) before financing and dividends 2,526 2,105 174 (415) 1,250<br />
Net cash (outflow)/inflow from financing (1,214) (804) 615 1,191 (655)<br />
Dividends paid to shareholders of <strong>the</strong> parent (1,113) (924) (877) (769) (681)<br />
Effect of exchange rates 25 90 22 (113) (18)<br />
Increase/(decrease) in cash and cash equivalents 224 467 (66) (106) (104)<br />
Per share information (US cents per share)<br />
Basic earnings per share 152.8 122.6 125.2 134.9 110.2<br />
Diluted earnings per share 151.8 122.1 124.6 134.2 109.5<br />
Adjusted basic earnings per share 191.5 161.1 137.5 143.1 120.0<br />
Net asset value per share 2 1,326.6 1,203.2 969.9 1,108.3 912.0<br />
Total number of shares in issue (millions) 1,659.0 1,654.7 1,585.4 1,583.1 1,579.6<br />
O<strong>the</strong>r operating and financial statistics<br />
Return on equity (%) 3 13.7 12.6 13.4 12.2 12.5<br />
EBITA margin (%) 17.8 16.6 16.3 17.4 17.4<br />
Adjusted EBITDA margin (%) 22.9 21.7 20.9 21.2 21.8<br />
Interest cover (times) 10.8 9.3 6.7 9.2 9.5<br />
Free cash flow (US$m) 2,488 2,028 106 594 1,153<br />
Total borrowings to total assets (%) 21.6 25.1 30.4 26.8 25.2<br />
Cash flow to total borrowings (%) 54.0 48.2 38.2 44.3 55.6<br />
Revenue per employee (US$000’s) 280.4 256.9 272.5 309.8 278.1<br />
Average monthly number of employees 69,212 70,131 68,635 69,116 66,949<br />
<strong>2011</strong><br />
US$m<br />
2010 1<br />
US$m<br />
2009<br />
US$m<br />
2008<br />
US$m<br />
2007<br />
US$m<br />
Overview Business review Governance Financial statements Shareholder information<br />
1 Restated for <strong>the</strong> adjustments made to <strong>the</strong> provisional fair values relating to <strong>the</strong> maheu and Rwenzori acquisitions.<br />
2 Net asset value per share is calculated by expressing shareholders’ equity as a percentage of <strong>the</strong> closing number of shares in issue.<br />
3 This is calculated by expressing adjusted earnings as a percentage of total shareholders’ equity.