Download the interactive SABMiller plc 2011 Annual report PDF
Download the interactive SABMiller plc 2011 Annual report PDF
Download the interactive SABMiller plc 2011 Annual report PDF

You also want an ePaper? Increase the reach of your titles
YUMPU automatically turns print PDFs into web optimized ePapers that Google loves.
<strong>SABMiller</strong> <strong>plc</strong> <strong>Annual</strong> Report <strong>2011</strong> 39<br />
Carling Black Label<br />
A full-flavoured lager with low<br />
bitterness and a distinctive, fruity<br />
aroma, Carling Black Label is refreshing<br />
and highly rewarding to drink. It’s what<br />
makes it a ‘champion beer’ preferred<br />
by consumers and international<br />
experts alike.<br />
Origin: <br />
South Africa<br />
First brewed: 1966<br />
Profit and earnings<br />
Adjusted profit before tax of US$4,491 million<br />
increased by 18% over <strong>the</strong> prior year due to <strong>the</strong><br />
increased EBITA and lower finance costs. On a<br />
statutory basis, profit before tax of US$3,626 million<br />
was 24% higher than <strong>the</strong> prior year. The table below<br />
reconciles EBITA to adjusted profit before tax and to<br />
<strong>the</strong> statutory profit before tax.<br />
<strong>2011</strong><br />
US$m<br />
2010<br />
US$m<br />
%<br />
change<br />
EBITA 5,044 4,381 15<br />
Adjusted finance costs (518) (538) 4<br />
Share of associates’ and joint<br />
ventures’ finance costs (35) (40) 12<br />
Adjusted profit before tax 4,491 3,803 18<br />
Exceptional items (excluding<br />
finance cost exceptionals) (467) (490) 5<br />
Adjustments to finance costs (7) (25) 72<br />
Amortisation (209) (199) (5)<br />
Share of associates’ and joint<br />
ventures’ tax and noncontrolling<br />
interests (182) (160) (14)<br />
Profit before tax 3,626 2,929 24<br />
Adjusted earnings increased by 20% to US$3,018<br />
million. With <strong>the</strong> weighted average number of basic<br />
shares in issue for <strong>the</strong> year of 1,576 million, up<br />
slightly from last year’s 1,558 million, we achieved<br />
strong adjusted earnings per share growth in both<br />
our <strong>report</strong>ing currency of US dollars and also in<br />
<strong>the</strong> currencies in which our shares are quoted,<br />
as demonstrated in <strong>the</strong> table below.<br />
<strong>2011</strong> 2010 % change<br />
US cents 191.5 161.1 19<br />
UK pence 123.4 100.6 23<br />
South African cents 1,369.6 1,253.8 9<br />
A reconciliation of <strong>the</strong> statutory measure of profit<br />
attributable to equity shareholders with adjusted<br />
earnings is shown in note 8 to <strong>the</strong> consolidated<br />
financial statements. On a statutory basis, basic<br />
earnings per share were 25% up on <strong>the</strong> prior year<br />
primarily as a result of higher profit before tax, lower<br />
profit attributable to non-controlling interests and<br />
only a minimal increase in <strong>the</strong> weighted average<br />
number of shares in issue in <strong>the</strong> year.<br />
Dividends<br />
The board has proposed a final dividend of 61.5<br />
US cents to make a total of 81 US cents per share<br />
for <strong>the</strong> year – an increase of 19% over <strong>the</strong> prior<br />
year. This represents dividend cover of 2.4 times<br />
based on adjusted earnings per share (2010: 2.4<br />
times). Our guideline is to achieve dividend cover<br />
of between 2.0 and 2.5 times adjusted earnings.<br />
The relationship between <strong>the</strong> growth in dividends<br />
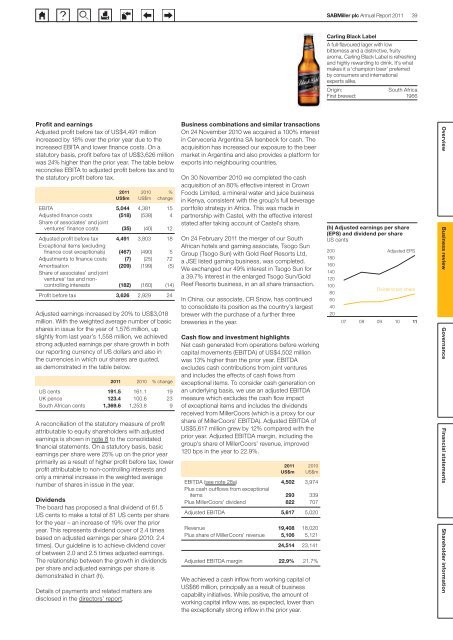
per share and adjusted earnings per share is<br />
demonstrated in chart (h).<br />
Details of payments and related matters are<br />
disclosed in <strong>the</strong> directors’ <strong>report</strong>.<br />
Business combinations and similar transactions<br />
On 24 November 2010 we acquired a 100% interest<br />
in Cerveceria Argentina SA Isenbeck for cash. The<br />
acquisition has increased our exposure to <strong>the</strong> beer<br />
market in Argentina and also provides a platform for<br />
exports into neighbouring countries.<br />
On 30 November 2010 we completed <strong>the</strong> cash<br />
acquisition of an 80% effective interest in Crown<br />
Foods Limited, a mineral water and juice business<br />
in Kenya, consistent with <strong>the</strong> group’s full beverage<br />
portfolio strategy in Africa. This was made in<br />
partnership with Castel, with <strong>the</strong> effective interest<br />
stated after taking account of Castel’s share.<br />
On 24 February <strong>2011</strong> <strong>the</strong> merger of our South<br />
African hotels and gaming associate, Tsogo Sun<br />
Group (Tsogo Sun) with Gold Reef Resorts Ltd,<br />
a JSE listed gaming business, was completed.<br />
We exchanged our 49% interest in Tsogo Sun for<br />
a 39.7% interest in <strong>the</strong> enlarged Tsogo Sun/Gold<br />
Reef Resorts business, in an all share transaction.<br />
In China, our associate, CR Snow, has continued<br />
to consolidate its position as <strong>the</strong> country’s largest<br />
brewer with <strong>the</strong> purchase of a fur<strong>the</strong>r three<br />
breweries in <strong>the</strong> year.<br />
Cash flow and investment highlights<br />
Net cash generated from operations before working<br />
capital movements (EBITDA) of US$4,502 million<br />
was 13% higher than <strong>the</strong> prior year. EBITDA<br />
excludes cash contributions from joint ventures<br />
and includes <strong>the</strong> effects of cash flows from<br />
exceptional items. To consider cash generation on<br />
an underlying basis, we use an adjusted EBITDA<br />
measure which excludes <strong>the</strong> cash flow impact<br />
of exceptional items and includes <strong>the</strong> dividends<br />
received from MillerCoors (which is a proxy for our<br />
share of MillerCoors’ EBITDA). Adjusted EBITDA of<br />
US$5,617 million grew by 12% compared with <strong>the</strong><br />
prior year. Adjusted EBITDA margin, including <strong>the</strong><br />
group’s share of MillerCoors’ revenue, improved<br />
120 bps in <strong>the</strong> year to 22.9%.<br />
<strong>2011</strong><br />
US$m<br />
2010<br />
US$m<br />
EBITDA (see note 28a) 4,502 3,974<br />
Plus cash outflows from exceptional<br />
items 293 339<br />
Plus MillerCoors’ dividend 822 707<br />
Adjusted EBITDA 5,617 5,020<br />
Revenue 19,408 18,020<br />
Plus share of MillerCoors’ revenue 5,106 5,121<br />
24,514 23,141<br />
Adjusted EBITDA margin 22.9% 21.7%<br />
We achieved a cash inflow from working capital of<br />
US$66 million, principally as a result of business<br />
capability initiatives. While positive, <strong>the</strong> amount of<br />
working capital inflow was, as expected, lower than<br />
<strong>the</strong> exceptionally strong inflow in <strong>the</strong> prior year.<br />
(h) Adjusted earnings per share<br />
(EPS) and dividend per share<br />
US cents<br />
200<br />
180<br />
160<br />
140<br />
120<br />
100<br />
80<br />
60<br />
40<br />
20<br />
07 08 09 10<br />
Adjusted EPS<br />
Dividend per share<br />
11<br />
Overview Business review Governance Financial statements Shareholder information