Practical issues in the construction of control charts in ... - saimm
Practical issues in the construction of control charts in ... - saimm
Practical issues in the construction of control charts in ... - saimm

Create successful ePaper yourself
Turn your PDF publications into a flip-book with our unique Google optimized e-Paper software.
<strong>Practical</strong> <strong>issues</strong> <strong>in</strong> <strong>the</strong> <strong>construction</strong> <strong>of</strong> <strong>control</strong> <strong>charts</strong> <strong>in</strong> m<strong>in</strong><strong>in</strong>g applications<br />
follow <strong>the</strong> normal curve as predicted by <strong>the</strong> Central Limit<br />
Theorem (Grant and Leavenworth, 1980). However,<br />
accord<strong>in</strong>g to Spedd<strong>in</strong>g and Rawl<strong>in</strong>gs (1994), more extreme<br />
population distribution may require larger sample sizes to<br />
achieve a normal distribution <strong>of</strong> sample means. This<br />
situation can usually be encountered <strong>in</strong> m<strong>in</strong><strong>in</strong>g applications<br />
which may prohibit <strong>the</strong> application <strong>of</strong> <strong>the</strong> conventional<br />
Shewhart X — and R <strong>charts</strong>. Even though <strong>the</strong> assumption <strong>of</strong> <strong>the</strong><br />
normality can sometimes be met because <strong>of</strong> <strong>the</strong> Central Limit<br />
Theorem, <strong>the</strong> need for <strong>the</strong> sample observations to be statistically<br />
<strong>in</strong>dependent can be a much more serious problem as<br />
autocorrelation among <strong>the</strong> observations becomes <strong>in</strong>herent<br />
characteristic <strong>in</strong> m<strong>in</strong>eral deposits where ore grades are<br />
spatially related. As a result it is expected that <strong>the</strong> sample<br />
observations X(t) and X(t+1) will be positively autocorrelated.<br />
Fur<strong>the</strong>r, <strong>the</strong> sample means may tend to drift over<br />
time. Any one or comb<strong>in</strong>ation <strong>of</strong> <strong>the</strong>se <strong>issues</strong> perta<strong>in</strong><strong>in</strong>g to<br />
<strong>the</strong> behaviour <strong>of</strong> a quality characteristic <strong>in</strong> statistical quality<br />
<strong>control</strong> does not mean that <strong>the</strong> quality characteristic is out <strong>of</strong><br />
<strong>control</strong>. They merely represent <strong>the</strong> <strong>in</strong>herent quality variation.<br />
An application <strong>of</strong> a conventional Shewhart chart <strong>in</strong> <strong>the</strong>se<br />
cases will result <strong>in</strong> many false alarms lead<strong>in</strong>g to unjustified<br />
searches for assignable causes.<br />
Many quality <strong>control</strong> operations <strong>in</strong> m<strong>in</strong><strong>in</strong>g deal with<br />
<strong>control</strong>l<strong>in</strong>g more than one variable for meet<strong>in</strong>g <strong>the</strong> quality<br />
specifications. In such cases, an application <strong>of</strong> <strong>the</strong> univariate<br />
<strong>control</strong> <strong>charts</strong> is unsatisfactory as it fails to consider <strong>the</strong><br />
problem <strong>in</strong> multivariate situation ignor<strong>in</strong>g correlation<br />
structures amongst <strong>the</strong> variables. Hence, multivariate <strong>control</strong><br />
<strong>charts</strong> should be constructed to identify an out <strong>of</strong> <strong>control</strong><br />
condition.<br />
Thus <strong>the</strong> above discussions clearly revealed that selection<br />
<strong>of</strong> an appropriate <strong>control</strong> chart depends upon m<strong>in</strong>e-specific<br />
situations. In this paper, a guidel<strong>in</strong>e is proposed for select<strong>in</strong>g<br />
<strong>control</strong> <strong>charts</strong> for a variety <strong>of</strong> situations. Fur<strong>the</strong>r, a study is<br />
presented to demonstrate <strong>the</strong> use <strong>of</strong> <strong>the</strong> suggested guidel<strong>in</strong>e<br />
for <strong>construction</strong> <strong>of</strong> proper <strong>charts</strong> for a bauxite m<strong>in</strong>e.<br />
Methodology<br />
Ore quality depends upon a number <strong>of</strong> factors such as<br />
variation <strong>of</strong> <strong>in</strong> situ grade, extraction method and equipment,<br />
production plann<strong>in</strong>g, grade <strong>control</strong> at faces, ore blend<strong>in</strong>g, ore<br />
dilution and subsequent process<strong>in</strong>g <strong>of</strong> ore. Depend<strong>in</strong>g upon<br />
<strong>the</strong> grade <strong>control</strong> practices at m<strong>in</strong>es, <strong>the</strong> ore quality may<br />
follow a systematic pattern or it may behave erratically<br />
because <strong>of</strong> occasional presence <strong>of</strong> some assignable causes.<br />
The systematic pattern <strong>of</strong> variation <strong>of</strong> a quality characteristic<br />
may be due to chance causes <strong>of</strong> variation such as <strong>in</strong>herent<br />
variation <strong>of</strong> grade <strong>of</strong> a block, variation <strong>of</strong> grades <strong>of</strong> different<br />
blocks, and occurrence <strong>of</strong> low/high grade zones with<strong>in</strong> a<br />
deposit. On <strong>the</strong> o<strong>the</strong>r hand, various assignable causes <strong>of</strong><br />
quality variations are: improper estimation <strong>of</strong> <strong>in</strong> situ grade <strong>of</strong><br />
ore, misclassification <strong>of</strong> ore and waste blocks, improper<br />
blend<strong>in</strong>g and process<strong>in</strong>g <strong>of</strong> ore. As mentioned before, an<br />
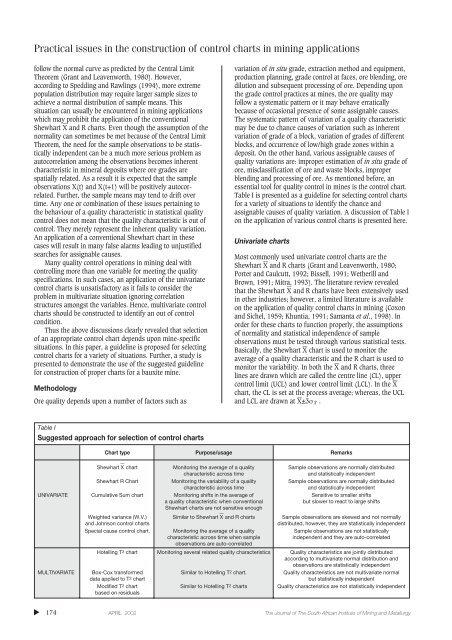
essential tool for quality <strong>control</strong> <strong>in</strong> m<strong>in</strong>es is <strong>the</strong> <strong>control</strong> chart.<br />
Table I is presented as a guidel<strong>in</strong>e for select<strong>in</strong>g <strong>control</strong> <strong>charts</strong><br />
for a variety <strong>of</strong> situations to identify <strong>the</strong> chance and<br />
assignable causes <strong>of</strong> quality variation. A discussion <strong>of</strong> Table I<br />
on <strong>the</strong> application <strong>of</strong> various <strong>control</strong> <strong>charts</strong> is presented here.<br />
Univariate <strong>charts</strong><br />
Most commonly used univariate <strong>control</strong> <strong>charts</strong> are <strong>the</strong><br />
Shewhart X — and R <strong>charts</strong> (Grant and Leavenworth, 1980;<br />
Porter and Caulcutt, 1992; Bissell, 1991; We<strong>the</strong>rill and<br />
Brown, 1991; Mitra, 1993). The literature review revealed<br />
that <strong>the</strong> Shewhart X — and R <strong>charts</strong> have been extensively used<br />
<strong>in</strong> o<strong>the</strong>r <strong>in</strong>dustries; however, a limited literature is available<br />
on <strong>the</strong> application <strong>of</strong> quality <strong>control</strong> <strong>charts</strong> <strong>in</strong> m<strong>in</strong><strong>in</strong>g (Coxon<br />
and Sichel, 1959; Khuntia, 1991; Samanta et al., 1998). In<br />
order for <strong>the</strong>se <strong>charts</strong> to function properly, <strong>the</strong> assumptions<br />
<strong>of</strong> normality and statistical <strong>in</strong>dependence <strong>of</strong> sample<br />
observations must be tested through various statistical tests.<br />
Basically, <strong>the</strong> Shewhart X — chart is used to monitor <strong>the</strong><br />
average <strong>of</strong> a quality characteristic and <strong>the</strong> R chart is used to<br />
monitor <strong>the</strong> variability. In both <strong>the</strong> X — and R <strong>charts</strong>, three<br />
l<strong>in</strong>es are drawn which are called <strong>the</strong> centre l<strong>in</strong>e (CL), upper<br />
<strong>control</strong> limit (UCL) and lower <strong>control</strong> limit (LCL). In <strong>the</strong> X —<br />
chart, <strong>the</strong> CL is set at <strong>the</strong> process average; whereas, <strong>the</strong> UCL<br />
and LCL are drawn at X — ±3σ − X .<br />
Table I<br />
Suggested approach for selection <strong>of</strong> <strong>control</strong> <strong>charts</strong><br />
Chart type Purpose/usage Remarks<br />
Shewhart — X chart Monitor<strong>in</strong>g <strong>the</strong> average <strong>of</strong> a quality Sample observations are normally distributed<br />
characteristic across time<br />
and statistically <strong>in</strong>dependent<br />
Shewhart R Chart Monitor<strong>in</strong>g <strong>the</strong> variability <strong>of</strong> a quality Sample observations are normally distributed<br />
characteristic across time<br />
and statistically <strong>in</strong>dependent<br />
UNIVARIATE Cumulative Sum chart Monitor<strong>in</strong>g shifts <strong>in</strong> <strong>the</strong> average <strong>of</strong> Sensitive to smaller shifts<br />
a quality characteristic when conventional<br />
but slower to react to large shifts<br />
Shewhart <strong>charts</strong> are not sensitive enough<br />
Weighted variance (W.V.) Similar to Shewhart — X and R <strong>charts</strong> Sample observations are skewed and not normally<br />
and Johnson <strong>control</strong> <strong>charts</strong><br />
distributed, however, <strong>the</strong>y are statistically <strong>in</strong>dependent<br />
Special cause <strong>control</strong> chart. Monitor<strong>in</strong>g <strong>the</strong> average <strong>of</strong> a quality Sample observations are not statistically<br />
characteristic across time when sample<br />
<strong>in</strong>dependent and <strong>the</strong>y are auto-correlated<br />
observations are auto-correlated<br />
Hotell<strong>in</strong>g T2 chart Monitor<strong>in</strong>g several related quality characteristics Quality characteristics are jo<strong>in</strong>tly distributed<br />
accord<strong>in</strong>g to multivariate normal distribution and<br />
observations are statistically <strong>in</strong>dependent<br />
MULTIVARIATE Box-Cox transformed Similar to Hotell<strong>in</strong>g T2 chart. Quality characteristics are not multivariate normal<br />
data applied to T2 chart<br />
but statistically <strong>in</strong>dependent<br />
Modified T2 chart Similar to Hotell<strong>in</strong>g T2 <strong>charts</strong> Quality characteristics are not statistically <strong>in</strong>dependent<br />
based on residuals<br />
▲<br />
174 APRIL 2002 The Journal <strong>of</strong> The South African Institute <strong>of</strong> M<strong>in</strong><strong>in</strong>g and Metallurgy