Practical issues in the construction of control charts in ... - saimm
Practical issues in the construction of control charts in ... - saimm
Practical issues in the construction of control charts in ... - saimm

You also want an ePaper? Increase the reach of your titles
YUMPU automatically turns print PDFs into web optimized ePapers that Google loves.
<strong>Practical</strong> <strong>issues</strong> <strong>in</strong> <strong>the</strong> <strong>construction</strong> <strong>of</strong> <strong>control</strong> <strong>charts</strong> <strong>in</strong> m<strong>in</strong><strong>in</strong>g applications<br />
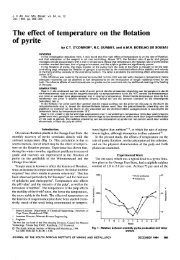
Al 2 O 3 %, 23.3% (7 out <strong>of</strong> 30) <strong>of</strong> <strong>the</strong> samples were out <strong>of</strong><br />
<strong>control</strong> <strong>in</strong> <strong>the</strong> Shewhart X — chart; whereas, <strong>in</strong> <strong>the</strong> simulation<br />
study 6.6% <strong>of</strong> <strong>the</strong> samples were out <strong>of</strong> <strong>control</strong> <strong>in</strong> <strong>the</strong><br />
Shewhart X — chart.<br />
Figure 6—X — chart <strong>of</strong> Al 2 O 3 % for <strong>the</strong> sample m<strong>in</strong>e<br />
Multivariate <strong>control</strong> chart<br />
It is clear that <strong>construction</strong> <strong>of</strong> univariate <strong>control</strong> <strong>charts</strong> for<br />
both <strong>the</strong> variables will result <strong>in</strong> losses <strong>of</strong> <strong>in</strong>formation <strong>of</strong> <strong>the</strong><br />
<strong>in</strong>ter-correlation <strong>of</strong> <strong>the</strong> variables. Therefore, standard<br />
multivariate <strong>control</strong> <strong>charts</strong> should be <strong>in</strong>vestigated <strong>in</strong> addition<br />
to <strong>the</strong> univariate <strong>control</strong> <strong>charts</strong>. As previously mentioned, <strong>the</strong><br />
most popular multivariate <strong>control</strong> chart is <strong>the</strong> Hotell<strong>in</strong>g T2<br />
chart. However, an application <strong>of</strong> <strong>the</strong> Hotell<strong>in</strong>g T2 chart<br />
requires <strong>the</strong> assumption <strong>of</strong> multivariate normality and <strong>the</strong><br />
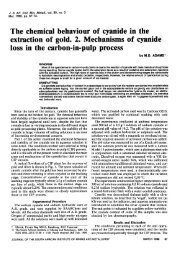
Figure 7—Special cause <strong>control</strong> chart <strong>of</strong> SiO 2 % for <strong>the</strong> sample m<strong>in</strong>e<br />
may be observed <strong>in</strong> <strong>the</strong> Shewhart chart which is constructed<br />
based on <strong>the</strong> orig<strong>in</strong>al data. For example, <strong>the</strong> special cause<br />
<strong>control</strong> chart <strong>of</strong> SiO 2 % presented <strong>in</strong> Figure 7 does not pick up<br />
<strong>the</strong> trend <strong>in</strong> <strong>the</strong> mean values <strong>of</strong> <strong>the</strong> orig<strong>in</strong>al data, which was<br />
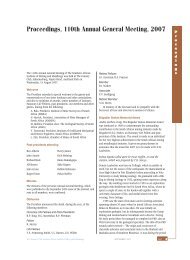
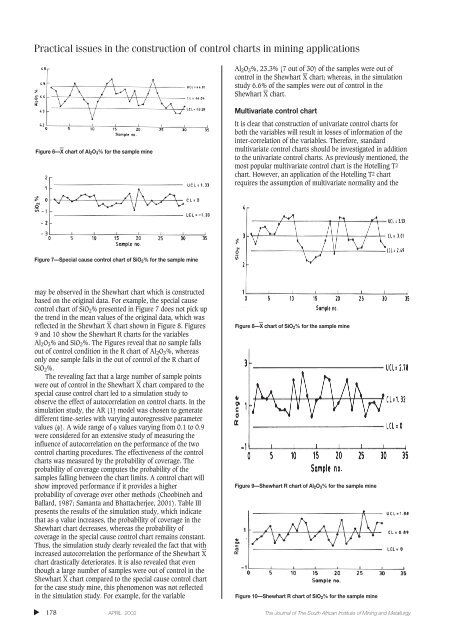
reflected <strong>in</strong> <strong>the</strong> Shewhart X — chart shown <strong>in</strong> Figure 8. Figures<br />
9 and 10 show <strong>the</strong> Shewhart R <strong>charts</strong> for <strong>the</strong> variables<br />
Al 2 O 3 % and SiO 2 %. The Figures reveal that no sample falls<br />
out <strong>of</strong> <strong>control</strong> condition <strong>in</strong> <strong>the</strong> R chart <strong>of</strong> Al 2 O 3 %, whereas<br />
only one sample falls <strong>in</strong> <strong>the</strong> out <strong>of</strong> <strong>control</strong> <strong>of</strong> <strong>the</strong> R chart <strong>of</strong><br />
SiO 2 %.<br />
The reveal<strong>in</strong>g fact that a large number <strong>of</strong> sample po<strong>in</strong>ts<br />
were out <strong>of</strong> <strong>control</strong> <strong>in</strong> <strong>the</strong> Shewhart X — chart compared to <strong>the</strong><br />
special cause <strong>control</strong> chart led to a simulation study to<br />
observe <strong>the</strong> effect <strong>of</strong> autocorrelation on <strong>control</strong> <strong>charts</strong>. In <strong>the</strong><br />
simulation study, <strong>the</strong> AR (1) model was chosen to generate<br />
different time-series with vary<strong>in</strong>g autoregressive parameter<br />
values (φ). A wide range <strong>of</strong> φ values vary<strong>in</strong>g from 0.1 to 0.9<br />
were considered for an extensive study <strong>of</strong> measur<strong>in</strong>g <strong>the</strong><br />
<strong>in</strong>fluence <strong>of</strong> autocorrelation on <strong>the</strong> performance <strong>of</strong> <strong>the</strong> two<br />
<strong>control</strong> chart<strong>in</strong>g procedures. The effectiveness <strong>of</strong> <strong>the</strong> <strong>control</strong><br />
<strong>charts</strong> was measured by <strong>the</strong> probability <strong>of</strong> coverage. The<br />
probability <strong>of</strong> coverage computes <strong>the</strong> probability <strong>of</strong> <strong>the</strong><br />
samples fall<strong>in</strong>g between <strong>the</strong> chart limits. A <strong>control</strong> chart will<br />
show improved performance if it provides a higher<br />
probability <strong>of</strong> coverage over o<strong>the</strong>r methods (Choob<strong>in</strong>eh and<br />
Ballard, 1987; Samanta and Bhattacherjee, 2001). Table III<br />
presents <strong>the</strong> results <strong>of</strong> <strong>the</strong> simulation study, which <strong>in</strong>dicate<br />
that as φ value <strong>in</strong>creases, <strong>the</strong> probability <strong>of</strong> coverage <strong>in</strong> <strong>the</strong><br />
Shewhart chart decreases, whereas <strong>the</strong> probability <strong>of</strong><br />
coverage <strong>in</strong> <strong>the</strong> special cause <strong>control</strong> chart rema<strong>in</strong>s constant.<br />
Thus, <strong>the</strong> simulation study clearly revealed <strong>the</strong> fact that with<br />
<strong>in</strong>creased autocorrelation <strong>the</strong> performance <strong>of</strong> <strong>the</strong> Shewhart X —<br />
chart drastically deteriorates. It is also revealed that even<br />
though a large number <strong>of</strong> samples were out <strong>of</strong> <strong>control</strong> <strong>in</strong> <strong>the</strong><br />
Shewhart X — chart compared to <strong>the</strong> special cause <strong>control</strong> chart<br />
for <strong>the</strong> case study m<strong>in</strong>e, this phenomenon was not reflected<br />
<strong>in</strong> <strong>the</strong> simulation study. For example, for <strong>the</strong> variable<br />
Figure 8—X — chart <strong>of</strong> SiO 2 % for <strong>the</strong> sample m<strong>in</strong>e<br />
Figure 9—Shewhart R chart <strong>of</strong> Al 2 O 3 % for <strong>the</strong> sample m<strong>in</strong>e<br />
Figure 10—Shewhart R chart <strong>of</strong> SiO 2 % for <strong>the</strong> sample m<strong>in</strong>e<br />
▲<br />
178 APRIL 2002 The Journal <strong>of</strong> The South African Institute <strong>of</strong> M<strong>in</strong><strong>in</strong>g and Metallurgy