Practical issues in the construction of control charts in ... - saimm
Practical issues in the construction of control charts in ... - saimm
Practical issues in the construction of control charts in ... - saimm

Create successful ePaper yourself
Turn your PDF publications into a flip-book with our unique Google optimized e-Paper software.
<strong>Practical</strong> <strong>issues</strong> <strong>in</strong> <strong>the</strong> <strong>construction</strong> <strong>of</strong> <strong>control</strong> <strong>charts</strong> <strong>in</strong> m<strong>in</strong><strong>in</strong>g applications<br />
Table III<br />
Probability <strong>of</strong> coverage for special cause <strong>control</strong><br />
chart and Shewhart — X chart<br />
Autoregressive Special cause <strong>control</strong> chart Shewhart — X chart<br />
Parameter (φ) Probability <strong>of</strong> coverage Probability <strong>of</strong> coverage<br />
0.1 0.9966 .9966<br />
0.2 0.9966 .9936<br />
0.3 0.9966 .9840<br />
0.4 0.9966 .9680<br />
0.5 0.9966 .9363<br />
0.6 0.9966 .8816<br />
0.7 0.9966 .8046<br />
0.8 0.9966 .6903<br />
0.9 0.9966 .5320<br />
statistical <strong>in</strong>dependence <strong>of</strong> <strong>the</strong> observations. Therefore, <strong>the</strong><br />
multivariate normality <strong>of</strong> <strong>the</strong> data sets was first verified<br />
before apply<strong>in</strong>g this chart. Although <strong>the</strong> univariate test<br />
statistics showed that <strong>the</strong> variables were normality<br />
distributed, however, <strong>the</strong>re is no guarantee that <strong>the</strong> variables<br />
will jo<strong>in</strong>tly follow multivariate normal distribution. In order<br />
to test <strong>the</strong> multivariate normality <strong>the</strong> criteria given by Mardia<br />
(1970, 1974, 1983,1985) were used, which are ma<strong>in</strong>ly based<br />
on measurement <strong>of</strong> multivariate skewness and kurtosis<br />
values. The results showed that estimated multivariate<br />
skewness and kurtosis values for <strong>the</strong> variables were 0.397<br />
and 2.85, and <strong>the</strong>ir correspond<strong>in</strong>g percentage po<strong>in</strong>ts (p) for<br />
normality were 0.08 and 0.91 respectively. Therefore, <strong>the</strong><br />
assumption <strong>of</strong> multivariate normality for <strong>the</strong> data sets was<br />
satisfied. However, <strong>the</strong> statistical <strong>in</strong>dependence <strong>of</strong> <strong>the</strong> data<br />
sets was not satisfied as previously tested. Therefore, <strong>the</strong><br />
Hotell<strong>in</strong>g T2 chart based on orig<strong>in</strong>al data cannot be an<br />
appropriate choice. As mentioned <strong>in</strong> Table I, <strong>the</strong> modified T2<br />
chart based on forecasted residuals <strong>of</strong> <strong>the</strong> time series models<br />
<strong>of</strong> <strong>the</strong> <strong>in</strong>dividual variables would be constructed.<br />
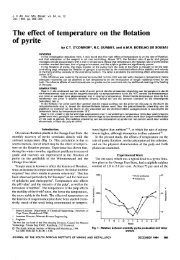
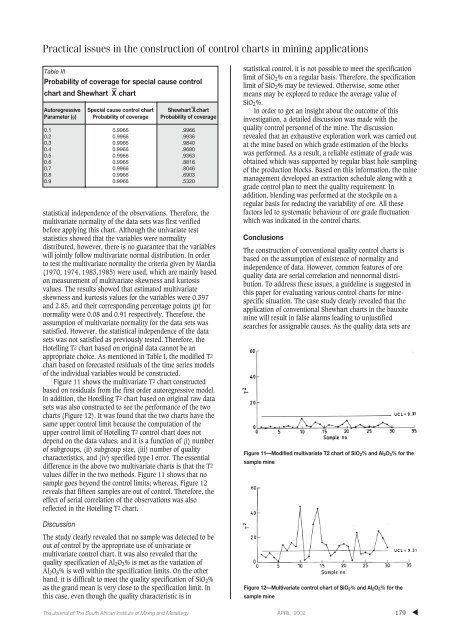
Figure 11 shows <strong>the</strong> multivariate T2 chart constructed<br />
based on residuals from <strong>the</strong> first order autoregressive model.<br />
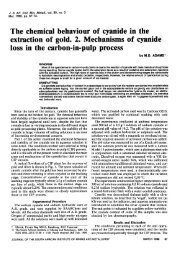
In addition, <strong>the</strong> Hotell<strong>in</strong>g T2 chart based on orig<strong>in</strong>al raw data<br />
sets was also constructed to see <strong>the</strong> performance <strong>of</strong> <strong>the</strong> two<br />
<strong>charts</strong> (Figure 12). It was found that <strong>the</strong> two <strong>charts</strong> have <strong>the</strong><br />
same upper <strong>control</strong> limit because <strong>the</strong> computation <strong>of</strong> <strong>the</strong><br />
upper <strong>control</strong> limit <strong>of</strong> Hotell<strong>in</strong>g T2 <strong>control</strong> chart does not<br />
depend on <strong>the</strong> data values; and it is a function <strong>of</strong> (i) number<br />
<strong>of</strong> subgroups, (ii) subgroup size, (iii) number <strong>of</strong> quality<br />
characteristics, and (iv) specified type I error. The essential<br />
difference <strong>in</strong> <strong>the</strong> above two multivariate <strong>charts</strong> is that <strong>the</strong> T2<br />
values differ <strong>in</strong> <strong>the</strong> two methods. Figure 11 shows that no<br />
sample goes beyond <strong>the</strong> <strong>control</strong> limits; whereas, Figure 12<br />
reveals that fifteen samples are out <strong>of</strong> <strong>control</strong>. Therefore, <strong>the</strong><br />
effect <strong>of</strong> serial correlation <strong>of</strong> <strong>the</strong> observations was also<br />
reflected <strong>in</strong> <strong>the</strong> Hotell<strong>in</strong>g T2 chart.<br />
statistical <strong>control</strong>, it is not possible to meet <strong>the</strong> specification<br />
limit <strong>of</strong> SiO 2 % on a regular basis. Therefore, <strong>the</strong> specification<br />
limit <strong>of</strong> SiO 2 % may be reviewed. O<strong>the</strong>rwise, some o<strong>the</strong>r<br />
means may be explored to reduce <strong>the</strong> average value <strong>of</strong><br />
SiO 2 %.<br />
In order to get an <strong>in</strong>sight about <strong>the</strong> outcome <strong>of</strong> this<br />
<strong>in</strong>vestigation, a detailed discussion was made with <strong>the</strong><br />
quality <strong>control</strong> personnel <strong>of</strong> <strong>the</strong> m<strong>in</strong>e. The discussion<br />
revealed that an exhaustive exploration work was carried out<br />
at <strong>the</strong> m<strong>in</strong>e based on which grade estimation <strong>of</strong> <strong>the</strong> blocks<br />
was performed. As a result, a reliable estimate <strong>of</strong> grade was<br />
obta<strong>in</strong>ed which was supported by regular blast hole sampl<strong>in</strong>g<br />
<strong>of</strong> <strong>the</strong> production blocks. Based on this <strong>in</strong>formation, <strong>the</strong> m<strong>in</strong>e<br />
management developed an extraction schedule along with a<br />
grade <strong>control</strong> plan to meet <strong>the</strong> quality requirement. In<br />
addition, blend<strong>in</strong>g was performed at <strong>the</strong> stockpile on a<br />
regular basis for reduc<strong>in</strong>g <strong>the</strong> variability <strong>of</strong> ore. All <strong>the</strong>se<br />
factors led to systematic behaviour <strong>of</strong> ore grade fluctuation<br />
which was <strong>in</strong>dicated <strong>in</strong> <strong>the</strong> <strong>control</strong> <strong>charts</strong>.<br />
Conclusions<br />
The <strong>construction</strong> <strong>of</strong> conventional quality <strong>control</strong> <strong>charts</strong> is<br />
based on <strong>the</strong> assumption <strong>of</strong> existence <strong>of</strong> normality and<br />
<strong>in</strong>dependence <strong>of</strong> data. However, common features <strong>of</strong> ore<br />
quality data are serial correlation and nonnormal distribution.<br />
To address <strong>the</strong>se <strong>issues</strong>, a guidel<strong>in</strong>e is suggested <strong>in</strong><br />
this paper for evaluat<strong>in</strong>g various <strong>control</strong> <strong>charts</strong> for m<strong>in</strong>especific<br />
situation. The case study clearly revealed that <strong>the</strong><br />
application <strong>of</strong> conventional Shewhart <strong>charts</strong> <strong>in</strong> <strong>the</strong> bauxite<br />
m<strong>in</strong>e will result <strong>in</strong> false alarms lead<strong>in</strong>g to unjustified<br />
searches for assignable causes. As <strong>the</strong> quality data sets are<br />
Figure 11—Modified multivariate T2 chart <strong>of</strong> SiO 2 % and Al 2 O 3 % for <strong>the</strong><br />
sample m<strong>in</strong>e<br />
Discussion<br />
The study clearly revealed that no sample was detected to be<br />
out <strong>of</strong> <strong>control</strong> by <strong>the</strong> appropriate use <strong>of</strong> univariate or<br />
multivariate <strong>control</strong> chart. It was also revealed that <strong>the</strong><br />
quality specification <strong>of</strong> Al 2 O 3 % is met as <strong>the</strong> variation <strong>of</strong><br />
Al 2 O 3 % is well with<strong>in</strong> <strong>the</strong> specification limits. On <strong>the</strong> o<strong>the</strong>r<br />
hand, it is difficult to meet <strong>the</strong> quality specification <strong>of</strong> SiO 2 %<br />
as <strong>the</strong> grand mean is very close to <strong>the</strong> specification limit. In<br />
this case, even though <strong>the</strong> quality characteristic is <strong>in</strong><br />
Figure 12—Multivariate <strong>control</strong> chart <strong>of</strong> SiO 2 % and Al 2 O 3 % for <strong>the</strong><br />
sample m<strong>in</strong>e<br />
The Journal <strong>of</strong> The South African Institute <strong>of</strong> M<strong>in</strong><strong>in</strong>g and Metallurgy APRIL 2002<br />
179<br />
▲