Summer 2011, Volume 57, Number 3 - San Diego History Center
Summer 2011, Volume 57, Number 3 - San Diego History Center
Summer 2011, Volume 57, Number 3 - San Diego History Center

Create successful ePaper yourself
Turn your PDF publications into a flip-book with our unique Google optimized e-Paper software.
Table 1. Largest Floods of the 20th Century<br />
on the <strong>San</strong> <strong>Diego</strong> River [a]<br />
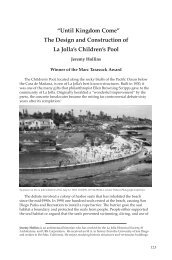
The Day the <strong>San</strong> <strong>Diego</strong> River Was Saved<br />
Table 1. Largest <strong>San</strong> <strong>Diego</strong> River Floods of the Twentieth Century [a]<br />
Rain<br />
Rain Month Maximum Rain year year<br />
Rank Year [b] of Flood cfs [c] precipit'n rank<br />
1 1915-16 January 70,200 12.55 24<br />
2 1926-27 February 45,400 14.74 15<br />
3 1921-22 December 16,700 18.65 3<br />
4 1936-37 February 14,200 15.93 9<br />
5 1917-18 March 12,000 8.04 [d]<br />
6 1982-83 March 9,590 18.26 5<br />
7 1940-41 April 9,250 24.74 1<br />
8 1931-32 February 7,400 13.18 20<br />
9 1937-38 March 7,350 9.72 [d]<br />
10 1994-95 March 6,010 17.12 8 [e]<br />
11 1997-98 February 5,450 17.78 7<br />
12 1925-26 April 4,540 15.66 11<br />
13 1951-52 January 4,390 18.16 6<br />
14 1914-15 February 3,960 14.41 17<br />
15 1990-91 March 3,640 11.79 25<br />
16 1992-93 January 3,460 18.31 4<br />
17 1979-80 February 3,420 [f] 15.72 10<br />
18 1966-67 December 3,400 10.63 ave.<br />
19 1977-78 January 3,010 [f] 18.71 2<br />
20 1981-82 March 2,900 11.50 27<br />
[a] Actual years covered by available data are 1914 to 2001.<br />
[b] In California annual rainfall is measured from July 1 to the following June 30.<br />
[c] Cfs = cubic feet per second (at maximum flood flow).<br />
[d] Annual precipitation for this year was below the mean.<br />
[e] Note that 8 of the 10 largest floods occurred prior to 1942. This can be<br />
attributed mainly to the absence of dams on the river at that time.<br />
[f] The peak run-off data for Jan. 1978 and Feb. 1980 may be understated. It<br />
seems questionable that the peak flow of 1983 was three times that of 1978<br />
or 1980. Water was so high in 1980 that Mission Valley was evacuated.<br />
No such emergency was declared in 1983. Also, there was no<br />
recording gage in Mission Valley in 1978 and 1980.<br />
Sources: U.S. Geological Survey; U.S. Weather Bureau<br />
1<strong>57</strong>

![[PDF] The Journal of San Diego History Vol 52: Nos 1 & 2](https://img.yumpu.com/25984149/1/172x260/pdf-the-journal-of-san-diego-history-vol-52-nos-1-2.jpg?quality=85)

![[PDF] The Journal of San Diego History - San Diego History Center](https://img.yumpu.com/25984131/1/172x260/pdf-the-journal-of-san-diego-history-san-diego-history-center.jpg?quality=85)