Schweizer Archiv für Neurologie und Psychiatrie ... - Sanp.ch
Schweizer Archiv für Neurologie und Psychiatrie ... - Sanp.ch
Schweizer Archiv für Neurologie und Psychiatrie ... - Sanp.ch

Create successful ePaper yourself
Turn your PDF publications into a flip-book with our unique Google optimized e-Paper software.
Posters SSNR<br />
to applicability for longitudinal studies of the pattern and<br />
involvement of fat infiltration in OPMD patients.<br />
Methods: Imaging on 8 OPMD patients 5 healthy volunteers<br />
was performed on a 1.5 T MR scanner. Two axial slice groups<br />
were <strong>ch</strong>osen at predefined distances from the knee joint, one<br />
in the thigh and one in the calf. The protocol consisted of a T1-<br />
weighted turbo spin e<strong>ch</strong>o sequence for anatomical reference<br />
(fig. 1), two gradient e<strong>ch</strong>o sequences for 2-point Dixon<br />
imaging [2], a multi-contrast TSE sequence for quantification<br />
of transverse relaxation times T2, and a steady-state free<br />
precession (SSFP) sequence for histogram analyses (total<br />
acquisition time 20:44 min). Regions of interest (ROI) were<br />
drawn in 11 thigh and 10 calf muscles (fig. 1).<br />
Results: Mean fat infiltration in the whole thigh and calf (fig. 2a)<br />
of all patients significantly differed from values of the healthy<br />
controls according to all methods except for the thigh muscles<br />
of patient 7. All te<strong>ch</strong>niques suggest that patients 2 and 4 are<br />
most affected by fat infiltration. Figure 2b exemplary illustrates<br />
the quantification of fat infiltration in the individual thigh muscles<br />
based on T2 values. The T2 values enabled a differentiation<br />
between patients and controls in 74%, the 2-point Dixon method<br />
in 58% and the SSFP method in 52% of the 168 examined<br />
patient muscles. Furthermore, a strong linear correlation is<br />
observed between the three quantitative methods<br />
(0.78 < R 2 < 0.94).<br />
Conclusions: This work demonstrates that non-invasive<br />
quantification of fat infiltration in OPMD patients can be<br />
performed with different MR imaging methods. The mean fat<br />
fractions across all muscles can provide an impression of muscle<br />
degeneration. A detailed pattern of individual muscle involvement<br />
may help on the <strong>und</strong>erstanding of the disease and serve as a<br />
baseline for longitudinal studies. For an optimal assessment<br />
of therapy effectiveness, objective measures of muscle tissue<br />
integrity, su<strong>ch</strong> as multie<strong>ch</strong>o Dixon te<strong>ch</strong>niques and quantitative<br />
T2 determination, are indispensable.<br />
References: 1 Brais B, et al. Nat Genet. 1998;18:164–7. 2 Dixon<br />
WT. Radiology. 1984;153(1):189–94.<br />
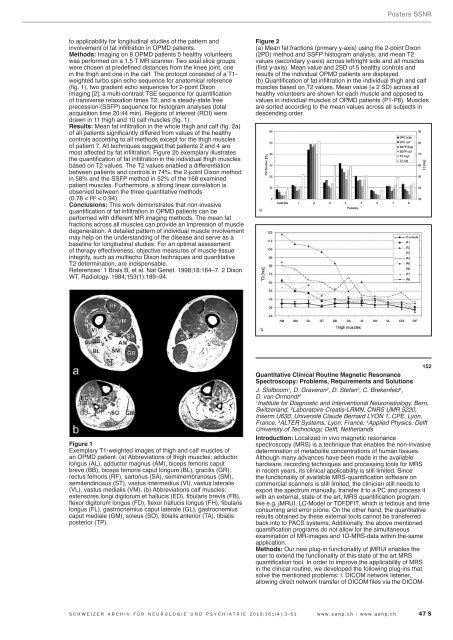
Figure 2<br />
(a) Mean fat fractions (primary y-axis) using the 2-point Dixon<br />
(2PD) method and SSFP histogram analysis, and mean T2<br />
values (secondary y-axis) across left/right side and all muscles<br />
(first y-axis). Mean value and 2SD of 5 healthy controls and<br />
results of the individual OPMD patients are displayed.<br />
(b) Quantification of fat infiltration in the individual thigh and calf<br />
muscles based on T2 values. Mean value (± 2 SD) across all<br />
healthy volunteers are shown for ea<strong>ch</strong> muscle and opposed to<br />
values in individual muscles of OPMD patients (P1-P8). Muscles<br />
are sorted according to the mean values across all subjects in<br />
descending order.<br />
a<br />
b<br />
Figure 1<br />
Exemplary T1-weighted images of thigh and calf muscles of<br />
an OPMD patient. (a) Abbreviations of thigh muscles: adductor<br />
longus (AL), adductor magnus (AM), biceps femoris caput<br />
breve (BB), biceps femoris caput longum (BL), gracilis (GR),<br />
rectus femoris (RF), sartorius (SA), semimembranosus (SM),<br />
semitendinosus (ST), vastus intermedius (VI), vastus lateralis<br />
(VL), vastus medialis (VM). (b) Abbreviations calf muscles:<br />
extensores longi digitorum et hallucis (ED), fibularis brevis (FB),<br />
flexor digitorum longus (FD), flexor hallucis longus (FH), fibularis<br />
longus (FL), gastrocnemius caput laterale (GL), gastrocnemius<br />
caput mediale (GM), soleus (SO), tibialis anterior (TA), tibialis<br />
posterior (TP).<br />
152<br />
Quantitative Clinical Routine Magnetic Resonance<br />
Spectroscopy: Problems, Requirements and Solutions<br />
J. Slotboom 1 , D. Graveron 2 , D. Stefan 3 , C. Brekenfeld 1 ,<br />
D. van Ormondt 4<br />
1<br />
Institute for Diagnostic and Interventional Neuroradiology, Bern,<br />
Switzerland, 2 Laboratoire Creatis-LRMN, CNRS UMR 5220,<br />
Inserm U630, Université Claude Bernard LYON 1, CPE, Lyon,<br />
France, 3 ALTER Systems, Lyon, France, 4 Applied Physics, Delft<br />
University of Te<strong>ch</strong>nology, Delft, Netherlands<br />
Introduction: Localized in vivo magnetic resonance<br />
spectroscopy (MRS) is a te<strong>ch</strong>nique that enables the non-invasive<br />
determination of metabolite concentrations of human tissues.<br />
Although many advances have been made in the available<br />
hardware, recording te<strong>ch</strong>niques and processing tools for MRS<br />
in recent years, its clinical applicability is still limited. Since<br />
the functionality of available MRS-quantification software on<br />
commercial scanners is still limited, the clinician still needs to<br />
export the spectrum manually, transfer it to a PC and process it<br />
with an external, state of the art, MRS quantification program,<br />
like e.g. jMRUI, LC-Model or TDFDFIT, whi<strong>ch</strong> is tedious and time<br />
consuming and error prone. On the other hand, the quantitative<br />
results obtained by these external tools cannot be transferred<br />
back into to PACS systems. Additionally, the above mentioned<br />
quantification programs do not allow for the simultaneous<br />
examination of MR-images and 1D-MRS-data within the-same<br />
application.<br />
Methods: Our new plug-in functionality of jMRUI enables the<br />
user to extend the functionality of this state of the art MRS<br />
quantification tool. In order to improve the applicability of MRS<br />
in the clinical routine, we developed the following plug-ins that<br />
solve the mentioned problems: I. DICOM network listener,<br />
allowing direct network transfer of DICOM files via the DICOM-<br />
SCHWEIZER ARCHIV FÜR NEUROLOGIE UND PSYCHIATRIE 2010;161(4):3–51 www.sanp.<strong>ch</strong> | www.asnp.<strong>ch</strong> 47 S