Global Tuberculosis Report -- 2012.pdf
Global Tuberculosis Report -- 2012.pdf
Global Tuberculosis Report -- 2012.pdf

You also want an ePaper? Increase the reach of your titles
YUMPU automatically turns print PDFs into web optimized ePapers that Google loves.
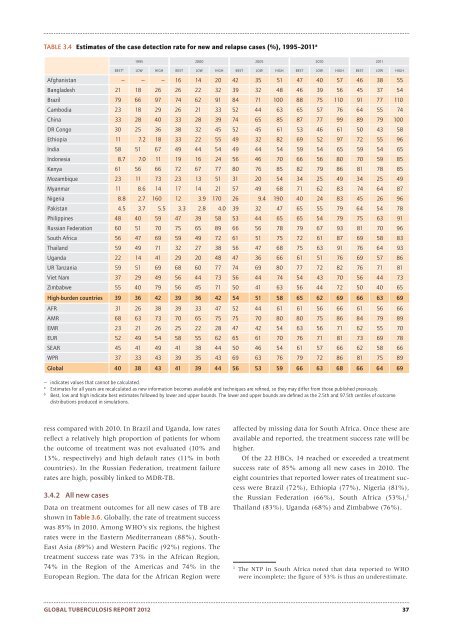
TABLE 3.4 Estimates of the case detection rate for new and relapse cases (%), 1995–2011 a<br />
1995 2000 2005 2010 2011<br />
BEST b LOW HIGH BEST LOW HIGH BEST LOW HIGH BEST LOW HIGH BEST LOW HIGH<br />
Afghanistan — — — 16 14 20 42 35 51 47 40 57 46 38 55<br />
Bangladesh 21 18 26 26 22 32 39 32 48 46 39 56 45 37 54<br />
Brazil 79 66 97 74 62 91 84 71 100 88 75 110 91 77 110<br />
Cambodia 23 18 29 26 21 33 52 44 63 65 57 76 64 55 74<br />
China 33 28 40 33 28 39 74 65 85 87 77 99 89 79 100<br />
DR Congo 30 25 36 38 32 45 52 45 61 53 46 61 50 43 58<br />
Ethiopia 11 7.2 18 33 22 55 49 32 82 69 52 97 72 55 96<br />
India 58 51 67 49 44 54 49 44 54 59 54 65 59 54 65<br />
Indonesia 8.7 7.0 11 19 16 24 56 46 70 66 56 80 70 59 85<br />
Kenya 61 56 66 72 67 77 80 76 85 82 79 86 81 78 85<br />
Mozambique 23 11 73 23 13 51 31 20 54 34 25 49 34 25 49<br />
Myanmar 11 8.6 14 17 14 21 57 49 68 71 62 83 74 64 87<br />
Nigeria 8.8 2.7 160 12 3.9 170 26 9.4 190 40 24 83 45 26 96<br />
Pakistan 4.5 3.7 5.5 3.3 2.8 4.0 39 32 47 65 55 79 64 54 78<br />
Philippines 48 40 59 47 39 58 53 44 65 65 54 79 75 63 91<br />
Russian Federation 60 51 70 75 65 89 66 56 78 79 67 93 81 70 96<br />
South Africa 56 47 69 59 49 72 61 51 75 72 61 87 69 58 83<br />
Thailand 59 49 71 32 27 38 56 47 68 75 63 91 76 64 93<br />
Uganda 22 14 41 29 20 48 47 36 66 61 51 76 69 57 86<br />
UR Tanzania 59 51 69 68 60 77 74 69 80 77 72 82 76 71 81<br />
Viet Nam 37 29 49 56 44 73 56 44 74 54 43 70 56 44 73<br />
Zimbabwe 55 40 79 56 45 71 50 41 63 56 44 72 50 40 65<br />
High-burden countries 39 36 42 39 36 42 54 51 58 65 62 69 66 63 69<br />
AFR 31 26 38 39 33 47 52 44 61 61 56 66 61 56 66<br />
AMR 68 63 73 70 65 75 75 70 80 80 75 86 84 79 89<br />
EMR 23 21 26 25 22 28 47 42 54 63 56 71 62 55 70<br />
EUR 52 49 54 58 55 62 65 61 70 76 71 81 73 69 78<br />
SEAR 45 41 49 41 38 44 50 46 54 61 57 66 62 58 66<br />
WPR 37 33 43 39 35 43 69 63 76 79 72 86 81 75 89<br />
<strong>Global</strong> 40 38 43 41 39 44 56 53 59 66 63 68 66 64 69<br />
— indicates values that cannot be calculated.<br />
a<br />
Estimates for all years are recalculated as new information becomes available and techniques are refi ned, so they may differ from those published previously.<br />
b<br />
Best, low and high indicate best estimates followed by lower and upper bounds. The lower and upper bounds are defi ned as the 2.5th and 97.5th centiles of outcome<br />
distributions produced in simulations.<br />
ress compared with 2010. In Brazil and Uganda, low rates<br />
reflect a relatively high proportion of patients for whom<br />
the outcome of treatment was not evaluated (10% and<br />
13%, respectively) and high default rates (11% in both<br />
countries). In the Russian Federation, treatment failure<br />
rates are high, possibly linked to MDR-TB.<br />
3.4.2 All new cases<br />
Data on treatment outcomes for all new cases of TB are<br />
shown in Table 3.6. <strong>Global</strong>ly, the rate of treatment success<br />
was 85% in 2010. Among WHO’s six regions, the highest<br />
rates were in the Eastern Mediterranean (88%), South-<br />
East Asia (89%) and Western Pacific (92%) regions. The<br />
treatment success rate was 73% in the African Region,<br />
74% in the Region of the Americas and 74% in the<br />
European Region. The data for the African Region were<br />
affected by missing data for South Africa. Once these are<br />
available and reported, the treatment success rate will be<br />
higher.<br />
Of the 22 HBCs, 14 reached or exceeded a treatment<br />
success rate of 85% among all new cases in 2010. The<br />
eight countries that reported lower rates of treatment success<br />
were Brazil (72%), Ethiopia (77%), Nigeria (81%),<br />
the Russian Federation (66%), South Africa (53%), 1<br />
Thailand (83%), Uganda (68%) and Zimbabwe (76%).<br />
1<br />
The NTP in South Africa noted that data reported to WHO<br />
were incomplete; the figure of 53% is thus an underestimate.<br />
GLOBAL TUBERCULOSIS REPORT 2012 37