임ìƒÂÕ™ 실ט실 Ã…ŒìŠ¤ÃŠ¸ 제 1권 시약 밠설비
임ìƒÂÕ™ 실ט실 Ã…ŒìŠ¤ÃŠ¸ 제 1권 시약 밠설비
임ìƒÂÕ™ 실ט실 Ã…ŒìŠ¤ÃŠ¸ 제 1권 시약 밠설비
Create successful ePaper yourself
Turn your PDF publications into a flip-book with our unique Google optimized e-Paper software.
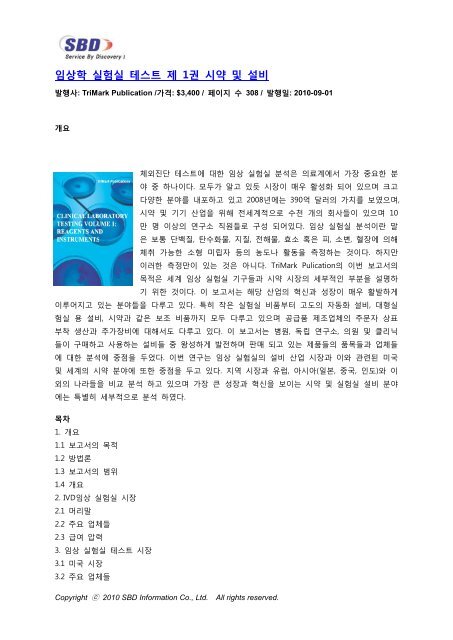
임상학 실험실 테스트 제 1권 시약 및 설비<br />
발행사: TriMark Publication /가격: $3,400 / 페이지 수 308 / 발행일: 2010-09-01<br />
개요<br />
체외진단 테스트에 대한 임상 실험실 분석은 의료계에서 가장 중요한 분<br />
야 중 하나이다. 모두가 알고 있듯 시장이 매우 활성화 되어 있으며 크고<br />
다양한 분야를 내포하고 있고 2008년에는 390억 달러의 가치를 보였으며,<br />
시약 및 기기 산업을 위해 전세계적으로 수천 개의 회사들이 있으며 10<br />
만 명 이상의 연구소 직원들로 구성 되어있다. 임상 실험실 분석이란 말<br />
은 보통 단백질, 탄수화물, 지질, 전해물, 효소 혹은 피, 소변, 혈장에 의해<br />
체취 가능한 소형 미립자 등의 농도나 활동을 측정하는 것이다. 하지만<br />
이러한 측정만이 있는 것은 아니다. TriMark Pulication의 이번 보고서의<br />
목적은 세계 임상 실험실 기구들과 시약 시장의 세부적인 부분을 설명하<br />
기 위한 것이다. 이 보고서는 해당 산업의 혁신과 성장이 매우 활발하게<br />
이루어지고 있는 분야들을 다루고 있다. 특히 작은 실험실 비품부터 고도의 자동화 설비, 대형실<br />
험실 용 설비, 시약과 같은 보조 비품까지 모두 다루고 있으며 공급품 제조업체의 주문자 상표<br />
부착 생산과 추가장비에 대해서도 다루고 있다. 이 보고서는 병원, 독립 연구소, 의원 및 클리닉<br />
들이 구매하고 사용하는 설비들 중 왕성하게 발전하며 판매 되고 있는 제품들의 품목들과 업체들<br />
에 대한 분석에 중점을 두었다. 이번 연구는 임상 실험실의 설비 산업 시장과 이와 관련된 미국<br />
및 세계의 시약 분야에 또한 중점을 두고 있다. 지역 시장과 유럽, 아시아(일본, 중국, 인도)와 이<br />
외의 나라들을 비교 분석 하고 있으며 가장 큰 성장과 혁신을 보이는 시약 및 실험실 설비 분야<br />
에는 특별히 세부적으로 분석 하였다.<br />
목차<br />
1. 개요<br />
1.1 보고서의 목적<br />
1.2 방법론<br />
1.3 보고서의 범위<br />
1.4 개요<br />
2. IVD임상 실험실 시장<br />
2.1 머리말<br />
2.2 주요 업체들<br />
2.3 급여 압력<br />
3. 임상 실험실 테스트 시장<br />
3.1 미국 시장<br />
3.2 주요 업체들<br />
Copyright c 2010 SBD Information Co., Ltd. All rights reserved.
3.3 수익 및 급여<br />
4. 임상 실험실 테스트 시장의 인기 분야<br />
5. 중요 테크놀로지 트랜드<br />
6. 임상 실험실 분석 분야의 비즈니스 트랜드<br />
6.1 주요 발전<br />
6.2 구도 개편<br />
6.3 취득 가격<br />
7. 기업 프로필<br />
7.1 ACM Medical Laboratory<br />
7.2 American Esoteric Laboratories (Sonic Healthcare)<br />
7.3 American Pathology Partners<br />
7.4 AmeriPath (Quest)<br />
7.5 ARUP Laboratories<br />
7.6 Athena Diagnostics<br />
7.7 Aurora Diagnostics<br />
8. 임상 실험실 테스트 분야 동향 및 전망<br />
Copyright c 2010 SBD Information Co., Ltd. All rights reserved.
Clinical Laboratory Testing Volume 1: Reagents and Instruments<br />
Publisher: TriMark Publication/ Price: $3,400/ Pages: 308 / Date: 2010-09-01<br />
Clinical laboratory analysis for in vitro diagnostic (IVD) testing is one of the<br />
most important sectors of medical care. By all accounts, it is very mature,<br />
large and diverse--crossing the $39 billion mark in 2008--and employing<br />
over 100,000 laboratory workers, and spawning an industry for reagents<br />
and instruments comprised of thousands of companies worldwide. The term<br />
clinical laboratory analysis usually refers to determining the concentration or<br />
activity of a protein, carbohydrate, lipid, electrolyte, enzyme or small<br />
molecule in easily collected body fluids such as blood, serum, plasma or<br />
urine. However, it is not necessarily limited to these determinations. The<br />
purpose of this TriMark Publications report is to describe the specific<br />
segments of the global clinical laboratory instrumentation and reagent<br />
market. Within this area, the report covers those segments that are highly<br />
active in terms of innovation and growth. Specifically, this global clinical<br />
laboratory markets report examines the markets for small lab equipment all the way up to highlyautomated,<br />
large lab platforms, as well as accessory equipment such as reagents, supplies and<br />
manufacturers’ original equipment manufacturer (OEM) additional equipment. The emphasis in this<br />
analysis is on those companies and products that are actively developing and marketing laboratory<br />
analyzer products for the clinical setting, including hospitals, independent labs, physician’s offices and<br />
miscellaneous clinics. This study concentrates on the clinical laboratory instrumentation industry<br />
market segment and the companion reagents sector in the U.S. and around the world. The regional<br />
markets and their differences are examined, including Europe, Asia (Japan, China and India) and the<br />
rest of the world (ROW). Particular attention is paid to those areas of the clinical laboratory<br />
instrumentation and reagents sector that are showing the greatest growth or the most innovation.<br />
1. Overview<br />
1.1 Objectives of the Report<br />
1.2 Methodology<br />
1.3 Scope of the Report<br />
1.4 Executive Summary<br />
2. IVD Clinical Laboratory Market<br />
2.1 Introduction<br />
2.2 Key Players for Independent Clinical Labs<br />
2.3 Reimbursement Pressure<br />
2.4 Medicare Part B Spending Trends<br />
2.5 Cost of Billing and Average Receipts for Commercial Labs<br />
2.6 Hospital Outreach Programs<br />
2.7 Criteria for Selection of Lab Services<br />
3. The Clinical Laboratory Testing Market<br />
3.1 U.S. Market<br />
3.1.1 Hospital-based Clinical Laboratories<br />
3.1.2 Commercial Clinical Laboratory Testing<br />
3.1.3 Physician Office Laboratories (POLs)<br />
3.2 Clinical Lab Testing Key Players<br />
3.2.1 Commercial Clinical Labs<br />
3.2.2 Hospital Lab Collaborative Ventures<br />
3.2.3 Specialty Labs<br />
3.3 Revenue and Reimbursement<br />
3.4 Outlook for Clinical Laboratory Testing<br />
3.4.1 Long-Term Changes<br />
3.4.2 Market Drivers<br />
Copyright c 2010 SBD Information Co., Ltd. All rights reserved.
3.4.3 The Limits to Growth<br />
3.4.4 Key Technologies<br />
3.4.5 Conclusion<br />
4. Hot Sectors in the Clinical Lab Testing Market<br />
4.1 Workplace Drugs-of-Abuse Testing<br />
4.2 Clinical Toxicology<br />
4.3 Clinical Testing for the Pharmaceutical Industry<br />
4.4 Heavy Metal, Trace Element, and Solvent Analyses<br />
4.5 Diabetes (Glucose) Testing<br />
4.6 Molecular Diagnostic Testing<br />
4.7 Cardiac Markers<br />
4.8 Blood Bank Screening<br />
4.9 Genetic Testing<br />
4.10 Predictive Medicine Testing<br />
4.11 Personalized Medicine<br />
4.12 Cancer Testing<br />
4.13 Cell Based Cancer Testing<br />
4.14 Monitoring Technologies<br />
4.15 Anatomic Pathology<br />
5. Important Technology Trends<br />
5.1 Technology Platform Innovations in Point-of-Care Testing<br />
5.2 The New Paradigm<br />
5.3 Consolidated Workstations<br />
5.4 Automation in the Laboratory<br />
5.5 Laboratory Information Systems<br />
5.6 New User-friendly Interface<br />
5.7 Data-Management Issues<br />
5.7.1 Wireless LANs<br />
5.7.2 Data and Workflow Management Systems<br />
5.7.3 Beckman Central Command<br />
5.7.4 Clinical IT More Widely Available in Physician Practices<br />
5.7.5 Physician Electronic Health Records (EHRs)<br />
5.7.6 Specimen Tracking and Processing<br />
6. Business Trends in the Clinical Laboratory Analyzer Sector<br />
6.1 Key Developments<br />
6.2 Sector Consolidation<br />
6.3 Acquisition Pricing<br />
6.4 A Closer Look at Recent Lab Deals<br />
6.5 Acquisition, License Agreements, Internal Development and Partnerships<br />
6.6 Merger, Acquisition, Financing and Partnering Activities in the Clinical Lab Industry<br />
6.7 Comparison of Quest and LabCorp<br />
6.7.1 Acquisitions<br />
6.7.2 Quest’s Growth, 2000-2006<br />
6.7.3 Laboratory Corporation of America<br />
6.7.4 LabCorp’s Growth, 2000-2006<br />
6.7.5 Competitive Advantages at Quest and LabCorp<br />
6.7.6 National Managed Care Contracts<br />
6.7.7 Billing and Collection Management<br />
6.7.8 Lower Reagent and Supply Costs<br />
6.7.9 Esoteric Testing Capabilities<br />
6.7.10 Ability to Invest in Web-Based Connectivity Solutions<br />
6.7.11 Competitive Disadvantages of Quest and LabCorp<br />
6.7.12 Difficulties with Turnaround Times and Stat Services<br />
6.7.13 Physician-Laboratory Communication<br />
6.7.14 Specimen Pickup Scheduling Inflexibility<br />
6.8 Regulation of Clinical Laboratory Operations<br />
6.8.1 CLIA and State Regulations<br />
6.8.2 Drug Testing<br />
6.8.3 Controlled Substances<br />
Copyright c 2010 SBD Information Co., Ltd. All rights reserved.
6.8.4 Medical Waste, Hazardous Waste and Radioactive Materials<br />
6.8.5 FDA<br />
6.8.6 Occupational Safety<br />
6.8.7 Specimen Transportation<br />
6.8.8 Corporate Practice of Medicine<br />
6.9 Hospital Outreach Programs<br />
6.10 Supply Chain and GPO Contracting<br />
6.11 Specialty Labs<br />
6.12 Expansion of Hospital-Based Labs and Hospital Outreach Programs<br />
6.13 Managed Care<br />
7. Company Profiles<br />
7.1 ACM Medical Laboratory<br />
7.2 American Esoteric Laboratories (Sonic Healthcare)<br />
7.3 American Pathology Partners<br />
7.4 AmeriPath (Quest)<br />
7.5 ARUP Laboratories<br />
7.6 Athena Diagnostics<br />
7.7 Aurora Diagnostics<br />
7.8 Bio-Reference Laboratories, Inc.<br />
7.9 BioTech Labs<br />
7.10 CBLPath<br />
7.11 Centrex Clinical Laboratories<br />
7.12 Clarient, Inc.<br />
7.13 Clinical Laboratories of Hawaii (Sonic Healthcare)<br />
7.14 Clinical Reference Laboratory<br />
7.15 Clongen Laboratories<br />
7.16 CompuNet Clinical Laboratories<br />
7.17 Diagnostic Systems Laboratories<br />
7.18 Enzo Biochem, Inc.<br />
7.19 Esoterix<br />
7.20 Focus Diagnostics<br />
7.21 Fresenius Medical Care AG & Co. KGaA<br />
7.22 Geneva Laboratories<br />
7.23 Genomic Health, Inc.<br />
7.24 Genzyme<br />
7.25 IBT Laboratories<br />
7.26 Integrated Regional Laboratories (IRL)<br />
7.27 LabCorp<br />
7.28 MDS Diagnostic Services<br />
7.29 MEDTOX Scientific, Inc.<br />
7.30 Meriter Health Services<br />
7.31 Mid America Clinical Laboratories (MACL)<br />
7.32 Monogram Biosciences, Inc.<br />
7.33 Myriad Genetics, Inc.<br />
7.34 National Jewish Medical and Research Center<br />
7.35 Parkway Clinical Laboratories<br />
7.36 Pathology Associates Medical Laboratories (PAML)<br />
7.37 Psychemedics Corporation<br />
7.38 Quest Diagnostics Incorporated<br />
7.39 RDL Reference Laboratory<br />
7.40 Satellite Laboratory Services<br />
7.41 Spectrum Laboratory Network<br />
7.42 Sonic Healthcare<br />
8. Clinical Laboratory Testing Sector Trends and Forecasts<br />
8.1 Home Care Analysis<br />
8.2 Non-Traditional Collection for Laboratory Testing<br />
8.3 New Systems for Critical-Care and Near-Patient Testing<br />
8.4 Shift to Preventative Medicine<br />
8.5 Mergers of Diagnostic Companies<br />
Copyright c 2010 SBD Information Co., Ltd. All rights reserved.
8.6 Information Management Advances<br />
8.7 Test Ordering Patterns<br />
8.8 Patient Satisfaction<br />
8.9 Move Away from Central Laboratory<br />
8.10 Healthcare Cost Controls<br />
8.11 Competition for Services<br />
8.12 Drivers and Barriers of Clinical Laboratory Testing<br />
8.13 Confluence of New Technology<br />
8.14 New Trends in Clinical Laboratory Testing<br />
8.14.1 Trends in Reimbursement Practices<br />
8.14.2 Managed Care<br />
8.14.3 Point of Care Testing<br />
8.14.4 Satellite Facilities<br />
LIST OF FIGURES<br />
Figure 2.1: Total Medicare Expenditures, 1995-2008<br />
Figure 2.2: Effect of Medicare Laboratory Fee Schedule Changes on a $10 Test,<br />
1984-2006<br />
Figure 2.3: Part B Spending on Clinical Laboratory Services, 1991-2007<br />
Figure 2.4: Cost Per Billable Test<br />
Figure 2.5: Annual Billable Tests Processed Per FTE<br />
Figure 2.6: Outreach Business Operated at a Freestanding Lab Facility<br />
Figure 2.7: Volume of Dedicated Sales and Marketing Staff for Outreach Business<br />
Figure 2.8: Separately Managed Outreach Billing and Collection<br />
Figure 3.1: Lab Revenue by Lab Type<br />
Figure 3.2: Lab Revenue by Test Type<br />
Figure 3.3: Physician Office Laboratory Revenue, 2000-2006<br />
Figure 3.4: Unweighted Average Medicare Reimbursement for the 10 Most Common POL<br />
Tests<br />
Figure 3.5: Total Number of Non-Waived POLs, 2000-2006<br />
Figure 3.6: Number of New Tests Granted CLIA-Waived Status, 2000-2008<br />
Figure 3.7: High-Volume Waived Tests<br />
Figure 4.1: U.S. Molecular Diagnostics Market Average Reimbursement Rate, 2009<br />
Figure 4.2: Laboratory Service Revenue from Pap Testing, 1998-2005<br />
Figure 4.3: Percentage of Pap Tests Performed Using Mono-Layer Methods, 1998-2006<br />
Figure 4.4: Market Share for Pap Test Vendors, 2006<br />
Figure 5.1: Percentage of Physicians in Practices with IT for Specific Clinical Activities<br />
Figure 6.1: Average Revenue Multiple Paid to Acquire Labs, 2000-2006<br />
Figure 6.2: Value of Laboratory Mergers, Acquisitions, and IPO’s 2004-2008<br />
Figure 6.3: Hospital Market Share for Outreach Programs<br />
LIST OF TABLES<br />
Table 2.1: Medicare Spending on Clinical Lab Services, 1991-2007<br />
Table 2.2: Allowed Charges for Top 25 Clinical Laboratory Procedures, 2009<br />
Table 2.3: Washington G-2 Hospital Lab Outreach Survey<br />
Table 3.1: U.S. Clinical Laboratory Testing Market Revenue, 2005-2012<br />
Table 3.2: U.S. Clinical Laboratory Diagnostic Test Market Segments, 2008<br />
Table 3.3: Growth Rates of Test Types<br />
Table 3.4: Independent Commercial Laboratory Testing Test Volume, 2005-2012<br />
Table 3.5: Twenty Most Common Laboratory Tests Offered at Family Physician Offices<br />
Table 3.6: Important New Waived Tests<br />
Table 3.7: Revenue and at Leading Publicly-Traded Lab Companies, 2008<br />
Table 3.8: Payer Group wise Percentage of Total Volume of Requisitions and Net Revenues<br />
Table 4.1: Pap Testing at the Largest U.S. Laboratory Companies, 2006<br />
Table 5.1: Applications for Wireless LAN Technology<br />
Table 6.1: Laboratory/Pathology Acquisitions<br />
Table 6.2: Revenue Growth at Quest Diagnostics, 2000-2008<br />
Table 6.3: Revenue Growth at LabCorp, 2000-2008<br />
Table 6.4: LabCorp Revenue from Managed Care Contracts, 2004-2006<br />
Table 6.5: Quest Diagnostics Revenue from Managed Care Contracts, 2004-2006<br />
Table 7.1: Recent Acquisitions by Sonic Healthcare<br />
Copyright c 2010 SBD Information Co., Ltd. All rights reserved.
Table 8.1: Medicare Billing Guidelines for Multi-channel Laboratory Tests<br />
Table 8.2: U.S. POCT Market, 2000-2012<br />
Table 8.3: U.S. POCT by Performance Location, 2008<br />
Table 8.4: Targeted Lab Tests and Brief Educational Reminder Messages<br />
TABLE OF CONTENTS<br />
1. Overview 8<br />
1.1 Objectives of the Report 8<br />
1.2 Methodology 9<br />
1.3 Scope of the Report 10<br />
1.4 Executive Summary 11<br />
2. IVD Clinical Laboratory Market 16<br />
2.1 Introduction 16<br />
2.2 Independent Clinical Labs 18<br />
2.2.1 Key Players for Independent Clinical Labs 19<br />
2.2.2 Quest Diagnostics and LabCorp 19<br />
2.2.3 Competitive Advantages at Quest and LabCorp 22<br />
2.2.4 Competitive Disadvantages of Quest and LabCorp 24<br />
2.2.5 Revenue Growth of Quest and LabCorp 24<br />
2.2.6 Sector Consolidation 25<br />
2.2.7 Additional Independent Clinical Laboratories 26<br />
2.3 Hospital Market 27<br />
2.3.1 Hospital Market Overview 27<br />
2.3.2 Hospital Lab Testing Drivers 27<br />
2.3.3 Evaluation Models of Laboratory Testing 28<br />
2.3.4 GPOs and IDNs 29<br />
2.3.5 Distributors 29<br />
Copyright c 2010 SBD Information Co., Ltd. All rights reserved.
2.3.6 Clinical Lab Testing Suppliers 30<br />
2.3.7 European Hospital Purchasing Practices 30<br />
2.3.8 Changes in Hospital Funding 31<br />
2.3.9 European Group Purchasing 31<br />
2.4 POL Market 32<br />
2.5 IVD Industry 33<br />
2.5.1 Industry Overview 33<br />
2.5.2 IVD Industry Leading Players Comparison and Review 34<br />
2.5.3 Biotechnology Reagents and Supplies 48<br />
2.5.3.1 Vendor Quality Assurance 49<br />
2.5.3.2 Partnership Support 50<br />
2.5.3.3 Protecting Supply of Raw Materials 51<br />
2.5.3.4 Selecting a Second Source for Chemicals 52<br />
2.5.3.5 Cost Analysis for Reagent Manufacture 52<br />
2.5.3.6 Outsourcing Production of Reagents 53<br />
2.5.4 The Fastest Growing IVD Reagent Markets 53<br />
2.5.5 Automated Instrumentation 53<br />
2.5.6 High Growth Applications Spur Industry Growth 54<br />
2.6 Automated Instrument Platforms Evolution 54<br />
2.7 Reagents and Supplies Market for Clinical Lab Instruments 54<br />
2.8 Spending for Clinical Laboratory Testing 54<br />
2.8.1 Reimbursement Pressure 55<br />
2.8.2 Medicare Part B Spending Trends 57<br />
2.8.3 Strategies for Revenue Growth 58<br />
3. IVD Clinical Laboratory Market 59<br />
3.1 Markets 59<br />
3.1.1 Global Markets 59<br />
3.1.2 Global Drivers of Clinical Laboratory Testing 61<br />
Copyright c 2010 SBD Information Co., Ltd. All rights reserved.
3.1.3 Global Outlook 62<br />
3.1.4 U.S. Market 63<br />
3.1.5 European IVD Market 66<br />
3.1.5.1 German Clinical Laboratory Diagnostic Markets 76<br />
3.1.5.2 U.K. Clinical Laboratory Testing Diagnostic Market 77<br />
3.1.5.2.1 U.K. Competitive Analysis 78<br />
3.1.5.2.2 U.K. Market Access 79<br />
3.1.5.3 French Clinical Laboratory Diagnostic Testing Market 80<br />
3.1.5.4 Italian Clinical Laboratory Diagnostic Market 81<br />
3.1.5.5 Spanish Clinical Laboratory Diagnostic Market 82<br />
3.1.5.6 Finnish Clinical Laboratory Market 83<br />
3.1.5.7 Turkish Clinical Laboratory Market 84<br />
3.1.5.8 Belgium Clinical Laboratory Diagnostic Market 84<br />
3.1.5.9 Swiss Clinical Laboratory Diagnostic Market 85<br />
3.1.5.10 Dutch Clinical Laboratory Diagnostic Market 86<br />
3.1.5.11 Portuguese Clinical Laboratory Diagnostic Market 87<br />
3.1.5.12 Austrian Clinical Laboratory Diagnostic Market 88<br />
3.1.5.13 Greek Clinical Laboratory Diagnostic Market 89<br />
3.1.5.14 Polish Clinical Laboratory Diagnostic Market 90<br />
3.1.5.15 Romanian Clinical Laboratory Diagnostic Market 91<br />
3.1.5.16 Czech Republic Clinical Laboratory Diagnostic Market 92<br />
3.1.5.17 Swedish Clinical Laboratory Diagnostic Market 93<br />
3.1.5.18 Norwegian Clinical Laboratory Diagnostic Market 93<br />
3.1.5.19 Irish Clinical Laboratory Diagnostic Market 94<br />
3.1.5.20 Hungarian Clinical Laboratory Diagnostic Market 94<br />
3.1.5.21 Bulgarian Clinical Laboratory Diagnostic Market 95<br />
3.1.5.22 Slovakian Clinical Laboratory Diagnostic Market 95<br />
3.1.5.23 Lithuanian Clinical Laboratory Diagnostic Market 96<br />
3.1.5.24 Latvian Clinical Laboratory Diagnostic Market 96<br />
3.1.5.25 Estonian Clinical Laboratory Diagnostic Market 97<br />
Copyright c 2010 SBD Information Co., Ltd. All rights reserved.
3.1.5.26 Slovenian Clinical Laboratory Diagnostic Market 97<br />
3.1.6 Asian Markets 98<br />
3.1.6.1 Indian Clinical Laboratory Diagnostic Market 98<br />
3.1.6.1.1 Indian IVD Testing Industry 98<br />
3.1.6.2 Japanese Clinical Laboratory Testing Market 103<br />
3.1.6.3 Chinese Clinical Laboratory Market 103<br />
3.1.7 Clinical Laboratory Smaller Country Markets 111<br />
3.1.7.1 Canadian Clinical Laboratory Market 111<br />
3.1.7.2 Brazilian Clinical Laboratory Market 112<br />
3.1.7.3 Australian Clinical Laboratory Market 112<br />
3.1.8 ROW Clinical Laboratory Testing Market 113<br />
3.1.9 Overview of Asian Healthcare Market 113<br />
3.1.9.1 Singapore 114<br />
3.1.9.2 Malaysia 115<br />
3.1.9.3 Thailand 116<br />
3.1.9.4 Indonesia 116<br />
3.1.9.5 Philippines 116<br />
3.1.9.6 South Korea 116<br />
3.1.9.7 India 117<br />
3.1.9.8 Hong Kong 117<br />
3.1.9.9 Taiwan 117<br />
3.1.10 Overview of the Latin American Diagnostics Market 118<br />
3.2 Clinical Laboratory Sector 118<br />
3.2.1 Worldwide IVD Sales 118<br />
3.2.1.1 POLs 120<br />
3.2.2 Industry Players 125<br />
3.2.2.1 Manufacturing Companies 125<br />
3.2.3 Market Specialization 126<br />
3.2.4 Revenue and Reimbursement 128<br />
Copyright c 2010 SBD Information Co., Ltd. All rights reserved.
3.2.5 Companies 129<br />
3.3 Outlook for Clinical Laboratory Testing 130<br />
3.3.1 Long-Term Changes 130<br />
3.3.2 Market Drivers 131<br />
3.3.3 The Limits to Growth 132<br />
3.3.4 Hot Sectors in the IVD Market 133<br />
3.3.5 Key Technologies 135<br />
3.3.6 Conclusion 135<br />
4. Clinical Laboratory Instrument Market by Sector 136<br />
4.1 Chemistry Analyzers 136<br />
4.1.1 Ultra-Large Throughput Laboratory Analyzers 136<br />
4.1.2 Large-Throughput Analyzers 143<br />
4.1.3 Mid-Size Clinical Laboratory Analyzers 154<br />
4.1.4 Laboratory Analyzers for the Small Volume Market 158<br />
4.2 Immunochemistry Analyzers 165<br />
4.2.1 Large Immunochemistry Analyzers 165<br />
4.2.2 Small Immunoassay Analyzers 174<br />
4.3 Hematology Analyzers 176<br />
4.4 Point of Care Testing 192<br />
4.6 Cytology Testing 196<br />
4.7 Microbiology Testing 198<br />
4.8 Serology Testing 198<br />
4.9 Esoteric Testing 198<br />
4.10 Anatomic Pathology 199<br />
4.11 Drug Testing 199<br />
5. Important Technology Trends in IVD Instrumentation and Reagents 200<br />
5.1 Technology Innovations in Instrument and Reagent Development 200<br />
5.2 Sensor Systems for Diagnostic Applications 200<br />
Copyright c 2010 SBD Information Co., Ltd. All rights reserved.
5.3 Glucose Measurements 205<br />
5.4 Glucose Test Methods 207<br />
5.5 Cholesterol Measurements 208<br />
5.6 The New Paradigm 209<br />
5.7 Consolidated Workstations 209<br />
5.8 Automation in the Laboratory 211<br />
5.9 Laboratory Information Systems 212<br />
5.10 New User-friendly Interfaces 213<br />
5.11 Biosensor Technology 214<br />
5.12 Data-Management Issues 216<br />
5.12.1 Wireless LANs 216<br />
5.12.2 Cepheid 뭩 POC GBS and BCR/ABL Tests 216<br />
5.12.3 Data and Workflow Management Systems 217<br />
5.12.4 Beckman Central Command 217<br />
6. Business Trends in the Clinical Laboratory Analyzer and Reagents Market 218<br />
6.1 Key Market Developments 218<br />
6.1.1 Decreasing Revenue from Traditional IVD Markets 218<br />
6.1.2 High Growth in POCT and Molecular Diagnostics Arena 218<br />
6.1.3 Move Away from Traditional Kit Testing Methods 219<br />
6.1.4 Integrated Analytical Systems 219<br />
6.1.5 Regulatory Changes 220<br />
6.1.6 Development of a Two-Tier Industry Structure 220<br />
6.1.7 Labor Costs 220<br />
6.1.8 Increasing Value of Companies with High-Margin Technology Platforms 220<br />
6.1.9 The Joining of IVD Testing and Computer Technology 221<br />
6.1.10 User-Friendly User Interfaces 221<br />
6.2 Sector Consolidation 222<br />
6.2.1 IVD Company Consolidation 222<br />
Copyright c 2010 SBD Information Co., Ltd. All rights reserved.
6.2.2 Lab Company Consolidation 225<br />
6.2.2.1 Acquisition Pricing 226<br />
6.2.2.2 A Closer Look at Six Big Lab Deals 226<br />
6.3 Diagnostic Testing Growth Trends 228<br />
6.4 Reagent and Hardware Business in Japan 228<br />
6.5 New Products 228<br />
6.6 Acquisition, License Agreements, Internal Development and Partnerships 229<br />
6.7 Product Testing Depth in Clinical Laboratory Testing 230<br />
6.8 Government Regulation of IVD Devices 230<br />
6.8.1 U.S. Regulation 230<br />
6.8.1.1 Importing Medical Devices into the U.S. 232<br />
6.8.1.2 Exporting Medical Devices from the U.S. 233<br />
6.8.2 U.K. Regulation 233<br />
6.8.3 E.U. Regulation 234<br />
6.8.3.1 France 236<br />
6.8.4 Japanese Regulation 237<br />
6.8.5 Korean Regulation 237<br />
6.8.6 Chinese Regulation 237<br />
6.9 Increased Market Penetration 238<br />
6.10 Costs of Doing Business in Europe 239<br />
6.11 Drivers of European Diagnostics Testing 239<br />
6.12 European Reimbursement Practices 239<br />
6.13 Cost Containment in Europe 240<br />
6.14 Hospital Outreach Programs 240<br />
6.15 Electronic Procurement: New Challenges 240<br />
6.16 Competition for Supply Chain Management Solutions 243<br />
6.17 E-Commerce in the Hospital Supply Chain 244<br />
6.17.1 Drivers of E-Commerce Solutions 244<br />
6.17.2 Barriers to E-Commerce Solutions 245<br />
6.18 Top Trends in Laboratory Business Practices 247<br />
Copyright c 2010 SBD Information Co., Ltd. All rights reserved.
6.19 The Value of the New Diagnostics 247<br />
6.20 Converging Technologies 뾆 rugs and Diagnostic Tests Combine for Improved<br />
Healthcare 248<br />
6.21 Emerging Technologies in the Downstream Manufacture of Bio-Materials 248<br />
6.22 GMP Readiness 248<br />
6.23 Harnessing Human Resource Capabilities and IT Prowess: Biotechnology in the<br />
Future 248<br />
6.24 Partnering with Patient-Based Organizations to Achieve Patient Health Goals<br />
249<br />
6.25 Rumors of the Platform Company 뭩 Demise are Greatly Exaggerated 249<br />
6.26 Who 뭩 Going to Pay for It? 249<br />
7. Company Profiles 252<br />
7.1 Abaxis 252<br />
7.2 Abbott 252<br />
7.3 Adaltis, Inc. 255<br />
7.4 Alfa Wasserman, Inc. (formerly Electro-Nucleonics, Inc. and Schiapparelli<br />
Biosystems, Inc.) 255<br />
7.5 Awareness Technology 256<br />
7.6 Beckman Coulter, Inc. 256<br />
7.7 Bio-Reference Laboratories, Inc. 264<br />
7.8 Dade Behring, Inc. 264<br />
7.9 Enzo Biochem, Inc. 265<br />
7.10 Genomic Health, Inc. 265<br />
7.11 Hitachi 265<br />
7.12 Horiba Ltd. 266<br />
7.13 JEOL Ltd. 267<br />
7.14 LabCorp 268<br />
7.15 MEDTOX Scientific, Inc. 268<br />
7.16 Monogram Biosciences, Inc. 269<br />
7.17 Myriad Genetics, Inc. 269<br />
Copyright c 2010 SBD Information Co., Ltd. All rights reserved.
7.18 Nova Biomedical 269<br />
7.19 Olympus America, Inc. Diagnostic Systems Division 270<br />
7.20 Ortho-Clinical Diagnostics, a J&J Company 271<br />
7.21 Psychemedics Corporation 274<br />
7.22 Quest Diagnostics, Inc. 274<br />
7.23 Roche Diagnostics Corp. 275<br />
7.24 Shimadzu 278<br />
7.25 Sysmex Corporation 278<br />
7.26 Thermo Fisher Scientific, Inc. 279<br />
7.27 Vital Scientific, NV 281<br />
LIST OF FIGURES<br />
Figure 2.1: Clinical Laboratory Testing Sector Providers 17<br />
Figure 2.2: Part B Spending on Clinical Laboratory Services, 1991-2007 57<br />
Figure 3.1: IVD Product Demand 63<br />
Figure 3.2: European IVD Market by Clinical Specialty 70<br />
Figure 3.3: Chinese IVD Market, 2006-2012 104<br />
Figure 3.4: Annual Worldwide IVD Market Growth, 2003-2012 119<br />
Figure 3.5: POL Revenue, 2000-2006 121<br />
Figure 3.6: Unweighted Average Medicare Reimbursement for Ten Most Common POL<br />
Tests, 2002 vs. 2006 121<br />
Figure 3.7: Total Number of Non-Waived POLs, 2000-2006 122<br />
Figure 3.8: Number of New Tests Granted CLIA-Waived Status, 2000-2006 123<br />
Figure 3.9: High-Volume Waived Tests 124<br />
Figure 6.1: Average Revenue-Multiple Paid to Acquire Labs, 2000-2006 226<br />
Figure 6.2: Hospital Market Share for Outreach Programs 240<br />
Copyright c 2010 SBD Information Co., Ltd. All rights reserved.
LIST OF TABLES<br />
Table 2.1: Total U.S. Clinical Laboratory Revenue from Third Party and Direct<br />
Payment, 2005-2012 17<br />
Table 2.2: U.S. Clinical Laboratory Diagnostic Test Market Segments, 2007 18<br />
Table 2.3: Independent Commercial Laboratory Testing Market Value, 2005-2012 18<br />
Table 2.4: Independent Commercial Laboratory Testing Test Volume, 2005-2012 18<br />
Table 2.5: Leading U.S. Reference Laboratories Grouped by Market Capitalization,<br />
2008 19<br />
Table 2.6: Revenue Growth at Quest Diagnostics, 2000-2008 24<br />
Table 2.7: Revenue Growth at LabCorp, 2000-2008 25<br />
Table 2.8: Quest 뭩 Total Volume of Requisitions and Net Revenues from Clinical<br />
Laboratory Testing, 2007 25<br />
Table 2.9: Number of Hospital Based Clinical Laboratory Tests in the U.S.,<br />
2002-2008 27<br />
Table 2.10: European Cardiovascular Disease Management Expenditures, 2003-2010<br />
31<br />
Table 2.11: U.S. Doctor 뭩 Office Lab Test Dollar Volume and Growth Rates, 2006<br />
32<br />
Table 2.12: Worldwide Alternate Site Clinical Lab Instrument and Reagents Sales,<br />
2005-2012 33<br />
Table 2.13: Thirteen Largest Diagnostic Companies Worldwide, 2007 34<br />
Table 2.14: Products Marketed by Abbott in the Diagnostic Market 39<br />
Table 2.15: Prodesse 뭩 ASRs 49<br />
Table 2.16: Allowed Charges for Top 25 Clinical Laboratory Procedures, 2009 58<br />
Table 3.1: Worldwide IVD Testing Market, 2008 59<br />
Table 3.2: Worldwide Distribution of IVD Testing, 2008 59<br />
Table 3.3: Global Clinical Laboratory Market Sales, 1998-2012 60<br />
Table 3.4: Thirteen Largest Diagnostic Companies Worldwide, 2007 61<br />
Table 3.5: U.S. Clinical Laboratory Testing Market, 2003-2012 64<br />
Table 3.6: U.S. Clinical Laboratory Diagnostic Test Market Segments, 2007 64<br />
Table 3.7: U.S. Clinical Diagnostic POCT and Rapid Test Market Segments, 2007 65<br />
Table 3.8: U.S. Individual Clinical Chemistry Laboratory Diagnostic Test<br />
Markets, 2007 65<br />
Copyright c 2010 SBD Information Co., Ltd. All rights reserved.
Table 3.9: European Clinical Laboratory Testing IVD Reagents and Instruments<br />
Market, 2000-2012 66<br />
Table 3.10: European Clinical Laboratory Diagnostic Testing Reagents and<br />
Instruments Market by Analyte, 2006 66<br />
Table 3.11: European Clinical Chemistry Testing IVD Reagents and Instruments<br />
Market, 2000-2012 67<br />
Table 3.12: European Clinical Laboratory Testing Diagnostics by Country Market,<br />
2008 68<br />
Table 3.13: European Rapid POCT by Country Market, 2008 69<br />
Table 3.14: European Patient Self Testing OTC Diagnostics by Country Market,<br />
2006 69<br />
Table 3.15: German Clinical Laboratory Testing Diagnostics Products Market<br />
Sales, 2003-2012 76<br />
Table 3.16: German Clinical Diagnostic Rapid Test Market Segments, 2008 76<br />
Table 3.17: U.K. Clinical Laboratory Diagnostics Products Market Sales,<br />
2003-2012 77<br />
Table 3.18: U.K. Clinical Diagnostic Rapid Test Market Segments, 2008 78<br />
Table 3.19: Major U.K. IVD Manufacturers 79<br />
Table 3.20: U.S. IVD Manufacturers Doing Business in the U.K. 79<br />
Table 3.21: Other European Companies that Manufacture IVD Products in the U.K.<br />
79<br />
Table 3.22: French Clinical IVD Testing Diagnostics Products Market Sales,<br />
2003-2012 80<br />
Table 3.23: French Clinical Diagnostic Rapid Test Market Segments, 2008 80<br />
Table 3.24: Italian Laboratory Diagnostics Products Market Sales, 2003-2012 81<br />
Table 3.25: Italian Clinical Diagnostic Rapid Test Market Segments, 2008 82<br />
Table 3.26: Spanish Clinical Laboratory Diagnostics Products Market Sales,<br />
2003-2012 82<br />
Table 3.27: Spanish Clinical Diagnostic Rapid Test Market Segments, 2008 83<br />
Table 3.28: Finnish Clinical Laboratory Diagnostics Products Market Sales,<br />
2003-2012 83<br />
Table 3.29: Turkish Clinical Laboratory Testing Market, 2000-2012 84<br />
Table 3.30: Belgium Clinical Laboratory Diagnostics Products Market Sales,<br />
2003-2012 84<br />
Table 3.31: Belgium Clinical Reagents and Instruments Market, 2006 85<br />
Copyright c 2010 SBD Information Co., Ltd. All rights reserved.
Table 3.32: Swiss Clinical Laboratory Diagnostics Products Market Sales,<br />
2003-2012 85<br />
Table 3.33: Swiss Clinical Reagents and Instruments Market, 2006 86<br />
Table 3.34: Dutch Clinical Laboratory Diagnostics Products Market Sales,<br />
2003-2012 86<br />
Table 3.35: Dutch Clinical Reagents and Instruments Market, 2006 87<br />
Table 3.36: Portuguese Clinical Laboratory Diagnostics Products Market Sales,<br />
2003-2012 87<br />
Table 3.37: Portuguese Clinical Reagents and Instruments Market, 2006 88<br />
Table 3.38: Austrian Clinical Laboratory Diagnostics Products Market Sales,<br />
2003-2012 88<br />
Table 3.39: Austrian Clinical Reagents and Instruments Market, 2006 89<br />
Table 3.40: Greek Clinical Laboratory Diagnostics Products Market Sales,<br />
2003-2012 89<br />
Table 3.41: Greek Clinical Reagents and Instruments Market, 2006 90<br />
Table 3.42: Polish Clinical Laboratory Diagnostics Products Market Sales,<br />
2003-2012 90<br />
Table 3.43: Polish Clinical Reagents and Instruments Market, 2006 91<br />
Table 3.44: Romanian Clinical Laboratory Diagnostics Products Market Sales,<br />
2003-2012 91<br />
Table 3.45: Romanian Clinical Reagents and Instruments Market, 2006 92<br />
Table 3.46: Czech Republic Clinical Laboratory Diagnostics Products Market<br />
Sales, 2003-2012 92<br />
Table 3.47: Swedish Clinical Laboratory Diagnostics Products Market Sales,<br />
2003-2012 93<br />
Table 3.48: Norwegian Clinical Laboratory Diagnostics Products Market Sales,<br />
2003-2012 93<br />
Table 3.49: Irish Clinical Laboratory Diagnostics Products Market Sales,<br />
2003-2012 94<br />
Table 3.50: Hungarian Clinical Laboratory Diagnostics Products Market Sales,<br />
2003-2012 94<br />
Table 3.51: Bulgarian Clinical Laboratory Diagnostics Products Market Sales,<br />
2003-2012 95<br />
Table 3.52: Slovakian Clinical Laboratory Diagnostics Products Market Sales,<br />
2003-2012 95<br />
Table 3.53: Lithuanian Clinical Laboratory Diagnostics Products Market Sales,<br />
2003-2012 96<br />
Copyright c 2010 SBD Information Co., Ltd. All rights reserved.
Table 3.54: Latvian Clinical Laboratory Diagnostics Products Market Sales,<br />
2003-2012 96<br />
Table 3.55: Estonian Clinical Laboratory Diagnostics Products Market Sales,<br />
2003-2012 97<br />
Table 3.56: Slovenian Clinical Laboratory Diagnostics Products Market Sales,<br />
2003-2012 97<br />
Table 3.57: Indian IVD Market for Instruments and Reagents, 2004-2012 98<br />
Table 3.58: Number of Automated Clinical Labs in India, 2004-2012 98<br />
Table 3.59: Indian IVD Market, 2008 99<br />
Table 3.60: Japanese Clinical Laboratory Testing Instrument and Reagents Market,<br />
2003-2012 103<br />
Table 3.61: Chinese Clinical Laboratory Diagnostics Products Market Sales,<br />
2003-2012 104<br />
Table 3.62: Chinese IVD Market, 2008 104<br />
Table 3.63: Proportion of Medical Expenses Paid Privately 106<br />
Table 3.64: Chinese International IVD Manufacturers 107<br />
Table 3.65: Chinese Domestic IVD Manufacturers 108<br />
Table 3.66: Chinese IVD Distributors 110<br />
Table 3.67: Canadian Clinical Laboratory Testing Market, 2000-2008 111<br />
Table 3.68: Brazilian Clinical Laboratory Testing Market, 2000-2008 112<br />
Table 3.69: Australian Clinical Laboratory Testing Market, 2000-2008 112<br />
Table 3.70: ROW Clinical Laboratory Testing Market, 2000-2008 113<br />
Table 3.71: Number of Clinical Laboratories in Latin America 118<br />
Table 3.72: Twenty Most Common Laboratory Tests Offered at Family Physician<br />
Offices 125<br />
Table 3.73: Important New Waived Tests 125<br />
Table 3.74: Principal Marketers of Automated Clinical Laboratory Instruments 126<br />
Table 3.75: Key Market Drivers of Automated Clinical Laboratory Instruments 131<br />
Table 3.76: Key Market Limits of Automated Clinical Laboratory Instruments 133<br />
Table 4.1: Ultra-Large Clinical Laboratory Analyzers 143<br />
Table 4.2: JEOL Analyzer Comparison 151<br />
Table 4.3: Large Clinical Laboratory Analyzers 154<br />
Table 4.4: Mid-size Clinical Laboratory Analyzers 158<br />
Copyright c 2010 SBD Information Co., Ltd. All rights reserved.
Table 4.5: Small Clinical Laboratory Analyzers 164<br />
Table 4.6: Large Immunochemistry Analyzers 173<br />
Table 4.7: Small Immunoassay Analyzers 176<br />
Table 4.8: Linearity and Precision of Abbott CELL-DYN Hematology Analyzers 178<br />
Table 4.9: Accuracy of the Automated Differential of Abbott CELL-DYN Analyzers<br />
179<br />
Table 4.10: Linearity and Precision of Siemens Hematology Analyzers 180<br />
Table 4.11: Accuracy of the Automated Differential of Siemens Hematology<br />
Analyzers 181<br />
Table 4.12: Linearity and Precision of Beckman Coulter Hematology Instruments<br />
183<br />
Table 4.13: Accuracy of the Automated Differential of Beckman Coulter Hematology<br />
Analyzers 183<br />
Table 4.14: Linearity and Precision of Horiba ABX Hematology Analyzers 185<br />
Table 4.15: Accuracy of the Horiba ABX Hematology Analyzers 186<br />
Table 4.16: Linearity and Precision of Sysmex Hematology Analyzers 189<br />
Table 4.17: Accuracy of the Sysmex Hematology Analyzers 189<br />
Table 4.18: Comparison of Linearity and Precision of Top-of-the-Line Hematology<br />
Analyzers 190<br />
Table 4.19: Comparison of Accuracy of the Top-of-the-Line Hematology Analyzers<br />
190<br />
Table 4.20: Hematology Analyzers with a Five-Part WBC Differential 191<br />
Table 4.21: Hematology Analyzers with a Three-Part WBC Differential 191<br />
Table 4.22: Point of Care Testing 193<br />
Table 4.23: Number of ER Visits in U.S. Hospitals, 1997-2007 195<br />
Table 4.24: Number of POCT in U.S., 2000-2012 195<br />
Table 4.25: PAP Tests in Top European Markets 197<br />
Table 4.26: PAP Tests in Top Asian Markets 197<br />
Table 5.1: Normal Glucose Values 뾈 asting State 207<br />
Table 5.2: Applications for Wireless LAN Technology 216<br />
Table 7.1: Products Marketed by Abbott in the Diagnostics Market 253<br />
Table 7.2: Comparison of JEOL Analyzers 267<br />
Copyright c 2010 SBD Information Co., Ltd. All rights reserved.
Table 7.3: The VITROS ECiQ Immunodiagnostic System 273<br />
Table 7.4: Sysmex Marketing Summary for China 279<br />
Copyright c 2010 SBD Information Co., Ltd. All rights reserved.
보고서 문의<br />
Copyright c 2010 SBD Information Co., Ltd. All rights reserved.


