Characterization of poly(methyl methacrylate) nanoparticles ...
Characterization of poly(methyl methacrylate) nanoparticles ...
Characterization of poly(methyl methacrylate) nanoparticles ...

Create successful ePaper yourself
Turn your PDF publications into a flip-book with our unique Google optimized e-Paper software.
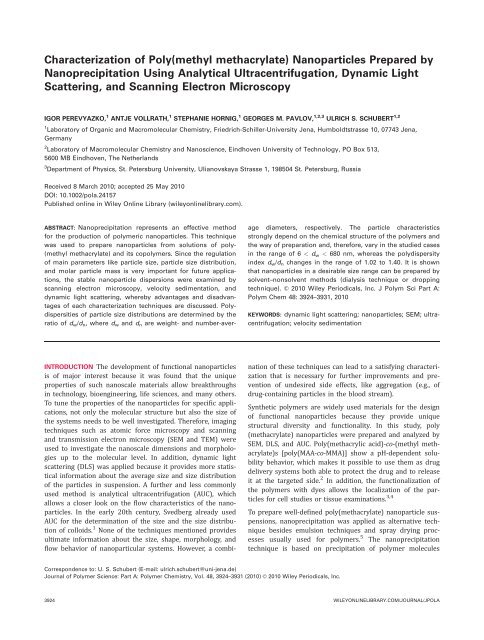
<strong>Characterization</strong> <strong>of</strong> Poly(<strong>methyl</strong> <strong>methacrylate</strong>) Nanoparticles Prepared by<br />
Nanoprecipitation Using Analytical Ultracentrifugation, Dynamic Light<br />
Scattering, and Scanning Electron Microscopy<br />
IGOR PEREVYAZKO, 1 ANTJE VOLLRATH, 1 STEPHANIE HORNIG, 1 GEORGES M. PAVLOV, 1,2,3 ULRICH S. SCHUBERT 1,2<br />
1 Laboratory <strong>of</strong> Organic and Macromolecular Chemistry, Friedrich-Schiller-University Jena, Humboldtstrasse 10, 07743 Jena,<br />
Germany<br />
2 Laboratory <strong>of</strong> Macromolecular Chemistry and Nanoscience, Eindhoven University <strong>of</strong> Technology, PO Box 513,<br />
5600 MB Eindhoven, The Netherlands<br />
3 Department <strong>of</strong> Physics, St. Petersburg University, Ulianovskaya Strasse 1, 198504 St. Petersburg, Russia<br />
Received 8 March 2010; accepted 25 May 2010<br />
DOI: 10.1002/pola.24157<br />
Published online in Wiley Online Library (wileyonlinelibrary.com).<br />
ABSTRACT: Nanoprecipitation represents an effective method<br />
for the production <strong>of</strong> <strong>poly</strong>meric <strong>nanoparticles</strong>. This technique<br />
was used to prepare <strong>nanoparticles</strong> from solutions <strong>of</strong> <strong>poly</strong>-<br />
(<strong>methyl</strong> <strong>methacrylate</strong>) and its co<strong>poly</strong>mers. Since the regulation<br />
<strong>of</strong> main parameters like particle size, particle size distribution,<br />
and molar particle mass is very important for future applications,<br />
the stable nanoparticle dispersions were examined by<br />
scanning electron microscopy, velocity sedimentation, and<br />
dynamic light scattering, whereby advantages and disadvantages<br />
<strong>of</strong> each characterization techniques are discussed. Polydispersities<br />
<strong>of</strong> particle size distributions are determined by the<br />
ratio <strong>of</strong> d w /d n , where d w and d n are weight- and number-average<br />
diameters, respectively. The particle characteristics<br />
strongly depend on the chemical structure <strong>of</strong> the <strong>poly</strong>mers and<br />
the way <strong>of</strong> preparation and, therefore, vary in the studied cases<br />
in the range <strong>of</strong> 6 < d w < 680 nm, whereas the <strong>poly</strong>dispersity<br />
index d w /d n changes in the range <strong>of</strong> 1.02 to 1.40. It is shown<br />
that <strong>nanoparticles</strong> in a desirable size range can be prepared by<br />
solvent–nonsolvent methods (dialysis technique or dropping<br />
technique). VC 2010 Wiley Periodicals, Inc. J Polym Sci Part A:<br />
Polym Chem 48: 3924–3931, 2010<br />
KEYWORDS: dynamic light scattering; <strong>nanoparticles</strong>; SEM; ultracentrifugation;<br />
velocity sedimentation<br />
INTRODUCTION The development <strong>of</strong> functional <strong>nanoparticles</strong><br />
is <strong>of</strong> major interest because it was found that the unique<br />
properties <strong>of</strong> such nanoscale materials allow breakthroughs<br />
in technology, bioengineering, life sciences, and many others.<br />
To tune the properties <strong>of</strong> the <strong>nanoparticles</strong> for specific applications,<br />
not only the molecular structure but also the size <strong>of</strong><br />
the systems needs to be well investigated. Therefore, imaging<br />
techniques such as atomic force microscopy and scanning<br />
and transmission electron microscopy (SEM and TEM) were<br />
used to investigate the nanoscale dimensions and morphologies<br />
up to the molecular level. In addition, dynamic light<br />
scattering (DLS) was applied because it provides more statistical<br />
information about the average size and size distribution<br />
<strong>of</strong> the particles in suspension. A further and less commonly<br />
used method is analytical ultracentrifugation (AUC), which<br />
allows a closer look on the flow characteristics <strong>of</strong> the <strong>nanoparticles</strong>.<br />
In the early 20th century, Svedberg already used<br />
AUC for the determination <strong>of</strong> the size and the size distribution<br />
<strong>of</strong> colloids. 1 None <strong>of</strong> the techniques mentioned provides<br />
ultimate information about the size, shape, morphology, and<br />
flow behavior <strong>of</strong> nanoparticular systems. However, a combination<br />
<strong>of</strong> these techniques can lead to a satisfying characterization<br />
that is necessary for further improvements and prevention<br />
<strong>of</strong> undesired side effects, like aggregation (e.g., <strong>of</strong><br />
drug-containing particles in the blood stream).<br />
Synthetic <strong>poly</strong>mers are widely used materials for the design<br />
<strong>of</strong> functional <strong>nanoparticles</strong> because they provide unique<br />
structural diversity and functionality. In this study, <strong>poly</strong><br />
(<strong>methacrylate</strong>) <strong>nanoparticles</strong> were prepared and analyzed by<br />
SEM, DLS, and AUC. Poly(methacrylic acid)-co-(<strong>methyl</strong> <strong>methacrylate</strong>)s<br />
[<strong>poly</strong>(MAA-co-MMA)] show a pH-dependent solubility<br />
behavior, which makes it possible to use them as drug<br />
delivery systems both able to protect the drug and to release<br />
it at the targeted side. 2 In addition, the functionalization <strong>of</strong><br />
the <strong>poly</strong>mers with dyes allows the localization <strong>of</strong> the particles<br />
for cell studies or tissue examinations. 3,4<br />
To prepare well-defined <strong>poly</strong>(<strong>methacrylate</strong>) nanoparticle suspensions,<br />
nanoprecipitation was applied as alternative technique<br />
besides emulsion techniques and spray drying processes<br />
usually used for <strong>poly</strong>mers. 5 The nanoprecipitation<br />
technique is based on precipitation <strong>of</strong> <strong>poly</strong>mer molecules<br />
Correspondence to: U. S. Schubert (E-mail: ulrich.schubert@uni-jena.de)<br />
Journal <strong>of</strong> Polymer Science: Part A: Polymer Chemistry, Vol. 48, 3924–3931 (2010) VC 2010 Wiley Periodicals, Inc.<br />
3924 WILEYONLINELIBRARY.COM/JOURNAL/JPOLA
ARTICLE<br />
into nanoscale particles during displacement <strong>of</strong> a solvent<br />
with a nonsolvent. 6,7 Till now, nanoprecipitation is mainly<br />
used for <strong>poly</strong>(lactides) and its co<strong>poly</strong>mers; however, it is, applicable<br />
in principle for all <strong>poly</strong>mers under certain conditions.<br />
8–10 The latter could be shown not only for example for<br />
diverse <strong>poly</strong>saccharide derivatives, namely cellulose 11 and<br />
dextran esters, 12 several industrially prepared <strong>poly</strong>mers 13<br />
but also highly functional pentafluorostyrenes. 14 In this<br />
work, co<strong>poly</strong>mers <strong>of</strong> MMA with MAA and ethylacrylate (EA),<br />
in particular <strong>poly</strong>(MMA-stat-MAA) 1:2 and <strong>poly</strong>(MMA-stat-<br />
EA) 1:4 , a homo<strong>poly</strong>mer <strong>of</strong> <strong>poly</strong>(<strong>methyl</strong> metharcrylate)<br />
(PMMA) and a fluorescence-labeled <strong>poly</strong>(MMA-stat-PyMMA)<br />
were formed into nanoscale particles, applying a dialysis and<br />
a dropping technique. The particle formation and, consequently,<br />
the resulting size and shape <strong>of</strong> the particles strongly<br />
depend on the concentration <strong>of</strong> the <strong>poly</strong>mer solutions, the<br />
solvent, the solvent to nonsolvent ratio, and the course <strong>of</strong><br />
the reaction. All these factors influence the self-assembly <strong>of</strong><br />
the <strong>poly</strong>mer molecules from the dissolved state into defined<br />
nanoparticular systems. The nanoparticle suspensions<br />
formed were characterized extensively by SEM, TEM, and<br />
AUC including storage stability, to evaluate their ability as<br />
possible carries for drug delivery and diagnostics.<br />
EXPERIMENTAL<br />
Materials<br />
Poly(MMA-stat-MAA) 1:2 and <strong>poly</strong>(MMA-stat-EA) 1:4 were<br />
kindly provided by Evonik Röhm GmbH (Darmstadt, Germany).<br />
Pyren-1-yl<strong>methyl</strong><strong>methacrylate</strong> (PyMMA), P(MMA-stat-<br />
PyMMA), and PMMA were prepared by a reversible additionfragmentation<br />
chain-transfer <strong>poly</strong>merization. 15–17 Purified<br />
N,N-di<strong>methyl</strong>acetamide (DMA) was purchased from VWR<br />
(West Chester, PA).<br />
METHODS<br />
Size Exclusion Chromatography (SEC)<br />
SEC was performed on a Shimadzu system, equipped with a<br />
SCL-10A VP system controller, a LC-10AD VP pump, a RID-<br />
10A refractive index detector, and a PSS SDV linear S column,<br />
with a mixture <strong>of</strong> chlor<strong>of</strong>orm:triethyl-amine:2-propanol<br />
(94:4:2) as eluent at 1 mL/min flow rate at 40 C. Additional<br />
SEC measurements were performed on an Agilent 1200 series<br />
LC system (isocratic pump G1310A, refractive index detector<br />
G1362A) with a PSS Gram30 and a PSS Gram1000 column in<br />
series. DMA containing 0.21% LiCl (m/v) was used as eluent<br />
at a flow rate <strong>of</strong> 1 mL/min at 40 C. As calibration standard,<br />
PMMA was used.<br />
SEM<br />
The nanoparticle suspensions were diluted with demineralized<br />
filtered water to a final concentration <strong>of</strong> 1 mg/mL. The<br />
suspensions were characterized by SEM using the system<br />
LEO-1450 VP (Leo, Oberkochen, Germany) operating at 10 kV.<br />
For this, one droplet (15–20 lL) <strong>of</strong> the suspension was placed<br />
on a mica surface, lyophilized for 3 h and finally covered with<br />
gold using a sputter coating device BAL-TEC SCD005 (Balzers,<br />
Lichtenstein; 60 mA, 80 s). The diameter <strong>of</strong> the nanoparticle<br />
was measured using the ImageJ s<strong>of</strong>tware. 18<br />
Sedimentation Velocity Experiments<br />
Sedimentation velocity experiments were performed with a<br />
Beckman XLI analytical ultracentrifuge (ProteomeLab XLI Protein<br />
<strong>Characterization</strong> System). They were carried out in conventional<br />
double-sector Epon centerpieces <strong>of</strong> 12-mm optical<br />
path length in a four holes rotor. Cells were filled with<br />
420 lL <strong>of</strong> suspension and 440 lL <strong>of</strong> solvent (H 2 OorD 2 O). A<br />
rotor speed <strong>of</strong> 3,000 to 40,000 rpm was used depending on<br />
the sample. The nanoparticle suspensions were used without<br />
further purification. The rotor was equilibrated for 2 hat<br />
20 C in the centrifuge. Sedimentation pr<strong>of</strong>iles were obtained<br />
every 15 s by interference optics, and the sedimentation data<br />
were evaluated by the program Sedfit. 19<br />
Particle <strong>Characterization</strong> by DLS<br />
DLS was performed on a Zetasizer Nano ZS (Malvern instruments,<br />
Malvern, United Kingdom) equipped with a 10 mW<br />
He–Ne laser (633 nm) and operating at an angle <strong>of</strong> 173 . The<br />
nanoparticle suspensions were diluted with demineralized, filtered<br />
water to a final concentration <strong>of</strong> 0.02 mg/mL, and<br />
measured three times at 25 C for 150 s. From the experimental<br />
data (autocorrelation function), the size information<br />
can be obtained by using the method <strong>of</strong> cumulants. 20–22 In<br />
the cumulants method, the logarithm <strong>of</strong> the correlation function<br />
is given as:<br />
ln½g 2 ðsÞŠ ¼<br />
K 1 s þ K 2 s 2 =2 þ<br />
where K 1 and K 2 are the cumulants and s is a delay time.<br />
This method provides z-average size; the width <strong>of</strong> the distribution<br />
is related to the <strong>poly</strong>dispersity index (PDI DLS ), which<br />
is defined as relation<br />
PDI DLS ¼<br />
sffiffiffiffiffiffi<br />
K 2<br />
K1<br />
2<br />
where K 1 and K 2 are the first- and the second-order cumulant<br />
<strong>of</strong> the light scattered intensity, respectively. It should be<br />
noted that the PDI DLS cannot be related with the particle<br />
size ratio in a simple way.<br />
Preparation <strong>of</strong> the Nanoparticles<br />
Nanoparticles <strong>of</strong> different PMMA homo<strong>poly</strong>mers and co<strong>poly</strong>mers<br />
were obtained via nanoprecipitation. 7,23 Two techniques<br />
were applied for the nanoparticle formation: dialysis and a<br />
dropping technique. 13,24 For the dialysis process, 10 mg <strong>of</strong><br />
the <strong>poly</strong>mer was dissolved in 2.5 mL purified DMA as organic<br />
solvent, transferred into a regenerated cellulose membrane<br />
(Spectra/Por VR , Rancho Dominguez, CA, molar mass cut<strong>of</strong>f<br />
6,000–8,000 g/mol), and dialyzed against 500 mL distilled<br />
water. The surrounding water was exchanged five times in a<br />
period <strong>of</strong> 12 h until all DMA was replaced. As a typical example<br />
for the dropping technique, 10 mg <strong>of</strong> the <strong>poly</strong>mer was<br />
dissolved in 2.5 mL acetone, and the solution was added<br />
dropwise under stirring to 10 mL distilled water or deuterated<br />
water, respectively, or vice versa water was dropped into<br />
the <strong>poly</strong>mer solution. The acetone was removed by evaporation<br />
at 40 C overnight. The nanoparticle suspensions prepared<br />
were stored at 4 C.<br />
CHARACTERIZATION OF PMMA NANOPARTICLES, PEREVYAZKO ET AL. 3925
JOURNAL OF POLYMER SCIENCE: PART A: POLYMER CHEMISTRY DOI 10.1002/POLA<br />
TABLE 1 <strong>Characterization</strong> <strong>of</strong> PMMA and PMMA Co<strong>poly</strong>mers<br />
Sample Ratio M n (g/mol) M w (g/mol) PDI<br />
Poly(MMA) – 10,100 a 11,200 a 1.11 a<br />
Poly(MAA-stat-MMA) 1:2 1:2 10,000 b 19,600 b 1.96 b<br />
Poly(MMA-stat-EA) 1:4 1:4 10,000 b 23,800 b 2.38 b<br />
Poly(MMA-stat-PyMMA) 95:5 9,100 a 10,600 a 1.16 a<br />
a Calculated from SEC (CHCl 3 ) with PMMA standards.<br />
b Calculated from SEC (DMA/LiCl) with PMMA standards.<br />
RESULTS AND DISCUSSION<br />
A homo<strong>poly</strong>mer <strong>of</strong> PMMA and the co<strong>poly</strong>mers <strong>poly</strong>(MMAstat-MAA)<br />
1:2 , <strong>poly</strong>(MMA-stat-EA) 1:4 , as well as <strong>poly</strong>(MMAstat-PyMMA)<br />
were transformed into nanoscale materials by<br />
applying different nanoprecipitation techniques. The molar<br />
mass <strong>of</strong> the MMA-based <strong>poly</strong>mers and their PDIs were estimated<br />
by size-exclusion chromatography (SEC) (Table 1). In<br />
the following, the particle suspensions <strong>of</strong> the synthetic <strong>poly</strong>mers<br />
will be characterized and compared applying SEM,<br />
AUC, and DLS.<br />
Distributions and Size Average Values<br />
Because <strong>of</strong> the use <strong>of</strong> different methods for characterizing<br />
the nanoparticle suspensions, also different size distributions<br />
were obtained. SEM investigations yield number distributions.<br />
From velocity sedimentation, a weight-average distribution<br />
can be obtained. In addition, the translational diffusion<br />
coefficients D z resulting from DLS represent z-averages.<br />
Usually, the weight-average distribution is shifted to higher<br />
values when compared with the number average distribution.<br />
However, at the same time, corresponding average values<br />
calculated from different kinds <strong>of</strong> distributions must<br />
coincide:<br />
d n ¼ P 1<br />
wi<br />
¼ X v i d i and d w ¼ X P<br />
vi di<br />
2 w i d i ¼ ;<br />
d i<br />
d n<br />
with v i ¼ ni<br />
N being the number fraction and w i ¼ P ndi<br />
ndi<br />
being<br />
the weight fraction. For <strong>poly</strong>disperse samples, the relation<br />
d w > d n can be applied. The heterogeneity <strong>of</strong> an ensemble <strong>of</strong><br />
<strong>nanoparticles</strong> can further be characterized by the ratio <strong>of</strong> different<br />
size average values PDI d ¼ dw<br />
d n<br />
. For particles with<br />
spherical shape, PDI d is related by a simple way to the molar<br />
3.<br />
mass distribution PDI M ¼ Mw<br />
M n<br />
¼ dw<br />
d n<br />
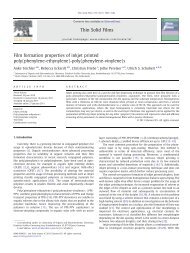
Particle <strong>Characterization</strong> by SEM<br />
The morphology and size distribution <strong>of</strong> the PMMA <strong>nanoparticles</strong><br />
was first investigated by SEM. Typical images <strong>of</strong> <strong>nanoparticles</strong><br />
from <strong>poly</strong>(MMA-stat-MAA) 1:2 and <strong>poly</strong>(MMA-stat-<br />
PyMMA) prepared by different precipitation techniques are<br />
shown in Figure 1. In all images, spherical-shaped particles<br />
in the nanoscale range can be observed. In some cases, adhesion<br />
<strong>of</strong> the particles is detected (dropping acetone solution<br />
<strong>of</strong> <strong>poly</strong>(MMA-stat-MAA) 1:2 into water). The corresponding<br />
histograms are presented in Figure 2. Based on these number<br />
<strong>of</strong> histograms, the average values d n and d w were calculated.<br />
Weight-average diameters are listed in Table 2, and<br />
d w /d n values are presented in Table 3. The number <strong>of</strong> individual<br />
particles N considered in the calculations varies<br />
between 100 and 300.<br />
Particle <strong>Characterization</strong> by AUC<br />
In an ultracentrifuge, <strong>nanoparticles</strong> will be fractionated<br />
according to their size, density, and shape. Therefore, sedimentation<br />
analysis in combination with Sedfit s<strong>of</strong>tware gives<br />
a reliable and adequate analysis <strong>of</strong> the <strong>nanoparticles</strong> including<br />
size and size distribution. A typical image obtained from<br />
the Sedfit program is shown in Figure 3. The data were<br />
FIGURE 1 SEM images <strong>of</strong> PMMA <strong>nanoparticles</strong> prepared by various techniques.<br />
3926 WILEYONLINELIBRARY.COM/JOURNAL/JPOLA
ARTICLE<br />
q 2<br />
v ¼ s 2g 2<br />
s 2 g 2 q 1<br />
s 1 g 1<br />
s 1 g 1<br />
DLS is a commonly used technique to determine the size distribution<br />
pr<strong>of</strong>ile <strong>of</strong> particles in suspension or <strong>of</strong> <strong>poly</strong>mers in<br />
solution. 29–31 The raw experimental data obtained in a DLS<br />
where s 1 , g 1 , q 1 ,ands 2 , g 2 , q 2 are sedimentation coefficients,<br />
dynamic viscosity, and solvent density measured in H 2 Oand<br />
D 2 O, respectively. The partial specific volume <strong>of</strong> the particles<br />
was found as u ¼ 0.78 cm 3 /g with maximum deviation 0.01.<br />
The nanoparticle suspensions were also investigated at different<br />
concentrations, to check for a possible concentration<br />
dependence <strong>of</strong> the sedimentation and frictional coefficient.<br />
However, no concentration dependence <strong>of</strong> s and f/f sph could<br />
be observed in the concentration range <strong>of</strong> 0.025 to 0.10 <br />
10 2 g/cm 3 . The fitted frictional ratio (f/f sph ) 0 obtained by<br />
c(s) analysis is virtually equal to 1, which confirms the<br />
spherical shape <strong>of</strong> the <strong>nanoparticles</strong> and supports the investigations<br />
by SEM. By combining Svedberg’s equation,<br />
s ¼ Mð1 vq 0Þ<br />
;<br />
N A f<br />
where f ¼ 3pgd is the translational friction coefficient, and<br />
the hard sphere approximation M ¼ NApd3<br />
6v<br />
, where N A is Avogadro<br />
number. The diameter d <strong>of</strong> the particles can be easily<br />
calculated from the following expression 28 :<br />
p<br />
d ¼ 3<br />
ffiffiffi pffiffiffiffiffiffiffi<br />
2 ½sŠv<br />
( )<br />
Based on equation (*), the c(s) and/or ls-g*(s) distributions<br />
can be converted to the distributions by sizes. The corresponding<br />
distributions are shown in Figure 4. Molar masses<br />
<strong>of</strong> the particles were estimated by applying the modified<br />
Svedberg’s equation<br />
p<br />
M s ¼ 9p<br />
ffiffiffi qffiffiffiffiffiffiffiffiffi<br />
2 NA ½sŠ 3 v<br />
Based on these mass distributions, the average values d w<br />
were calculated and listed in Table 2 with the M s<br />
estimations.<br />
Particle <strong>Characterization</strong> by DLS<br />
FIGURE 2 Size distribution, determined by SEM, <strong>of</strong> <strong>poly</strong>(MMAstat-PyMMA)<br />
<strong>nanoparticles</strong> prepared by different nanoprecipitation<br />
techniques: (1) dropping a solution <strong>of</strong> the <strong>poly</strong>mer in acetone<br />
into water, (2) dialysis <strong>of</strong> a solution in DMA against water,<br />
and (3) dropping water into the acetone/<strong>poly</strong>mer solution.<br />
modeled using two different analysis methods implemented in<br />
Sedfit: (1) c(s) analysis, which is based on a numerical solution<br />
<strong>of</strong> the Lamm equation; it allows to estimate the weight-average<br />
frictional ratio <strong>of</strong> all particles, and (2) the least-squares boundary<br />
modeling ls-g*(s), which describes sedimentation <strong>of</strong> a nondiffusing<br />
species. 25 A parameter necessary for the quantitative<br />
interpretation <strong>of</strong> sedimentation data is the partial specific volume<br />
u, which was determined by the ‘‘density variation<br />
method’’: by sedimentation velocity experiments on the nanoparticle<br />
suspensions using H 2 OandD 2 O, 26,27 assuming that the<br />
<strong>nanoparticles</strong> have the same size and molar mass in each solvent<br />
(which is equivalent to the assumption <strong>of</strong> a constancy <strong>of</strong><br />
the intrinsic sedimentation coefficients ½sŠ s0g 0<br />
ð1 vq 0 Þ<br />
). Applying<br />
this method, the partial specific volume value u <strong>of</strong> the particles<br />
canbeobtainedfromthefollowingequation:<br />
TABLE 2 Weight-Average Sizes <strong>of</strong> Nanoparticles Determined by SEM, AUC, and DLS and Their Molar Masses Determined by AUC<br />
N Sample Preparation SEM, d w (nm) AUC, d w (nm) M sf 10 6 (g/mol) DLS, d w (nm)<br />
1 <strong>poly</strong>(MMA) D a 310 300 12,000 480<br />
2 <strong>poly</strong>(MMA-stat-PyMMA) D 280 570 73,000 480<br />
3 A!W b 75 65 120 100<br />
4 W!A c 490 380 22,500 680<br />
5 <strong>poly</strong>(MMA-stat-MAA) 1:2 D 36 28 9.5 46<br />
6 A!W 43 35 18 41<br />
7 W!A 110 104 420 190<br />
8 <strong>poly</strong>(MMA-stat-EA) 1:4 D 135 106 425 150<br />
9 A!W – 6.6 0.04 5.8<br />
10 W!A – 105 420 270<br />
a Dialysis preparation technique.<br />
b Dropping acetone solution <strong>of</strong> a <strong>poly</strong>mer into water.<br />
c Dropping water into acetone solution <strong>of</strong> a <strong>poly</strong>mer.<br />
CHARACTERIZATION OF PMMA NANOPARTICLES, PEREVYAZKO ET AL. 3927
JOURNAL OF POLYMER SCIENCE: PART A: POLYMER CHEMISTRY DOI 10.1002/POLA<br />
TABLE 3 Calculated PDI Values Obtained from DLS, AUC, and<br />
SEM<br />
N PDI DLS DLS, d w /d n AUC, d w /d n SEM, d w /d n<br />
1 0.291 1.30 1.20 1.29<br />
2 0.346 1.26 1.24 1.40<br />
3 0.228 1.05 1.07 1.04<br />
4 0.321 1.09 1.12 1.04<br />
5 0.312 1.05 1.12 1.09<br />
6 0.300 1.05 1.13 1.10<br />
7 0.132 1.12 1.06 1.10<br />
8 0.194 1.03 1.06 1.12<br />
9 0.543 1.02 1.20 –<br />
10 0.237 1.08 1.06 –<br />
experiment is the intensity autocorrelation curve. For small<br />
particles, when d k, the Rayleigh scattering approximation<br />
is valid. The intensity I <strong>of</strong> light scattered by a single small<br />
particle from a beam <strong>of</strong> unpolarized light <strong>of</strong> wavelength k<br />
and intensity I 0 is given by:<br />
I ¼ I 0<br />
1 þ cos 2 h<br />
2R 2<br />
2p<br />
4 n<br />
2<br />
1<br />
2 d<br />
6<br />
k n 2 þ 2 2<br />
with R being the distance to the particle, y being the scattering<br />
angle, n being the refractive index <strong>of</strong> the particle, and d<br />
being its diameter. The scattering intensity <strong>of</strong> spherical particles<br />
is proportional to the sixth power <strong>of</strong> the diameter or<br />
the square <strong>of</strong> the molar mass: I d 6 M 2 . Thus, a small<br />
amount <strong>of</strong> aggregates or larger particles can dominate the<br />
distribution, with the consequence that the intensity distribution<br />
can be somewhat misleading. The s<strong>of</strong>tware <strong>of</strong> the<br />
Zetasizer Nano ZS transforms the intensity distribution into<br />
volume and number distributions <strong>of</strong> the particles, with corresponding<br />
differential distribution qV/qd and qN/qd, respectively,<br />
based on the Mie theory. 32 In contrast to Rayleigh<br />
scattering, the Mie solution <strong>of</strong> the scattering problem is valid<br />
for all possible ratios <strong>of</strong> diameter to wavelength, although it<br />
results in a numerical summation <strong>of</strong> infinite sums.<br />
For particles with d k, the Rayleigh approximation allows<br />
the following scaling <strong>of</strong> the intensity: I 0.5 d 3 M. Therefore,<br />
the integral distribution I ¼ f(d) can be transformed<br />
into the corresponding I 0.5 ¼ f 1 (d) distribution, from which<br />
the differential distribution q(I 0.5 )/qd was obtained. The distribution<br />
q(I 0.5 )/qd may be close to qV/qd. A comparison <strong>of</strong><br />
the three types <strong>of</strong> distributions is presented in Figure 5 for<br />
the examined <strong>poly</strong>(MMA-stat-MAA) 1:2 . In an ideal case, the<br />
numerical size distribution shifts to smaller values in comparison<br />
with the weight distribution. In the majority <strong>of</strong> systems<br />
studied, this trend was observed; unexpectedly however,<br />
in some cases, the opposite <strong>of</strong> this trend was observed,<br />
where the weight distribution values were smaller than<br />
those <strong>of</strong> the corresponding numerical size distributions. The<br />
values <strong>of</strong> the weight-average diameter d w obtained by DLS<br />
are presented in Table 2. In general, they are in acceptable<br />
(but in some cases only in rough) agreement with those<br />
obtained by the other methods applied. Values obtained<br />
from DLS using different distributions are listed in Table 4.<br />
Comparison <strong>of</strong> Sizes and Distributions<br />
It is obvious from Figures 1 and 4 as well as Table 2 that<br />
different preparation techniques lead to different particle<br />
sizes and size distributions (by comparing data <strong>of</strong> the same<br />
characterization technique; otherwise it is somewhat<br />
obscured due to the differences in the measuring principles<br />
applied). Apparently, what matters is the way <strong>of</strong> exchanging<br />
the solvent: The exchange <strong>of</strong> the solvent to the nonsolvent is<br />
either fast, in case <strong>of</strong> the dropwise addition <strong>of</strong> the <strong>poly</strong>mer<br />
FIGURE 3 Sedimentation velocity<br />
experiments on <strong>poly</strong>(MMA-stat-<br />
MAA) 1:2 . The experiment was carried<br />
out at 12,000 rpm, scans were<br />
collected every 15 s. Top panel:<br />
superposition <strong>of</strong> sedimentation<br />
pr<strong>of</strong>iles obtained with interference<br />
optics at 20 C. Middle: corresponding<br />
residual plots. Bottom:<br />
differential distribution c(s) <strong>of</strong> the<br />
sedimentation coefficients. The distributions<br />
were obtained with a<br />
regularization procedure with a<br />
confidence level <strong>of</strong> 0.9.<br />
3928 WILEYONLINELIBRARY.COM/JOURNAL/JPOLA
ARTICLE<br />
TABLE 4 Weight-Average Diameters Calculated from DLS Data<br />
Using Different Distributions<br />
d w (nm)<br />
N<br />
Square Root <strong>of</strong> Intensity Volume Number<br />
d av<br />
w<br />
(nm)<br />
FIGURE 4 Size distributions, determined by DLS, <strong>of</strong> <strong>poly</strong>(MMAstat-MAA)<br />
1:2 <strong>nanoparticles</strong> prepared by different nanoprecipitation<br />
techniques: (1: solid line) by dropping an acetone solution<br />
<strong>of</strong> the <strong>poly</strong>mer into water, (2: dashed line) by dialysis <strong>of</strong> a<br />
DMA solution against water, (3: solid line) by dropping water<br />
to the acetone/<strong>poly</strong>mer solution.<br />
solution to water, or very slow, for the dialysis method as<br />
well as for dropping the water into acetone.<br />
Considering all data obtained for the PMMA particle suspensions,<br />
some qualitative conclusions can be drawn. By dropping<br />
the acetone/<strong>poly</strong>mer solution into water, the <strong>poly</strong>mer<br />
precipitates rapidly in the surplus <strong>of</strong> water. As a result, the<br />
formation <strong>of</strong> comparatively small <strong>nanoparticles</strong> (less than<br />
100 nm in diameter) could be observed. On the other hand,<br />
the successive dropping <strong>of</strong> water into the <strong>poly</strong>mer/acetone<br />
solution leads to a more defined precipitation <strong>of</strong> the <strong>poly</strong>mer<br />
molecules into <strong>nanoparticles</strong>. However, significantly larger<br />
particles are formed. The slow exchange <strong>of</strong> DMA as <strong>poly</strong>mer<br />
1 484 406 344 410 6 50<br />
2 476 455 451 460 6 10<br />
3 100 105 85 97 6 8<br />
4 684 661 637 650 6 10<br />
5 46 41 45 44 6 2<br />
6 41 40 40 40 6 1<br />
7 187 177 179 181 6 4<br />
8 150 149 150 150 6 1<br />
9 5.83 5.81 5.89 5.8 6 0.1<br />
10 269 267 261 266 6 3<br />
solvent against water applying dialysis yields particles with<br />
sizes in between the two dropping techniques, though with a<br />
broad size distribution.<br />
As a typical example, the size distributions for <strong>poly</strong>(MMAstat-MAA)<br />
1:2 particles obtained by DLS, SEM, and AUC are<br />
shown in Figure 6. The shapes <strong>of</strong> the distributions obtained<br />
from the different techniques have a similar appearance (i.e.,<br />
similar modalities <strong>of</strong> distribution). In Figure 7, the average<br />
measured weight diameter values <strong>of</strong> <strong>nanoparticles</strong> from corresponding<br />
distributions are compared from the different<br />
techniques, where the dotted straight line represents parity<br />
between the two measurements. In the size range below 150<br />
nm, a satisfactory correlation between the measurements<br />
from the different methods is observed. However, at larger<br />
sizes (> 300 nm) the measurement values collected by DLS<br />
exceed those <strong>of</strong> d SEM<br />
w . To understand this disparity in the<br />
measurements for this size domain, more data must be<br />
obtained. The parameter d w /d n , which characterizes the<br />
FIGURE 5 Comparison <strong>of</strong> different size distributions <strong>of</strong> a <strong>poly</strong>-<br />
(MMA-stat-MAA) 1:2 sample (prepared by dropping an acetone<br />
solution into water), all determined from DLS data: (1) number<br />
distribution, (2) volume distribution, and (3) square root <strong>of</strong><br />
scattered intensity. Number and volume distributions were<br />
automatically calculated from the intensity distribution by<br />
using the Mie theory.<br />
FIGURE 6 Size distribution <strong>of</strong> <strong>nanoparticles</strong> (prepared from an<br />
acetone solution <strong>of</strong> <strong>poly</strong>(MMA-stat-MAA) 1:2 by dropping water<br />
into it) as analyzed by (1) SEM (in bars), (2) AUC, and (3) DLS.<br />
CHARACTERIZATION OF PMMA NANOPARTICLES, PEREVYAZKO ET AL. 3929
JOURNAL OF POLYMER SCIENCE: PART A: POLYMER CHEMISTRY DOI 10.1002/POLA<br />
FIGURE 7 A comparison <strong>of</strong> particle weight-average sizes<br />
obtained by different methods. Values obtained by AUC (1–3)<br />
and DLS (4–6) plotted against measurements taken using SEM.<br />
Particles obtained by the dialysis technique (1,4), by dropping<br />
<strong>poly</strong>mer solution into water (2,5), and by dropping water into<br />
the <strong>poly</strong>mer solution (3,6), were compared. The dashed line<br />
slope is equal to measurement parity.<br />
dimensional <strong>poly</strong>dispersity <strong>of</strong> the ensemble <strong>of</strong> <strong>nanoparticles</strong>,<br />
changes in the limits 1.02 d w /d n 1.40, which means<br />
that the corresponding molar mass <strong>poly</strong>dispersity M w /M n<br />
will change in the limits 1.06 M w /M n 2.75. Figure 8<br />
demonstrates the slight increase <strong>of</strong> the d w /d n values with<br />
increasing diameter <strong>of</strong> the particles. The corresponding PDI<br />
values are listed in a Table 3.<br />
Analysis <strong>of</strong> Storage Stability<br />
The effect <strong>of</strong> storage <strong>of</strong> the dispersions (in the refrigerator at<br />
þ4 C) on particle diameters and size distributions was<br />
investigated by velocity sedimentation runs. Figure 9A<br />
shows the distributions <strong>of</strong> the sedimentation coefficient <strong>of</strong><br />
<strong>poly</strong>(MMA-stat-PyMMA) <strong>nanoparticles</strong> after different periods<br />
<strong>of</strong> time (1, 2, 4, 7, and 26 weeks, respectively). The shapes<br />
FIGURE 8 Correlation between the PDI values calculated from<br />
(1) AUC, (2) DLS, and (3) SEM data and the weight-average<br />
sizes estimated from AUC.<br />
FIGURE 9 Effect <strong>of</strong> storage on the distribution <strong>of</strong> the sedimentation<br />
coefficients (A) and on the number <strong>of</strong> interference<br />
fringes (B) <strong>of</strong> a <strong>poly</strong>(MMA-stat-PyMMA) suspension after (1) 1,<br />
(2) 2, (3) 4, (4) 7, and (5) 26 weeks <strong>of</strong> storage.<br />
<strong>of</strong> the distribution remain virtually the same, whereas the<br />
peak position fluctuates around 500 S. The area under the<br />
distribution curve is related to the total number <strong>of</strong> fringes<br />
which, in turn, is directly related to the concentration <strong>of</strong> the<br />
dispersed species by the following equation:<br />
<br />
kl Dn=Dc<br />
J ¼ c ;<br />
k<br />
where k is the light wavelength, k the magnifying coefficient,<br />
and l the optical path. 33 After 6 months, the particle concentration<br />
in suspension decreased only by 20% (see Fig. 9B),<br />
which could also be confirmed by monitoring the small<br />
amounts <strong>of</strong> sediment in the bottom <strong>of</strong> the flasks.<br />
CONCLUSIONS<br />
Nanoparticles <strong>of</strong> homo<strong>poly</strong>mers and co<strong>poly</strong>mers <strong>of</strong> PMMA<br />
were obtained by nanoprecipitation using three different<br />
methods. The characteristics <strong>of</strong> the particle suspensions<br />
were investigated by applying SEM, AUC, and DLS measurements.<br />
Each <strong>of</strong> these analysis tools provides information<br />
about the characteristics <strong>of</strong> the particles, however, also coming<br />
along with some benefits and disadvantages. SEM imaging<br />
shows the approximate shape <strong>of</strong> the particles but only<br />
for a comparatively small section. AUC and DLS measurements<br />
provide more statistical information about <strong>nanoparticles</strong><br />
in suspensions and do not require any drying processes.<br />
However, only a few larger aggregates are necessary<br />
to influence the DLS results yielding misleading data.<br />
Although requiring longer preparation and measurement<br />
times, AUC provides information about multimodal size distributions<br />
over a wide range <strong>of</strong> sizes. In this study, the diameters<br />
<strong>of</strong> the <strong>nanoparticles</strong> obtained by the nanoprecipitation<br />
method were in the range <strong>of</strong> 6 d 600 nm as revealed<br />
and discussed by various measuring principles. The PMMAbased<br />
<strong>poly</strong>mers form dispersions <strong>of</strong> spherical-shaped<br />
3930 WILEYONLINELIBRARY.COM/JOURNAL/JPOLA
ARTICLE<br />
particles in the nanoscale range, which are stable for at least<br />
6 months.<br />
The authors thank the Dutch Polymer Institute (DPI), Evonik<br />
Röhm GmbH and the Thuringian Ministry for Education, Science<br />
and Culture (grant #B514-09,051, NanoConSens) for financial<br />
support. The authors thank Evonik Röhm GmbH for<br />
providing the PMMA-PAA and PMMA-PEA co<strong>poly</strong>mers; the<br />
other <strong>poly</strong>mers were prepared by C. Pietsch (FSU Jena). The<br />
authors thank Dr. Richard Hoogenboom and in particular Pr<strong>of</strong>.<br />
Dr. Dieter Schubert for helpful comments.<br />
REFERENCES AND NOTES<br />
1 Svedberg, T.; Rinde, H. J Am Chem Soc 1924, 46, 2677.<br />
2 Ashford, M.; Fell, J. T.; Attwood, D.; Woodhead, P. J. Int J<br />
Pharm 1993, 91, 241–245.<br />
3 Josephson, L.; Kircher, M. F.; Mahmood, U.; Tang, Y.; Weissleder,<br />
R. Bioconjug Chem 2002, 13, 554–560.<br />
4 Santra, S.; Dutta, D.; Walter, G. A.; Moudgil, B. M. Technol<br />
Cancer Res Treat 2005, 4, 593–602.<br />
5 Mundargi, R. C.; Babu, V. R.; Rangaswamy, V.; Patel, P.; Aminabhavi,<br />
T. M. J Control Release 2008, 125, 193–209.<br />
6 Fessi, H.; Devissaguet, J.; Puisieux, F.; Thies, C. U.S. Patent<br />
5,118,528, 1990.<br />
7 Fessi, H.; Puisieux, F.; Devissaguet, J.; Ammoury, N.; Benita,<br />
S. Int J Pharm 1989, 55, R1–R4.<br />
8 Govender, T.; Stolnik, S.; Garnett, M.; Illum, L.; Davis, S. J<br />
Control Release 1999, 57, 171–185.<br />
9 Guterres, S.; Fessi, H.; Barrat, G.; Puisieux, F.; Devissaguet, J.<br />
Int J Pharm 1995, 113, 57–63.<br />
10 Lassalle, V.; Ferreira, M. Macromol Biosci 2007, 7, 767–783.<br />
11 Hornig, S.; Heinze, T. Biomacromolecule 2008, 9, 1487–1492.<br />
12 Hornig, S.; Heinze, T.; Biskup, C.; Gräfe, A.; Wotschadlo, J.;<br />
Liebert, T.; Mohr, G. S<strong>of</strong>t Matter 2008, 4, 1169–1172.<br />
13 Hornig, S.; Heinze, T.; Becer, C.; Schubert, U. S. J Mater<br />
Chem 2009, 19, 3838–3840.<br />
14 Becer, C.; Babiuch, K.; Pilz, D.; Hornig, S.; Heinze, T.; Gottschaldt,<br />
M.; Schubert, U. S. Macromolecules 2009, 42, 2387–2394.<br />
15 Jiang, J.; Tong, X.; Zhao, Y. J Am Chem Soc 2005, 127,<br />
8290–8291.<br />
16 Pietsch, C.; Fijten, M.; Lambermont-Thijs, H.; Hoogenboom,<br />
R.; Schubert, U. S. J Polym Sci Part A: Polym Chem 2009, 47,<br />
2811–2820.<br />
17 Pietsch, C.; Hoogenboom, R.; Schubert, U. S. Polym Chem 2010,<br />
DOI: 10.1039/c0py00162g.<br />
18 Collins, T. BioTechniques 2007, 43, 25–30.<br />
19 Schuck, P. Biophys J 2000, 78, 1606–1619.<br />
20 Frisken, B. Appl Opt 2001, 40, 4087–4091.<br />
21 Koppel, D. J Chem Phys 1972, 57, 4814–4820.<br />
22 Pecora, R. J Nanopart Res 2000, 2, 123–131.<br />
23 Lassalle, V.; Ferreira, M. Macromol Biosci 2007, 7, 767–783.<br />
24 Jeong, Y.; Cheon, J.; Kim, S.; Nah, J.; Lee, Y.; Sung, Y.;<br />
Akaite, T.; Cho, C. J Control Release 1998, 51, 169–178.<br />
25 Schuck, P.; Rossmanith, P. Bio<strong>poly</strong>mers 2000, 54, 328–341.<br />
26 Mächtle, W. Makromol Chem 1984, 185, 1025–1039.<br />
27 Müller, H. G.; Herrmann, F. Prog Colloid Polym Sci 1995, 99,<br />
114–119.<br />
28 This type <strong>of</strong> relation was first used by Svedberg and Estrup<br />
for an estimation <strong>of</strong> the sizes <strong>of</strong> particles <strong>of</strong> various dispersions<br />
sedimenting in the Earth gravitation field. Later, the relation<br />
was used by Dumanski, Zabotinski, and Ewsejew for colloidal<br />
gold particles sedimenting in a low speed ultracentrifuge. (a)<br />
Svedberg, T.; Estrup, K. Kolloid-Zeitschr 1911, 9, 259–261; (b)<br />
Dumanski, A.; Zabotinski, E.; Ewsejew, M. Kolloid-Zeitschr<br />
1913, 12, 6–11.<br />
29 McCracken, M.; Sammons, M. J Pharm Sci 1987, 76, 56–59.<br />
30 Hallet, F.; Watton, J.; Krygsman, P. Biophys J 1991, 59, 357–362.<br />
31 Bootz, A.; Vogel, V.; Schubert, D.; Kreuter, J. Eur J Pharm<br />
Biopharm 2003, 72, 369–375.<br />
32 Mie, G. Annalen der Physik Vierte Folge 1908, 25, 377–445.<br />
33 Pavlov, G.; Finet, S.; Tatarenko, K.; Korneeva, E.; Ebel, C.<br />
Eur Biophys J 2003, 32, 437–449.<br />
CHARACTERIZATION OF PMMA NANOPARTICLES, PEREVYAZKO ET AL. 3931