2007 - Texas A&M AgriLIFE Research Center at Beaumont - Texas ...
2007 - Texas A&M AgriLIFE Research Center at Beaumont - Texas ...
2007 - Texas A&M AgriLIFE Research Center at Beaumont - Texas ...

Create successful ePaper yourself
Turn your PDF publications into a flip-book with our unique Google optimized e-Paper software.
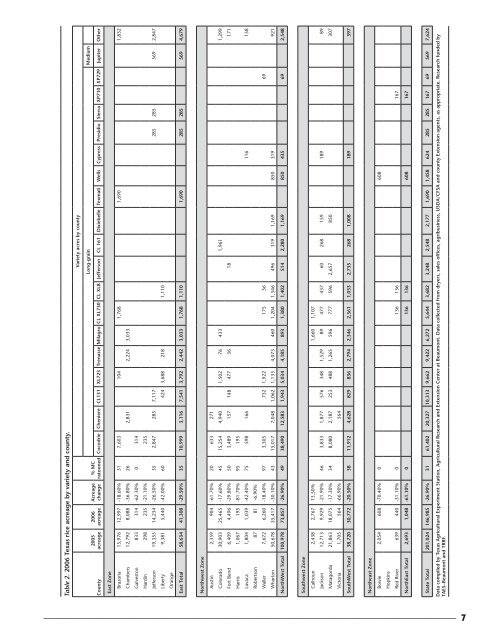
Table 2. 2006 <strong>Texas</strong> rice acreage by variety and county.<br />
Variety acres by county<br />
County<br />
2005<br />
acreage<br />
2006<br />
acreage<br />
Acreage<br />
change<br />
% MC<br />
r<strong>at</strong>ooned<br />
Long-grain Medium<br />
Cocodrie Cheniere CL131 XL723 Trenasse Milagro CL XL730 CL XL8 Jefferson CL 161 Dixiebelle Texm<strong>at</strong>i Wells Cypress Presidio Sierra XP710 XP729 Jupiter Other<br />
East Zone<br />
Brazoria 15,976 12,997 -18.60% 31 7,603 104 1,768 1,690 1,832<br />
Chambers 12,792 8,088 -36.80% 26 2,831 2,224 3,033<br />
Galveston 833 314 -62.30% 0 314<br />
Hardin 298 235 -21.10% 235<br />
Jefferson 19,355 14,234 -26.50% 35 2,847 285 7,117 285 285 569 2,847<br />
Liberty 9,381 5,440 -42.00% 60 424 3,688 218 1,110<br />
Orange<br />
East Total 58,634 41,308 -29.50% 35 10,999 3,116 7,541 3,792 2,442 3,033 1,768 1,110 1,690 285 285 569 4,679<br />
Northwest Zone<br />
Austin 2,359 904 -61.70% 20 633 271<br />
Colorado 30,903 25,465 -17.60% 45 15,254 4,940 1,502 76 433 1,961 1,299<br />
Fort Bend 6,409 4,496 -29.80% 50 3,489 157 148 477 36 18 171<br />
Harris 1,067 195 -81.70% 95 195<br />
Lavaca 1,804 1,039 -42.40% 75 598 166 116 158<br />
Robertson 87 81 -6.90%<br />
Waller 7,672 6,260 -18.40% 97 3,305 732 1,922 175 56 69<br />
Wharton 50,678 35,417 -30.10% 43 15,017 7,048 1,062 1,133 4,073 460 1,204 1,346 496 319 1,169 850 319 921<br />
NorthWest Total 100,978 73,857 -26.90% 49 38,490 12,583 1,943 5,034 4,185 893 1,380 1,402 514 2,280 1,169 850 435 69 2,548<br />
Southwest Zone<br />
Calhoun 2,438 2,767 13.50% 1,660 1,107<br />
Jackson 12,713 9,929 -21.90% 46 3,833 1,877 576 348 1,529 89 477 437 60 268 159 189 89<br />
M<strong>at</strong>agorda 21,863 18,075 -17.30% 34 8,080 2,187 253 488 1,265 596 777 596 2,657 850 307<br />
Victoria 1,705 564 -66.90% 564<br />
SouthWest Total 38,720 30,772 -20.50% 38 11,912 4,628 829 836 2,794 2,346 2,361 1,033 2,735 268 1,008 189 397<br />
Northeast Zone<br />
Bowie 2,054 608 -70.40% 0 608<br />
Hopkins<br />
Red River 639 440 -31.10% 0 136 136 167<br />
NorthEast Total 2,693 1,048 -61.10% 0 136 136 608 167<br />
St<strong>at</strong>e Total 201,024 146,985 -26.90% 31 61,402 20,327 10,313 9,662 9,422 6,272 5,644 3,682 3,248 2,548 2,177 1,690 1,458 624 285 285 167 69 569 7,624<br />
D<strong>at</strong>a compiled by <strong>Texas</strong> Agricultural Experiment St<strong>at</strong>ion, Agricultural <strong>Research</strong> and Extension <strong>Center</strong> <strong>at</strong> <strong>Beaumont</strong>. D<strong>at</strong>a collected from dryers, sales offices, agribusiness, USDA/CFSA and county Extension agents, as appropri<strong>at</strong>e. <strong>Research</strong> funded by<br />
TAES–<strong>Beaumont</strong> and TRRF.<br />
–––––––––––––––––––––––––––––––––––––––––––––––––––––––––––––––––––––––––––––––––––––